0556
Hyperpolarized 129Xe functional brain mapping1Chemistry and Materials Science Program, Lakehead University, Thunder Bay, ON, Canada, 2Thunder Bay Regional Health Research Institute, Thunder Bay, ON, Canada, 3Chemistry, Lakehead University, Thunder Bay, ON, Canada, 4Thunder Bay Regional Health Science Centre, Thunder Bay, ON, Canada, 5Northern Ontario School of Medicine, Thunder Bay, ON, Canada
Synopsis
Functional magnetic resonance imaging (fMRI) localizes active regions of the brain during brain stimuli. In this work, we demonstrate hyperpolarized (HP) 129Xe fMRI in two classical fMRI experiments: a flashing visual stimulus and a fist-clenching motor stimulus. Using a chemical shift saturation recovery (CSSR) pulse sequence, our processed images localize brain activity to regions of the brain correlated to those identified using conventional Blood Oxygenation Level Dependent fMRI. The sensitivity of Xe fMRI was nearly two orders of magnitude greater than that of BOLD fMRI. In addition, 129Xe fMRI allows presenting stimuli with significantly smaller repetition frequencies.
Introduction
Although Blood Oxygenation Level Dependent (BOLD) functional MRI (fMRI) has proven to be a powerful tool in neuroscience1, there are two limitations associated with this approach which limit fMRI application. Firstly, the percent signal enhancement of the BOLD fMRI images is relatively low (around 2-7%)2,3. In addition, BOLD fMRI requires stimuli with a high repetition frequency. We hypothesized that Hyperpolarized (HP) 129Xe Chemical Shift Saturation Recovery (CSSR) can be used for hemodynamic response detection and can provide substantially higher signal enhancement compared to BOLD fMRI during significantly shorter scan time.Materials and Methods
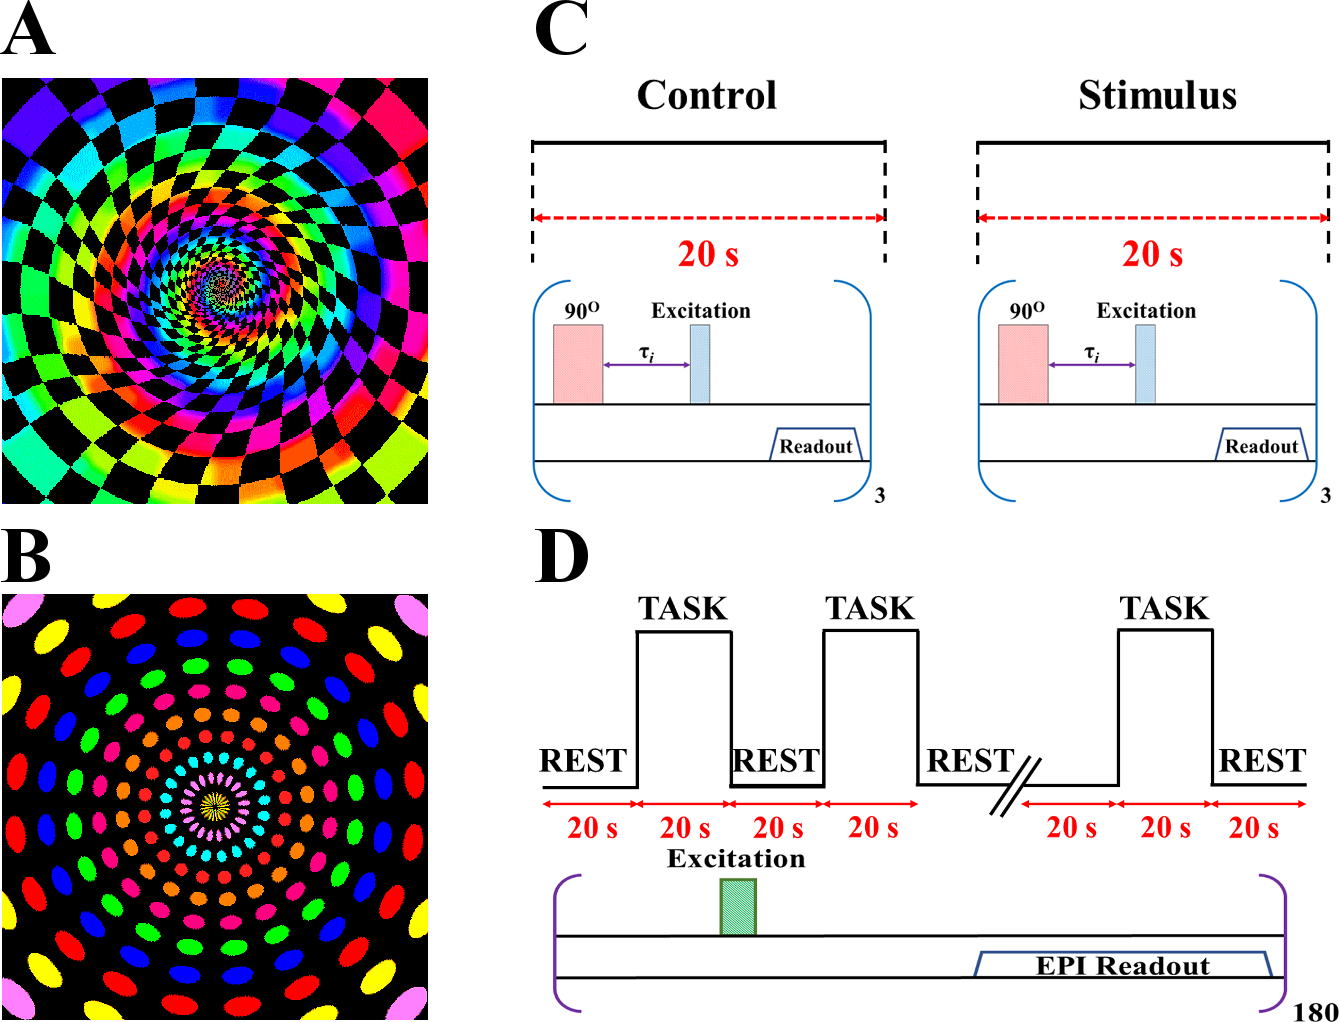
Nine healthy volunteers with the mean age of 38±22 were recruited for this study. Six of them were exposed to a flashing spiral visual stimulus (stimulus V1, Fig.1A), three were exposed to a flashing dotted visual stimulus (stimulus V2, Fig.1B), and three participants were exposed to a motor stimulus (left fist squeezing). A Philips Achieva 3T clinical MR scanner equipped with a dual-tuned 1H/129Xe head coil (Clinical MR Solution LLC, WI, USA) and an 8-channel Philips SENSE 1H coil was used in this study. Enriched 129Xe (83%) was polarized to ~50% using a commercial polarizer (Xemed LLC, NH, USA) and dispensed into two 1 L Tedlar bags. The participants inhaled 1 L of the HP 129Xe gas and held their breath for a period of 20 s. Each participant was given two Xe CSSR scan series: one baseline (watching a gray screen or motionless rest), and one with an external stimulus (visual or motor). The CSSR 129Xe scans with a Cartesian Gradient Echo (GRE) readout were acquired during the breath-hold in sagittal (visual stimuli, recovery times of 5s, 6.5s, and 8s), and axial (motor stimulus, recovery times of 6.5, 6.8, and 7.1s) projections. The following GRE pulse sequence parameters were used for image acquisition: FOV = 250x250 mm2, acquisition matrix 20x20, reconstruction matrix = 32x32, FA=20o, TR = 4ms, TE = 0.71ms, receiving bandwidth = 382 Hz/pixel. Slice thickness was equal to either 300 mm (sagittal) or to 70 mm (axial).Following 129Xe CSSR, 1H EPI BOLD fMRI scans were conducted using the following acquisition parameters: stimulus/rest duration=20 s, dynamic scan time=2 s, FOV = 250 x 250 x 116.84 mm3, acquisition matrix = 64 x 64, voxel size=3.91 x 3.91 x 3.91 mm3, TR/TE = 2000 ms/30 ms, FA = 90°, number of slices = 24. Overall, 18 stimulus/rest repetitions were performed and 180 dynamics were acquired.
Based on a previously studied model4, considering the wash-in phase and assuming that the relaxation of Xe in blood is a predominant factor of signal decay, it can be shown that the SNR of the CSSR images changes linearly with recovery time. The slope of the linear equation is proportional to the tissue perfusion in the voxel. Xe CSSR images were analyzed using the custom-written MATLAB script which created the slope maps of rest and stimulated CSSR scans followed by subtraction of the rest state from the stimulus to create an fMRI image.
The BOLD fMRI data were analyzed using SPM12 software package in MATLAB R2018b (The Mathworks, Inc, Natick, MA). Student’s t-test was performed in OriginPro 2016 software (OriginLab Corp., Northampton, MA) to evaluate the difference between the estimated percent signal enhancement calculated for the Xe functional brain maps and the BOLD fMRI. All images were converted into a neurological view.
Results and Discussion
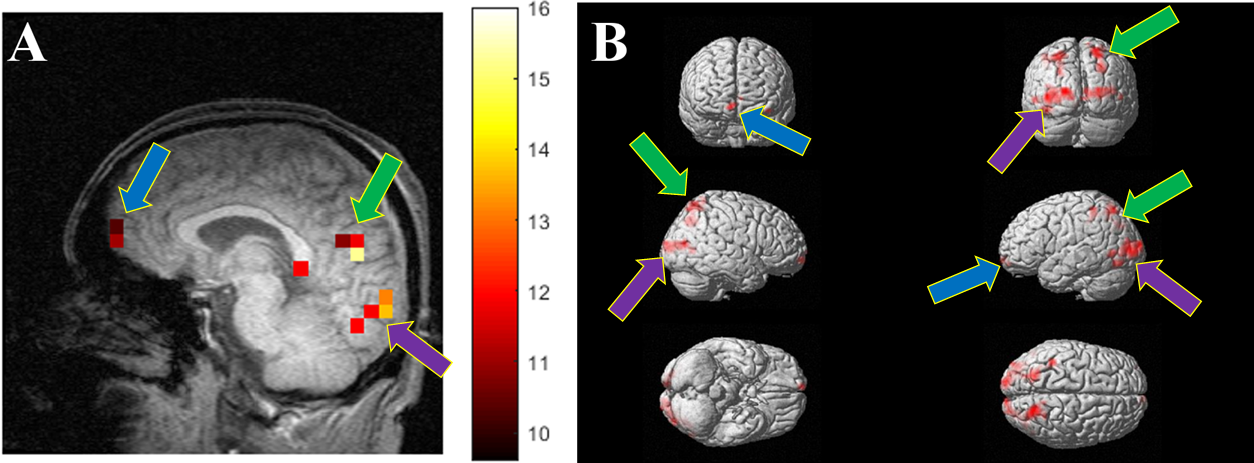
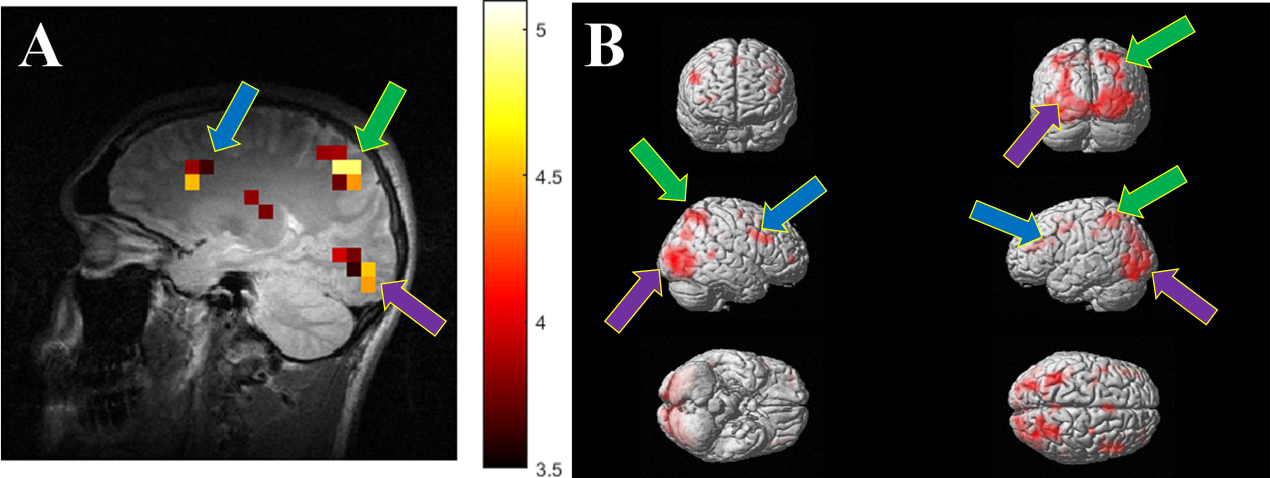
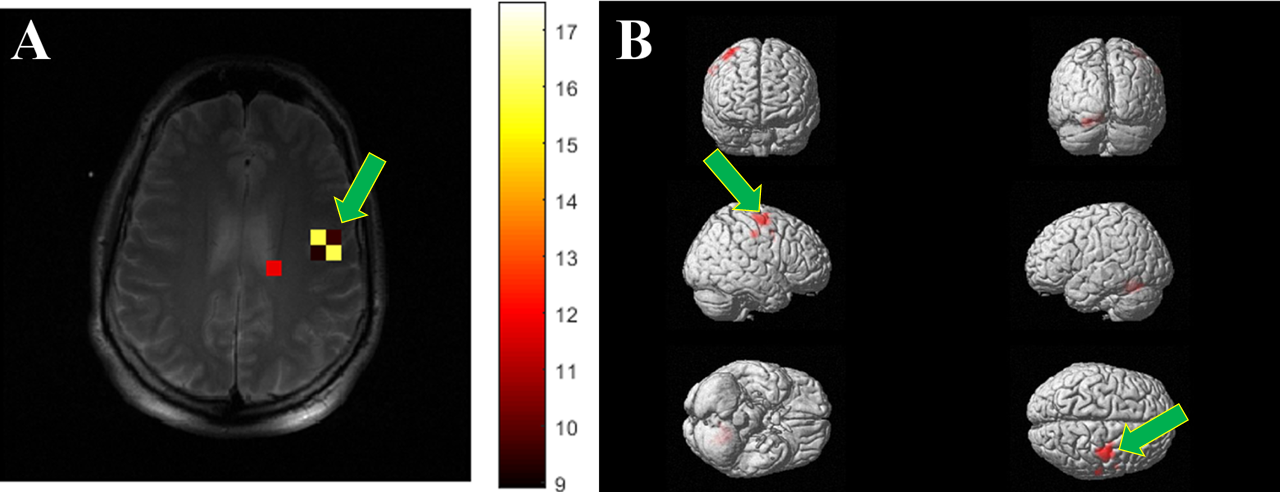
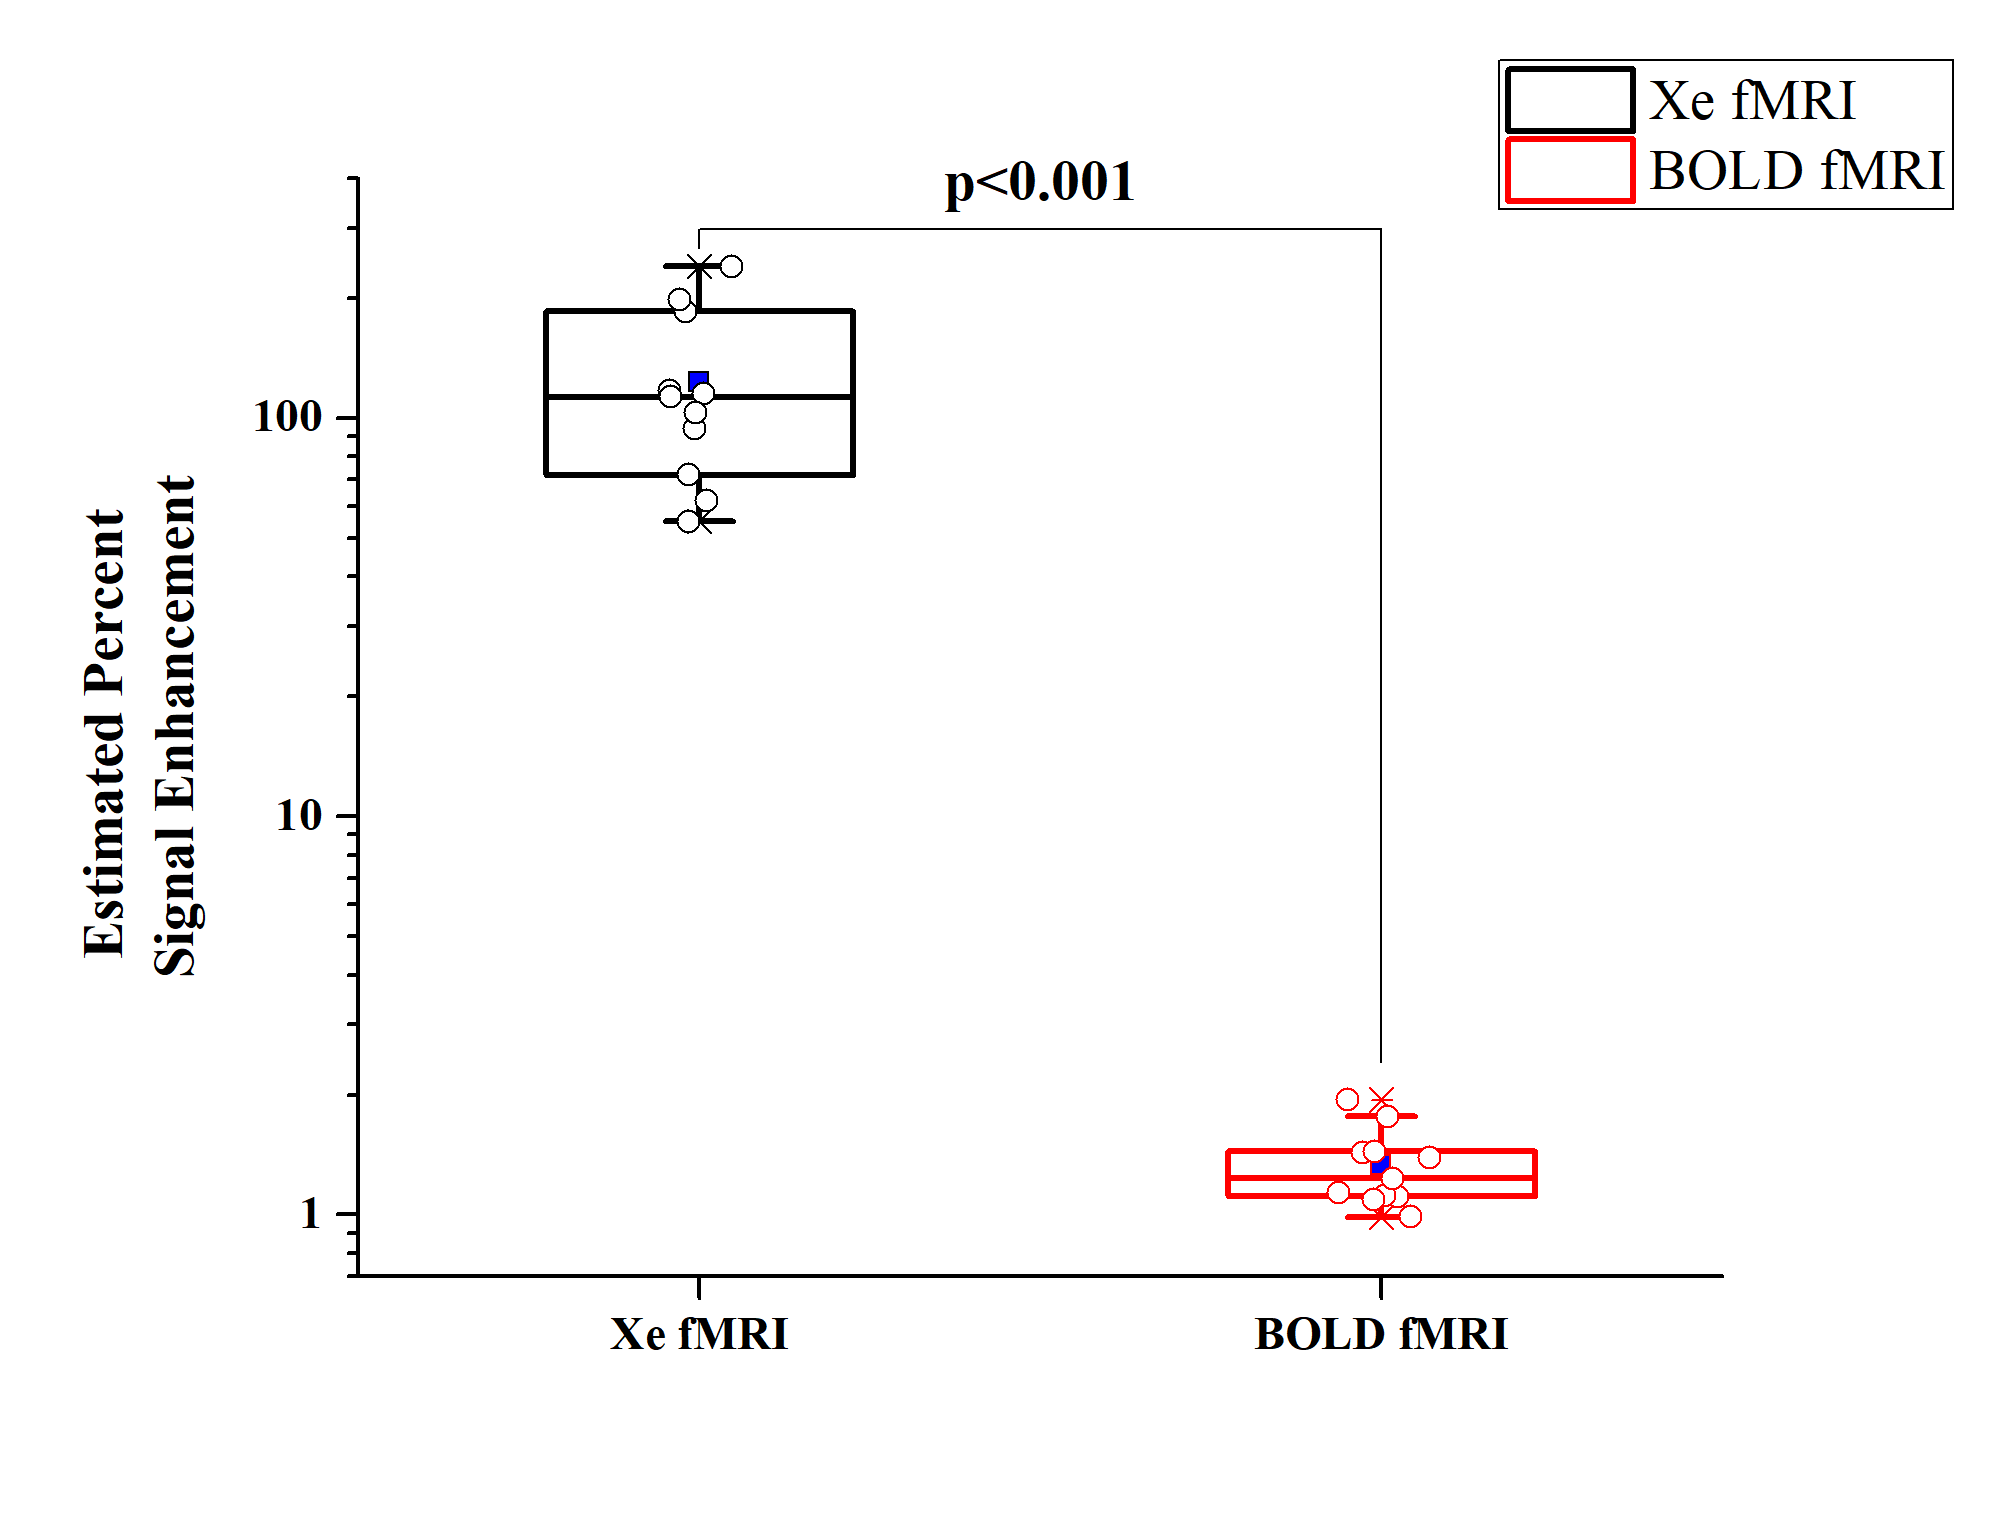
The task design used for Xe functional brain mapping and for BOLD fMRI is shown in Fig.1C. Fig.2 shows functional images of a representative healthy volunteer, acquired by 129Xe CSSR (Fig.2A) and BOLD (Fig.2B) fMRI during the stimulus V1. It can be seen that the functional images obtained from both modalities nicely correlate with localized neuronal activity to the occipital lobe of the cerebrum and superior parietal lobes. Fig.3 shows Xe CSSR (Fig.3A) and BOLD (Fig.3B) functional images acquired while the participant was exposed to the V2 stimulus. Both fMRI techniques showed the activation of the visual cortex, superior parietal lobes and left frontal gyrus. Finally, Fig. 4 shows Xe CSSR (Fig.4A) and BOLD (Fig.4B) functional images of the motor stimulus. It can be clearly seen, that the neuronal activity is localized to the motor cortex on the contralateral side of the brain relative to the clenched fist. Finally, Fig.5 shows the statistical comparison between Xe CSSR and BOLD fMRI. The percent signal enhancement of Xe CSSR fMRI was up to two orders of magnitude greater compared to BOLD fMRI (p < 0.001).Conclusion
Our study demonstrates a new approach of conducting functional imaging of the human brain using HP 129Xe MRI. This technique is based on the direct detection of the hemodynamic response and provides a signal enhancement significantly higher than 1H BOLD fMRI. In addition, the total scan time needed to generate a functional image was 40 s. Functional brain mapping using hyperpolarized 129Xe has a higher sensitivity and an ability to work with low repetition frequency stimuli.Acknowledgements
F.T.H. was supported by the BrightFocus Foundation and the Canadian Institutes for Health Research. Y.S. was supported by an Ontario Graduate Scholarship. V.G. was supported by an Ontario Trillium Scholarship. MSA thanks Dilip Balamore for stimulating discussions.References
1. Logothetis NK. What we can do and what we cannot do with fMRI. Nature. 2008;453(7197):869-878.
2. Miezin FM, Maccotta L, Ollinger JM, Petersen SE, Buckner RL. Characterizing the Hemodynamic Response: Effects of Presentation Rate, Sampling Procedure, and the Possibility of Ordering Brain Activity Based on Relative Timing. Neuroimage. 2000;11(6):735-759.
3. Perthen JE, Lansing AE, Liau J, Liu TT, Buxton RB. Caffeine-induced uncoupling of cerebral blood flow and oxygen metabolism: A calibrated BOLD fMRI study. Neuroimage. 2008;40(1):237-247.
4. Kilian W, Seifert F, Rinneber G. Dynamic NMR spectroscopy of hyperpolarized 129Xe in human brain analyzed by an uptake model. Magn Reson Med. 2004;51:843-847.
Figures