0553
A novel MRI-based quantitative water content atlas of the human brain1Medical Imaging Physics, Institute of Neuroscience and Medicine 4, Jülich, Germany, 2Institute of Neuroscience and Medicine 11, INM 11, JARA, Jülich, Germany, 3Department of Neurology, Faculty of Medicine, Aachen, Germany
Synopsis
Measurement of quantitative, tissue-specific MR properties such as water content or relaxation times using quantitative-MRI at clinical field strength is a well-explored topic. However, none of the commonly used standard brain atlases, e.g., MNI or JHU, provide quantitative information. Utilising the framework of quantitative-MRI of the brain, this work reports on the development of the first quantitative in-vivo water content atlas based on twenty healthy volunteers datasets. Additionally, water content maps from patients with pathological changes in the brain were compared voxel-wise. These results suggest that quantitative-MRI in combination with water content atlas allows careful and quantitative interpretation of disease.
Introduction
MRI is a very sensitive method to detect focal changes in the in vivo brain.1-6 Usually, this involves defining healthy standard brain atlases as a basis for the comparison of pathological brains. Currently, the use of such standard brain atlases is well established in the mapping community, but none of the commonly utilised standard brain or atlases7-9 provides quantitative information. This is remarkable; given that measurement of quantitative, tissue-specific MR properties, e.g., water content and relaxation times (T1, T2*) using quantitative MRI at clinical field strength (1.5 Tesla to 3 Tesla) is a well explored topic. In this work, a methodology to create the first quantitative atlas of the in vivo brain water content based on 20 healthy volunteers is presented; preliminary practical examples of its potential applications are also shown.Methods
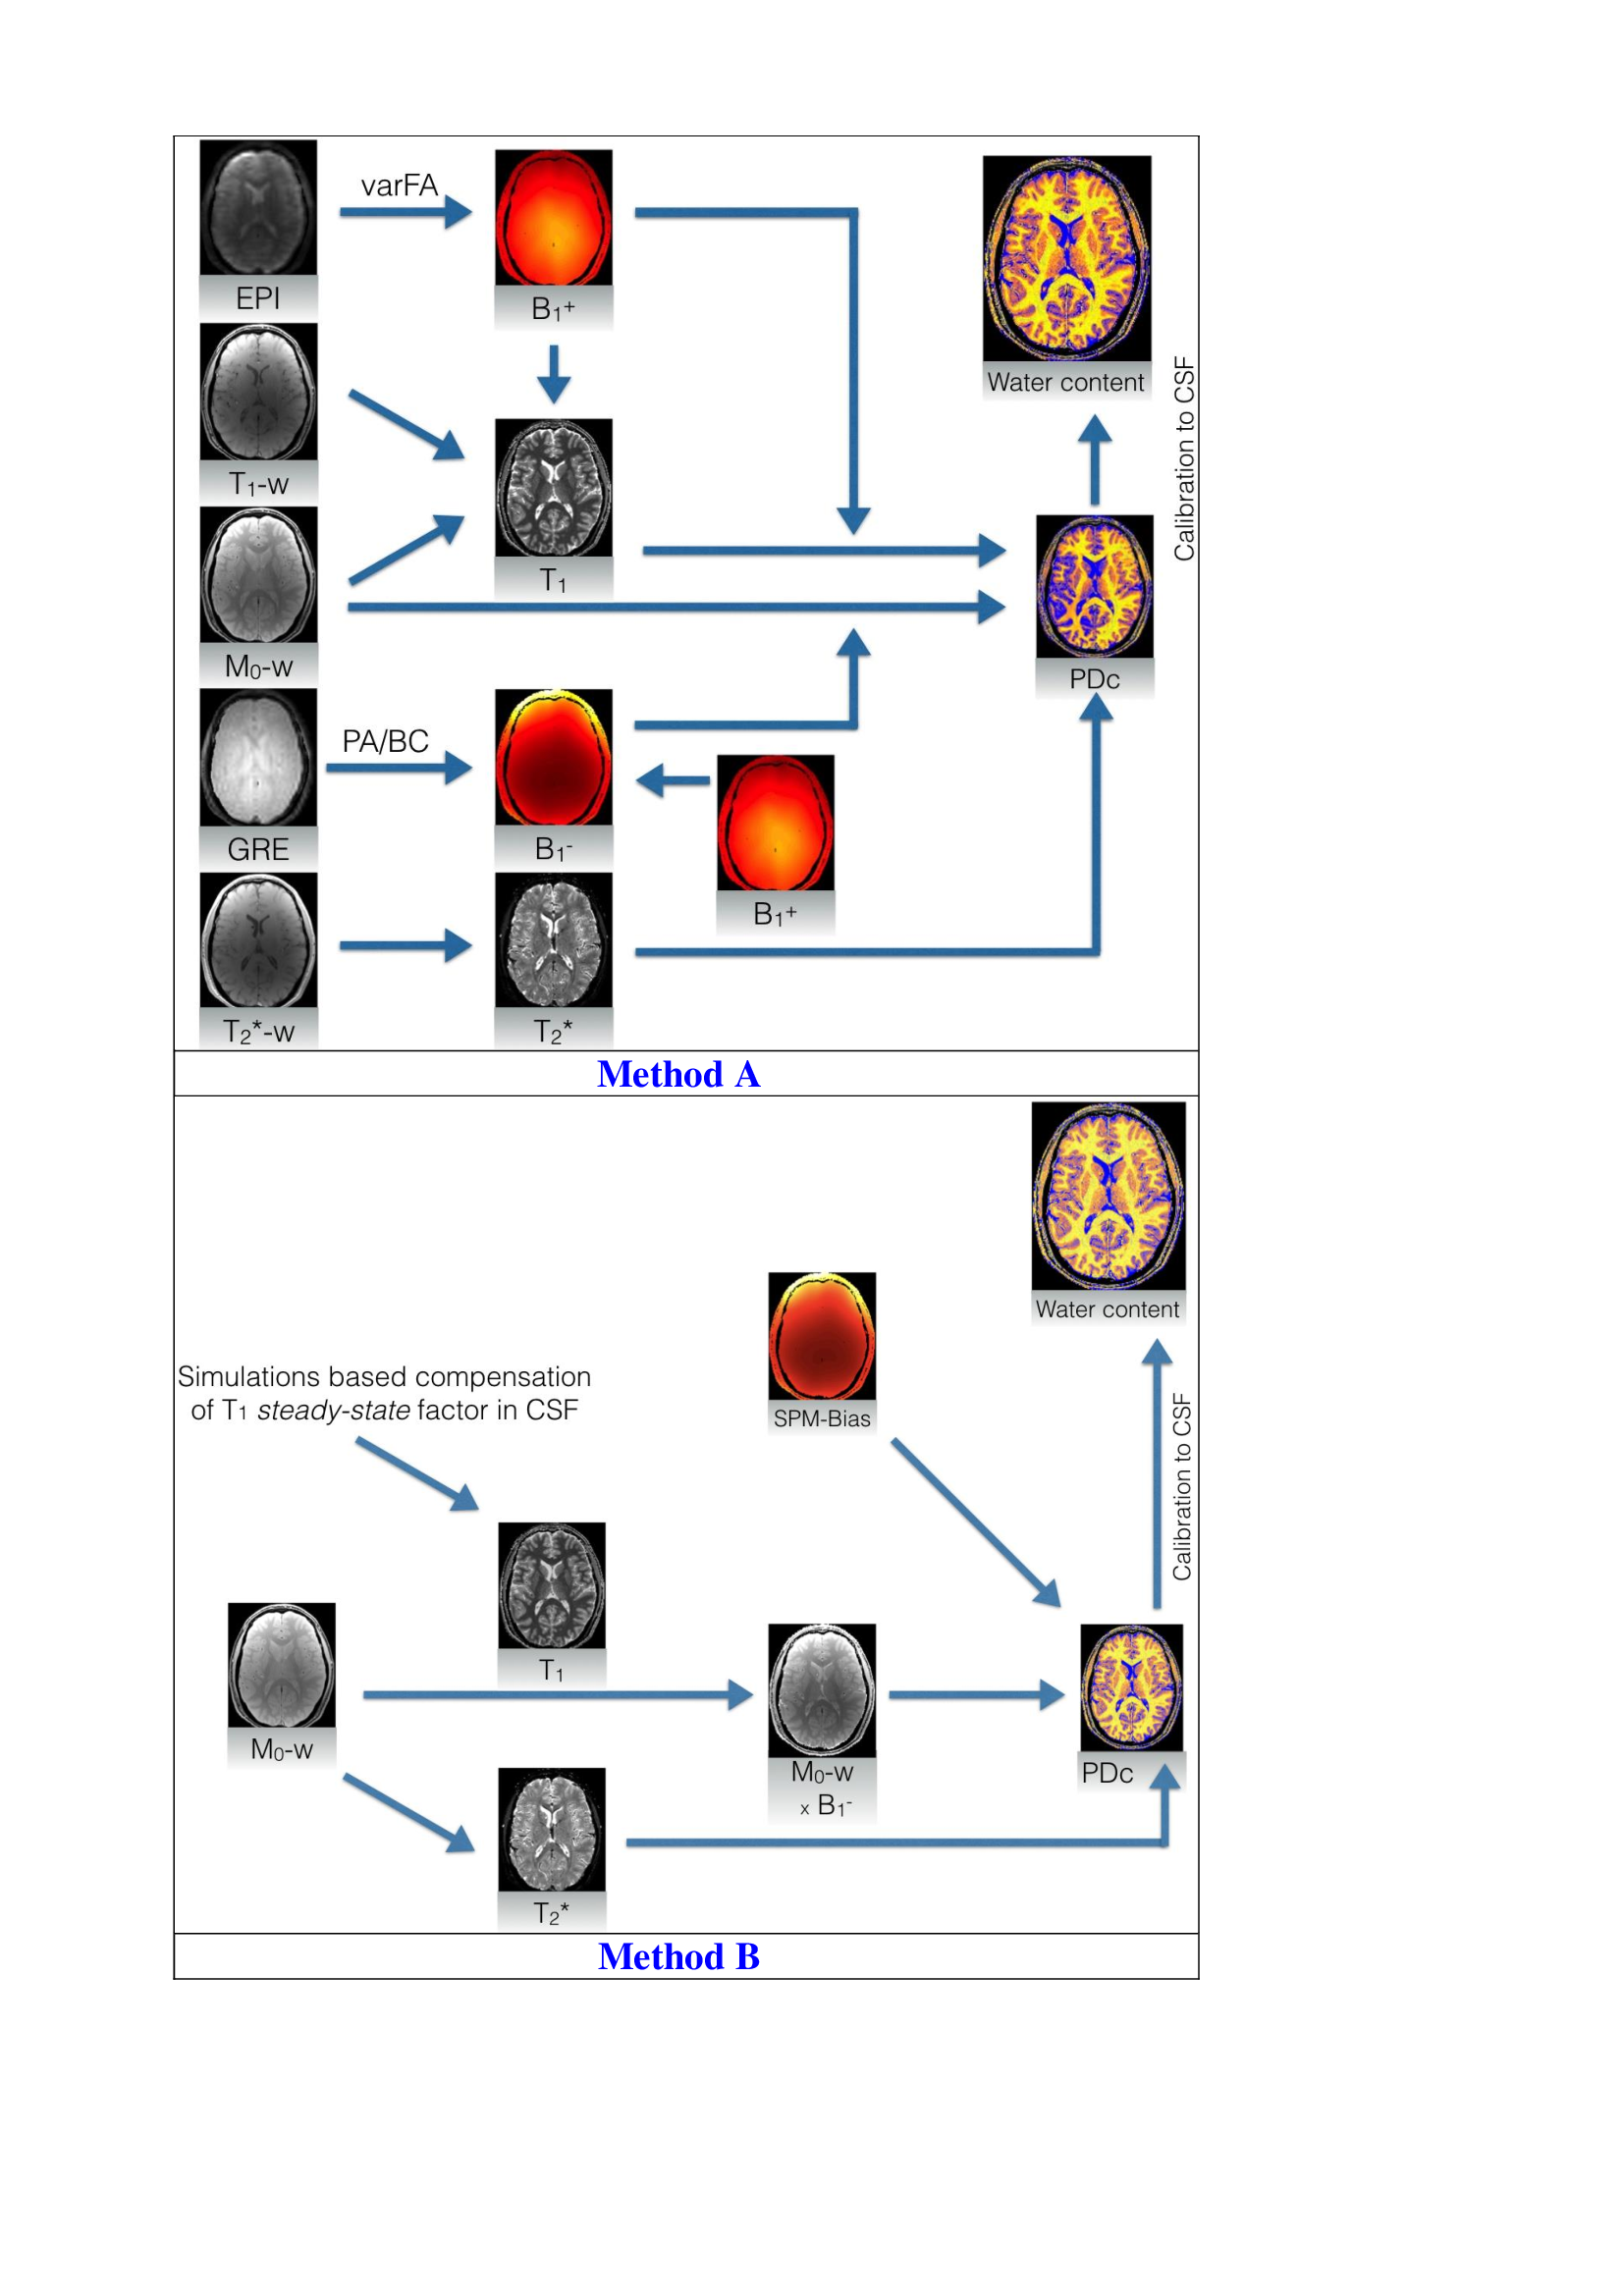
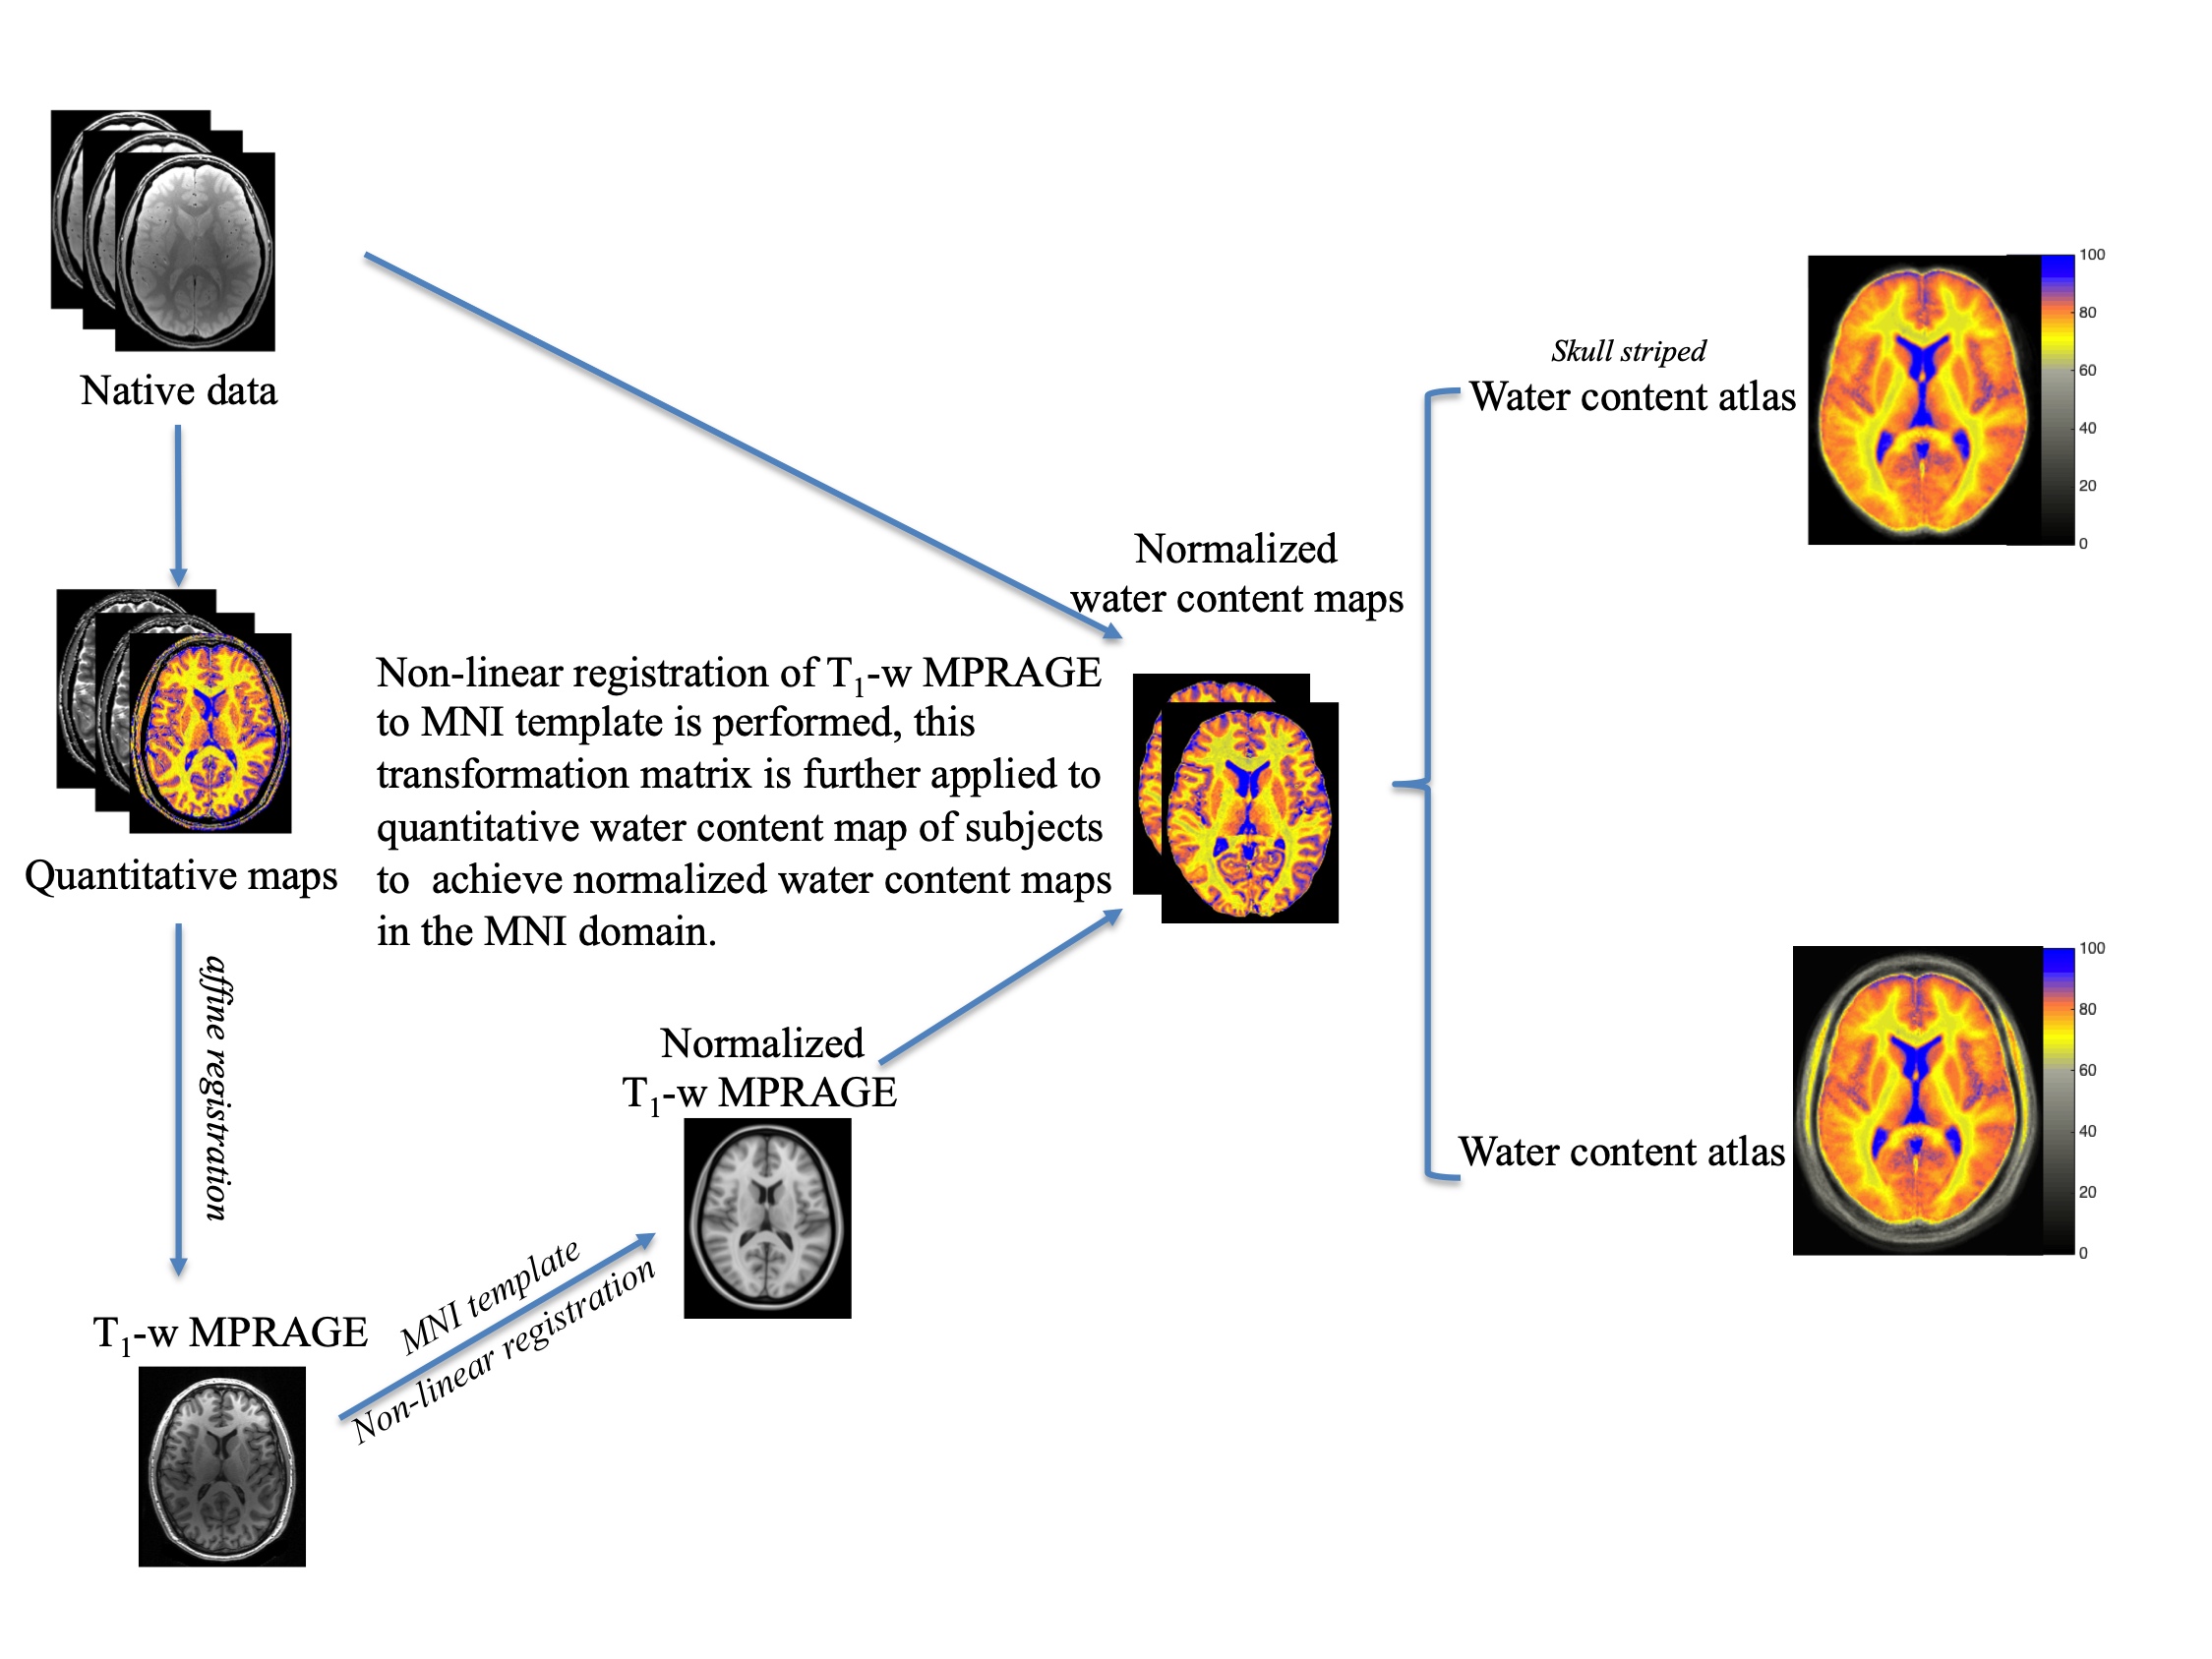
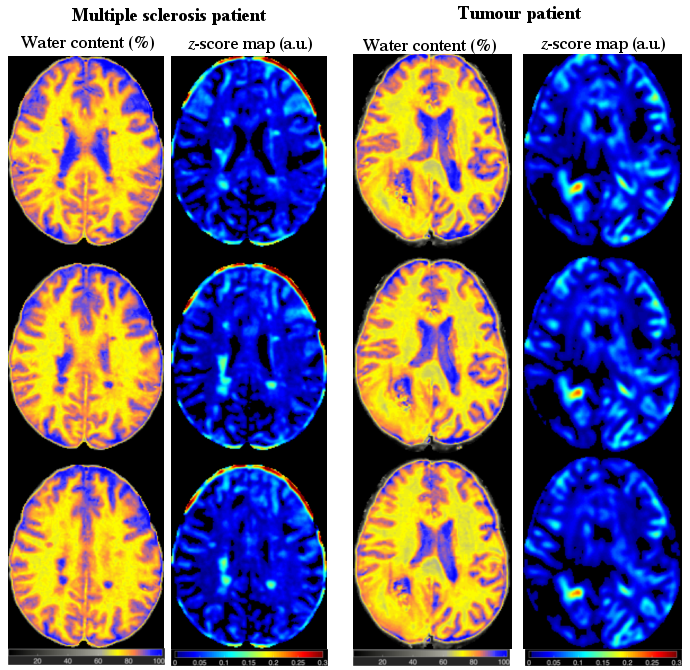
Twenty right-handed, healthy, male subjects (age 25.3 ± 2.5 years) were scanned on a Siemens Magnetom Tim-Trio scanner. A two-point method with intermediate TR (Method A)10,11 and a long TR method (Method B)12, which involve the Siemens gradient echo multiple echo sequence (GRE), were used for mapping the cerebral water content as well as the relaxation times (T1 and T2*). T1-weighted MPRAGE images and water content maps of all subjects were further registered to the MNI template (MNI-avg152T1-Brain template) using the Automatic Registration Toolbox (ART) (http://www.nitrc.org/projects/art).13 The normalized water content images (FW) were used for atlas generation in the following way. Voxel-wise trim mean value, coefficient of variance (CoV = standard deviation/trim mean value), and standard deviation using normalized water content maps over all subjects were calculated. The final result is a 1mm isotropic water content atlas with a probability for water content of each voxel based on the standard deviation. Patients suffering from brain tumour (Glioblastoma, male, 32 years) and multiple sclerosis (MS) (male, 38 years) were scanned with similar imaging protocols as the healthy volunteers. The patients’ water content maps were smoothed with a kernel of 12 mm Gaussian full width at half maximum (FWHM) and voxel-wise z-score maps were calculated using z-score = (FWPatient - FWAtlas) / Standard deviation FWAtlas and the differences were analysed using the two-tail t-test14.Results
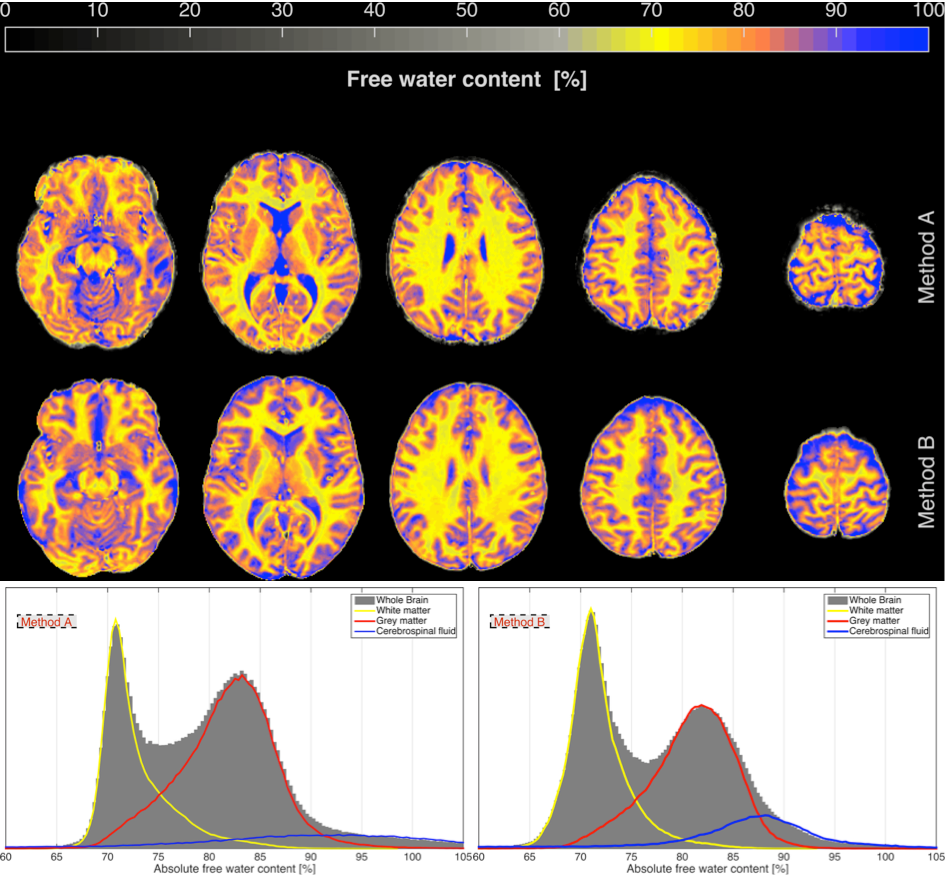
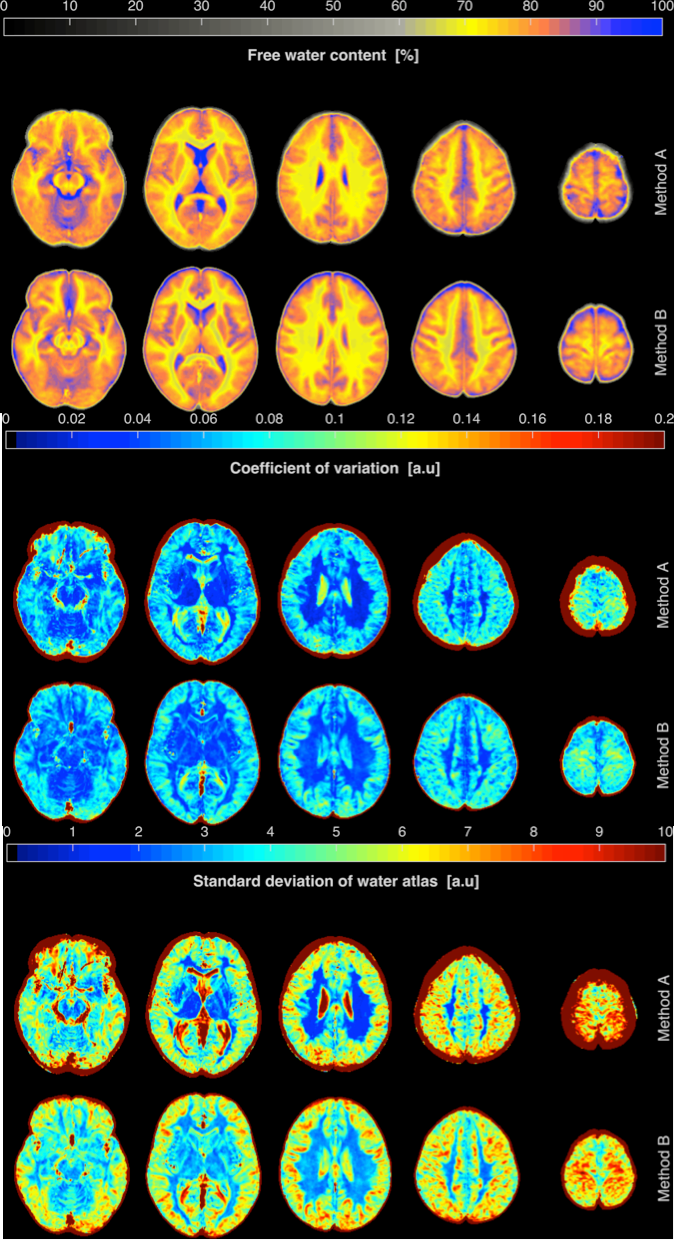
The workflows and entire post-processing chain to calculate the water content maps of all volunteers using Method A and Method B are schematically illustrated in Figure 1. Transverse slices of measured water content maps using both methods from a representative participant are shown in Figure 2a. Histograms of the whole brain water content maps are displayed in Figure 2b. Segmentation of the brain was performed and Gaussian fits over white matter (WM), grey matter (GM) and cerebrospinal fluid (CSF) regions are shown in the histogram. The average water content values over all volunteers obtained from the entire WM and the entire GM for Method A are 70.7(±3.6) and 80.7(±4.8), whereas the entire WM and entire GM using Method B obtained are 70.2(±3.7) and 80.9(±4.8). A schematic diagram for the generation of a quantitative water content brain atlas in MNI space coordinates is shown in Figure 3. Transverse slices from quantitative water content atlases acquired using water content maps from the healthy volunteers, the coefficient of variation map and the standard deviation map using Method A and Method B are displayed in Figure 4. Water maps of a MS patient acquired using Method A and from a tumour patient using Method B are compared to the water content atlas. Three slices of the water content from the MS patient and tumour patient and the voxel-wise z-score maps were computed14 and used to access the structural difference displayed in Figure 5. The tmean water content atlas values accessed in WM and GM ROIs are in good agreement within methods and are also in agreement with the valutes reported in the literature.10-12Discussion and conclusion
In this work, previously validated experimental protocols for water content mapping were used to develop and introduce the first quantitative water content brain atlas in vivo in the MNI domain (1mm3). This approach helped to minimise the effect of brain sizes and intra-subject cortical variations. The atlases generated by both experimental methods were evaluated and analysed in order to investigate systematic differences between them and the input water maps (e.g., from patient). Both experimental approaches studied here provide stable and reliable results, representing the average cerebral water content of a healthy population.Acknowledgements
We thank Ms. Claire Rick for proof reading the manuscript.References
1. Ashburner J, Friston KJ. Voxel-based morphometry--the methods. Neuroimage. 2000;11(6 Pt 1):805-21.
2. Gaser C. Morphometrie. Funktionelle Bildgebung in Psychiatrie und Physiotherapie. . H. Walter. Stuttgart: 2005.
3. Good CD, Johnsrude IS, Ashburner J, Henson RN, Friston KJ, Frackowiak RS. A voxel-based morphometric study of ageing in 465 normal adult human brains. Neuroimage. 2001;14(1 Pt 1):21-36.
4. Mechelli A, Crinion JT, Noppeney U, O'Doherty J, Ashburner J, Frackowiak RS, et al. Neurolinguistics: structural plasticity in the bilingual brain. Nature. 2004;431(7010):757.
5. Mechelli A, Friston KJ, Frackowiak RS, Price CJ. Structural covariance in the human cortex. J Neurosci. 2005;25(36):8303-10.
6. Wright IC, McGuire PK, Poline JB, Travere JM, Murray RM, Frith CD, et al. A voxel-based method for the statistical analysis of gray and white matter density applied to schizophrenia. Neuroimage. 1995;2(4):244-52.
7. Mazziotta JC, Toga AW, Evans A, Fox P, Lancaster J. A probabilistic atlas of the human brain: theory and rationale for its development. The International Consortium for Brain Mapping (ICBM). Neuroimage. 1995;2(2):89-101.
8. Talairach J, Tournoux P. Co-planar stereotaxic atlas of the human brain : 3-dimensional proportional system : an approach to cerebral imaging. Stuttgart ; New York: Georg Thieme; 1988. 122 p. p.
9. Mandal PK, Mahajan R, Dinov ID. Structural brain atlases: design, rationale, and applications in normal and pathological cohorts. J Alzheimers Dis. 2012;31 Suppl 3:S169-88.
10. Neeb H, Zilles K, Shah NJ. A new method for fast quantitative mapping of absolute water content in vivo. Neuroimage. 2006;31(3):1156-68.
11. Abbas Z, Gras V, Mollenhoff K, Keil F, Oros-Peusquens AM, Shah NJ. Analysis of proton-density bias corrections based on T1 measurement for robust quantification of water content in the brain at 3 Tesla. Magn Reson Med. 2014;72(6):1735-45.
12. Oros-Peusquens AM, Keil F, Langen KJ, Herzog H, Stoffels G, Weiss C, et al. Fast and accurate water content and T2*mapping in brain tumours localised with FET-PET. Nucl Instrum Meth A. 2014;734:185-90.
13. Ardekani BA, Guckemus S, Bachman A, Hoptman MJ, Wojtaszek M, Nierenberg J. Quantitative comparison of algorithms for inter-subject registration of 3D volumetric brain MRI scans. J Neurosci Methods. 2005;142(1):67-76.
14. Wang Z, Bovik AC, Sheikh HR, Simoncelli EP. Image quality assessment: from error visibility to structural similarity. IEEE Trans Image Process. 2004;13(4):600-12.
Figures