0551
Calculation of Concentration of Contrast Media, Relaxivity, Extracellular pH and Oxygen Extraction Fraction for Brain Tumor Characterization1Tokushima University, Tokushima, Japan, 2Research & Development Group, Hitachi, Ltd., Tokyo, Japan, 3Healthcare Business Unit, Hitachi, Ltd., Tokyo, Japan
Synopsis
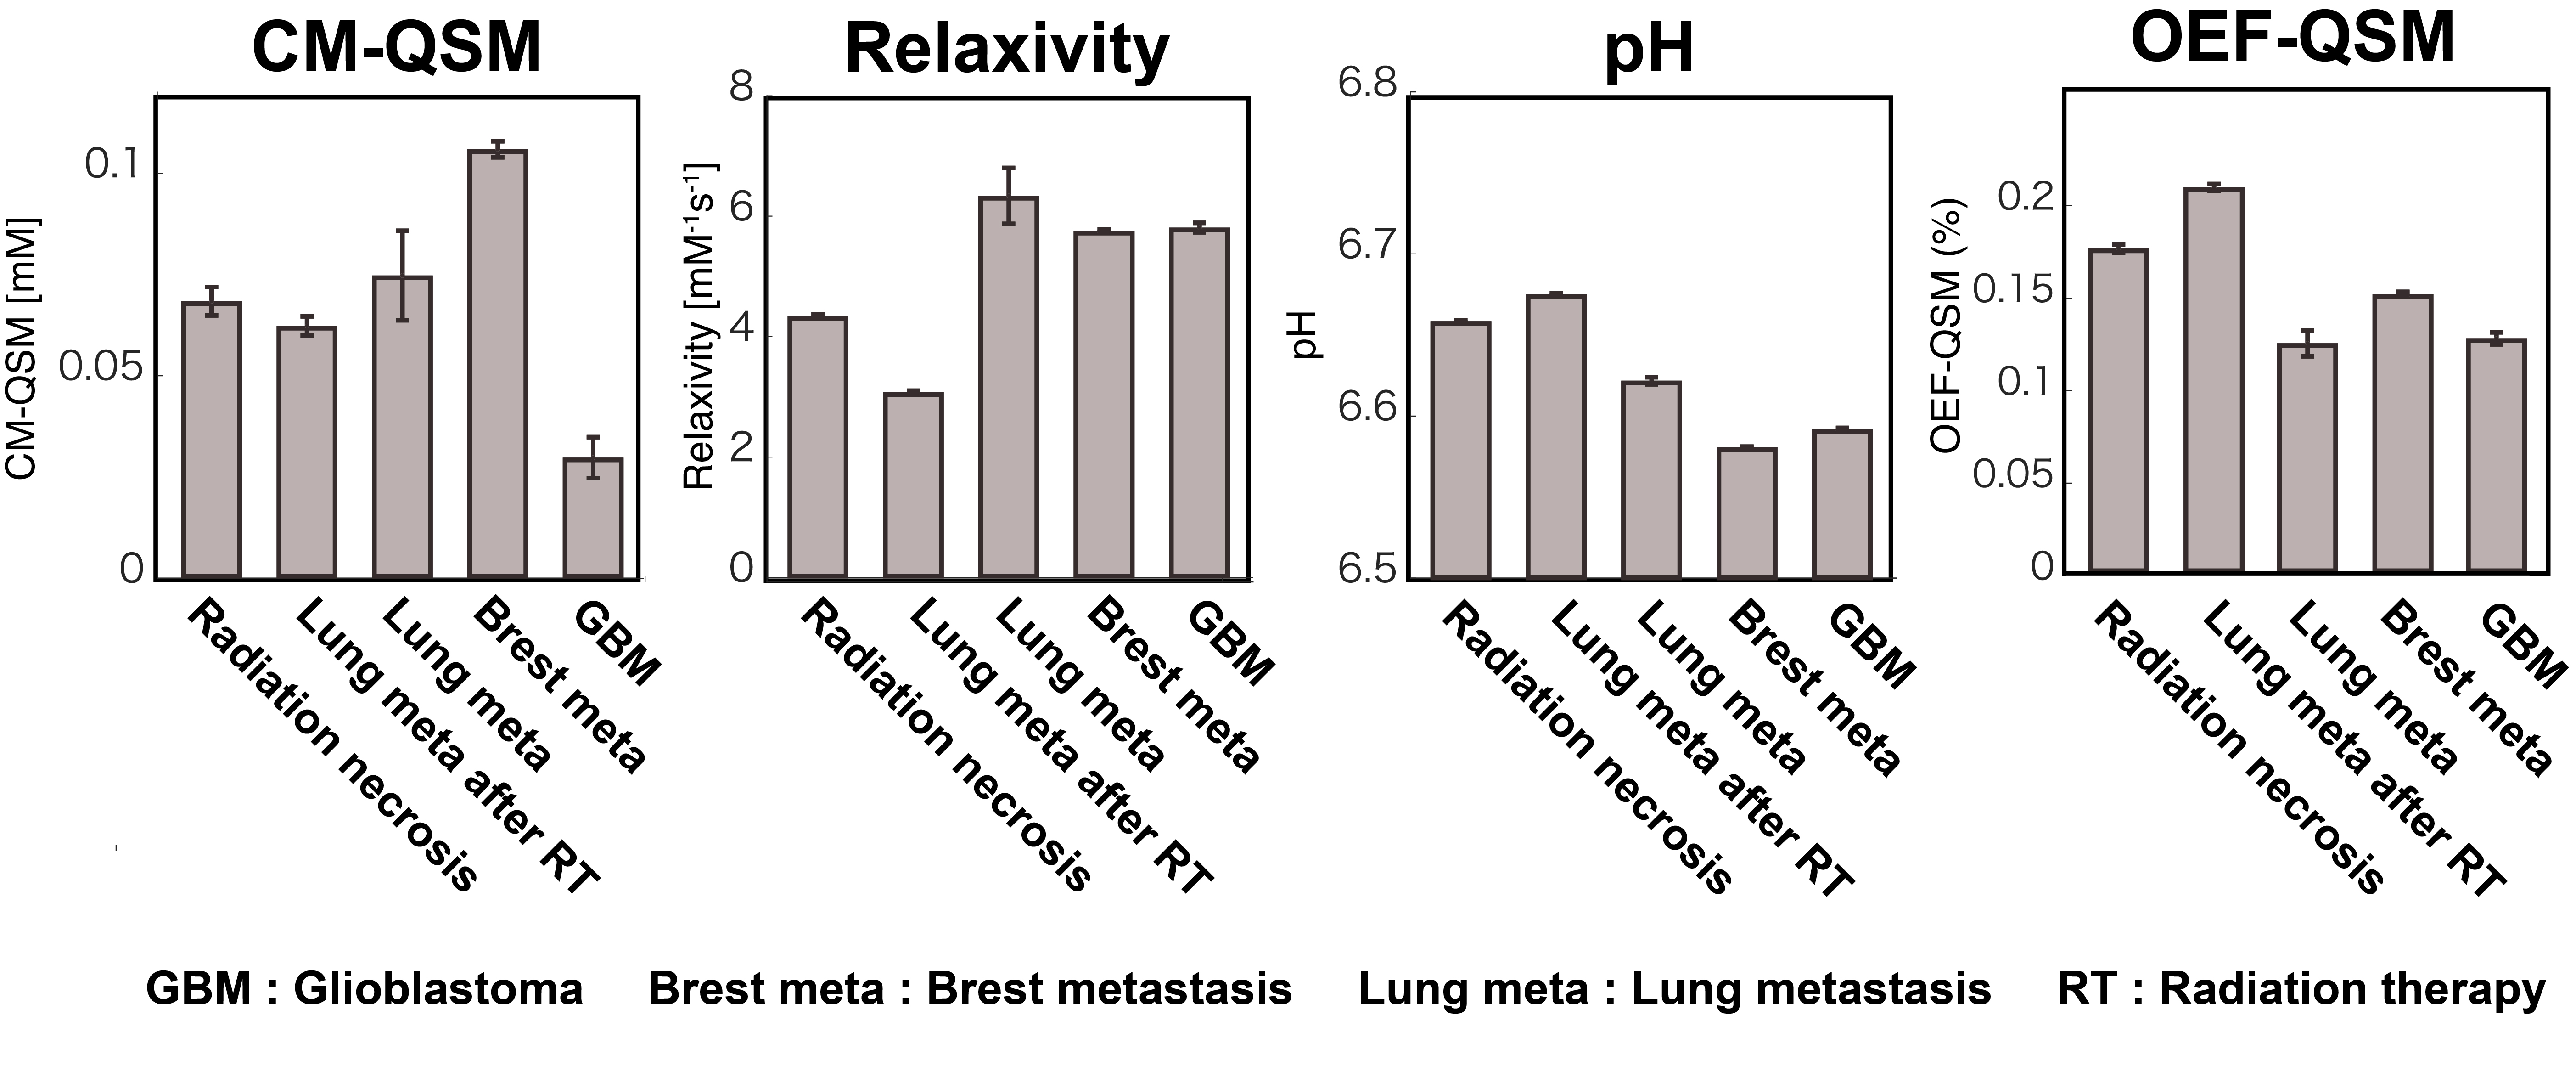
Concentration of contrast agent (CM), relaxivity (r1), extracellular pH (pHe), and oxygen extraction fraction (OEF), maps were calculated for detecting changes in tissue environment of brain diseases. As a result, the pHe value on glioblastoma or brain metastasis region was significantly lower than that on radiation necrosis (see Fig.3; P < 0.001). The OEF value on glioblastoma region recorded significantly lower values than radiation necrosis and lung metastasis (P < 0.001) while there was no significant difference amongst glioblastoma, breast metastasis, and lung metastasis (P > 0.05).
Introduction and Purpose
Quantitative parameter mapping (QPM) is a quantitative calculation technique that can simultaneously obtain several 3-D datasets, such as T1, T2, fluid-attenuated inversion recovery (FLAIR), proton density (PD) weighted images and quantitative susceptibility mapping (QSM) [1].Our purpose was to develop calculation methods that quantitative calculation of concentration using contrast agent (CM), relaxivity (r1), extracellular pH (pHe), and oxygen extraction fraction (OEF) for detecting changes in tissue environment in brain diseases.
Materials and Methods
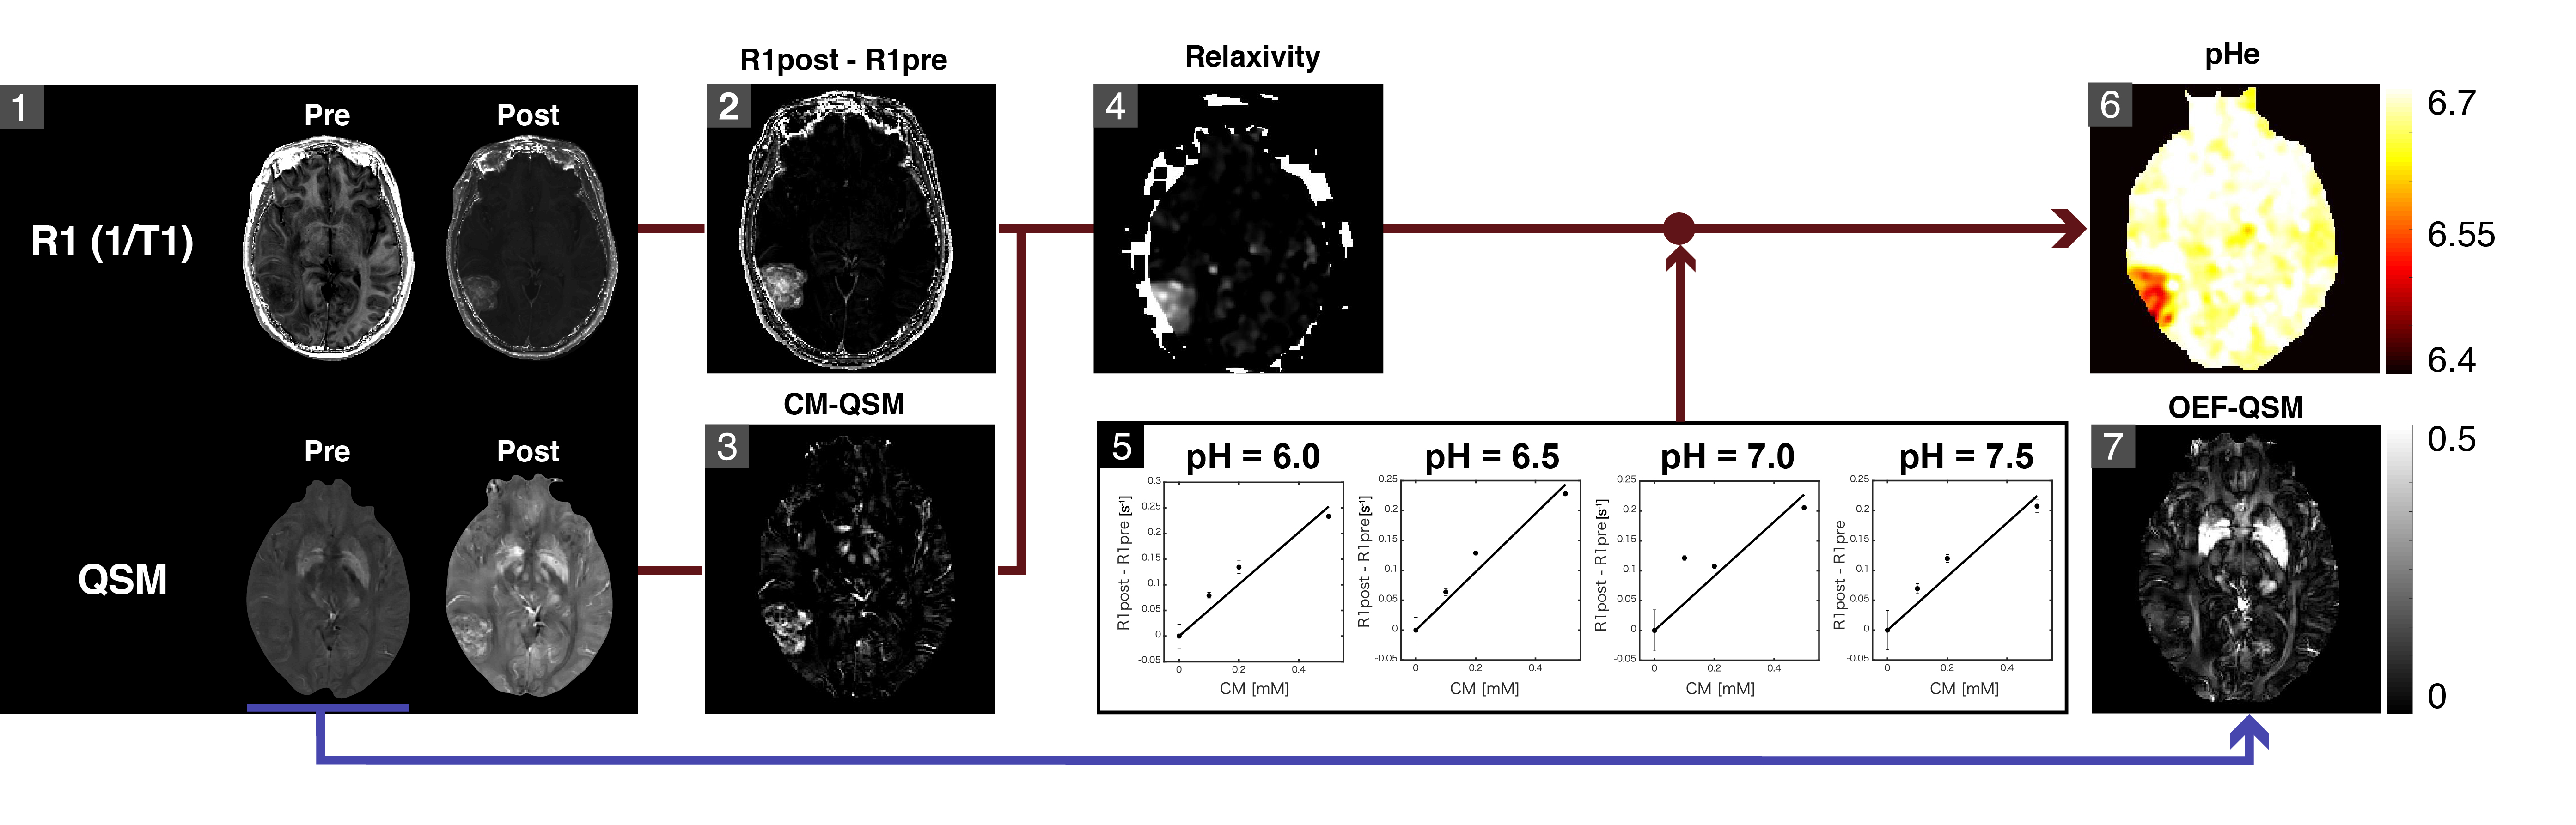
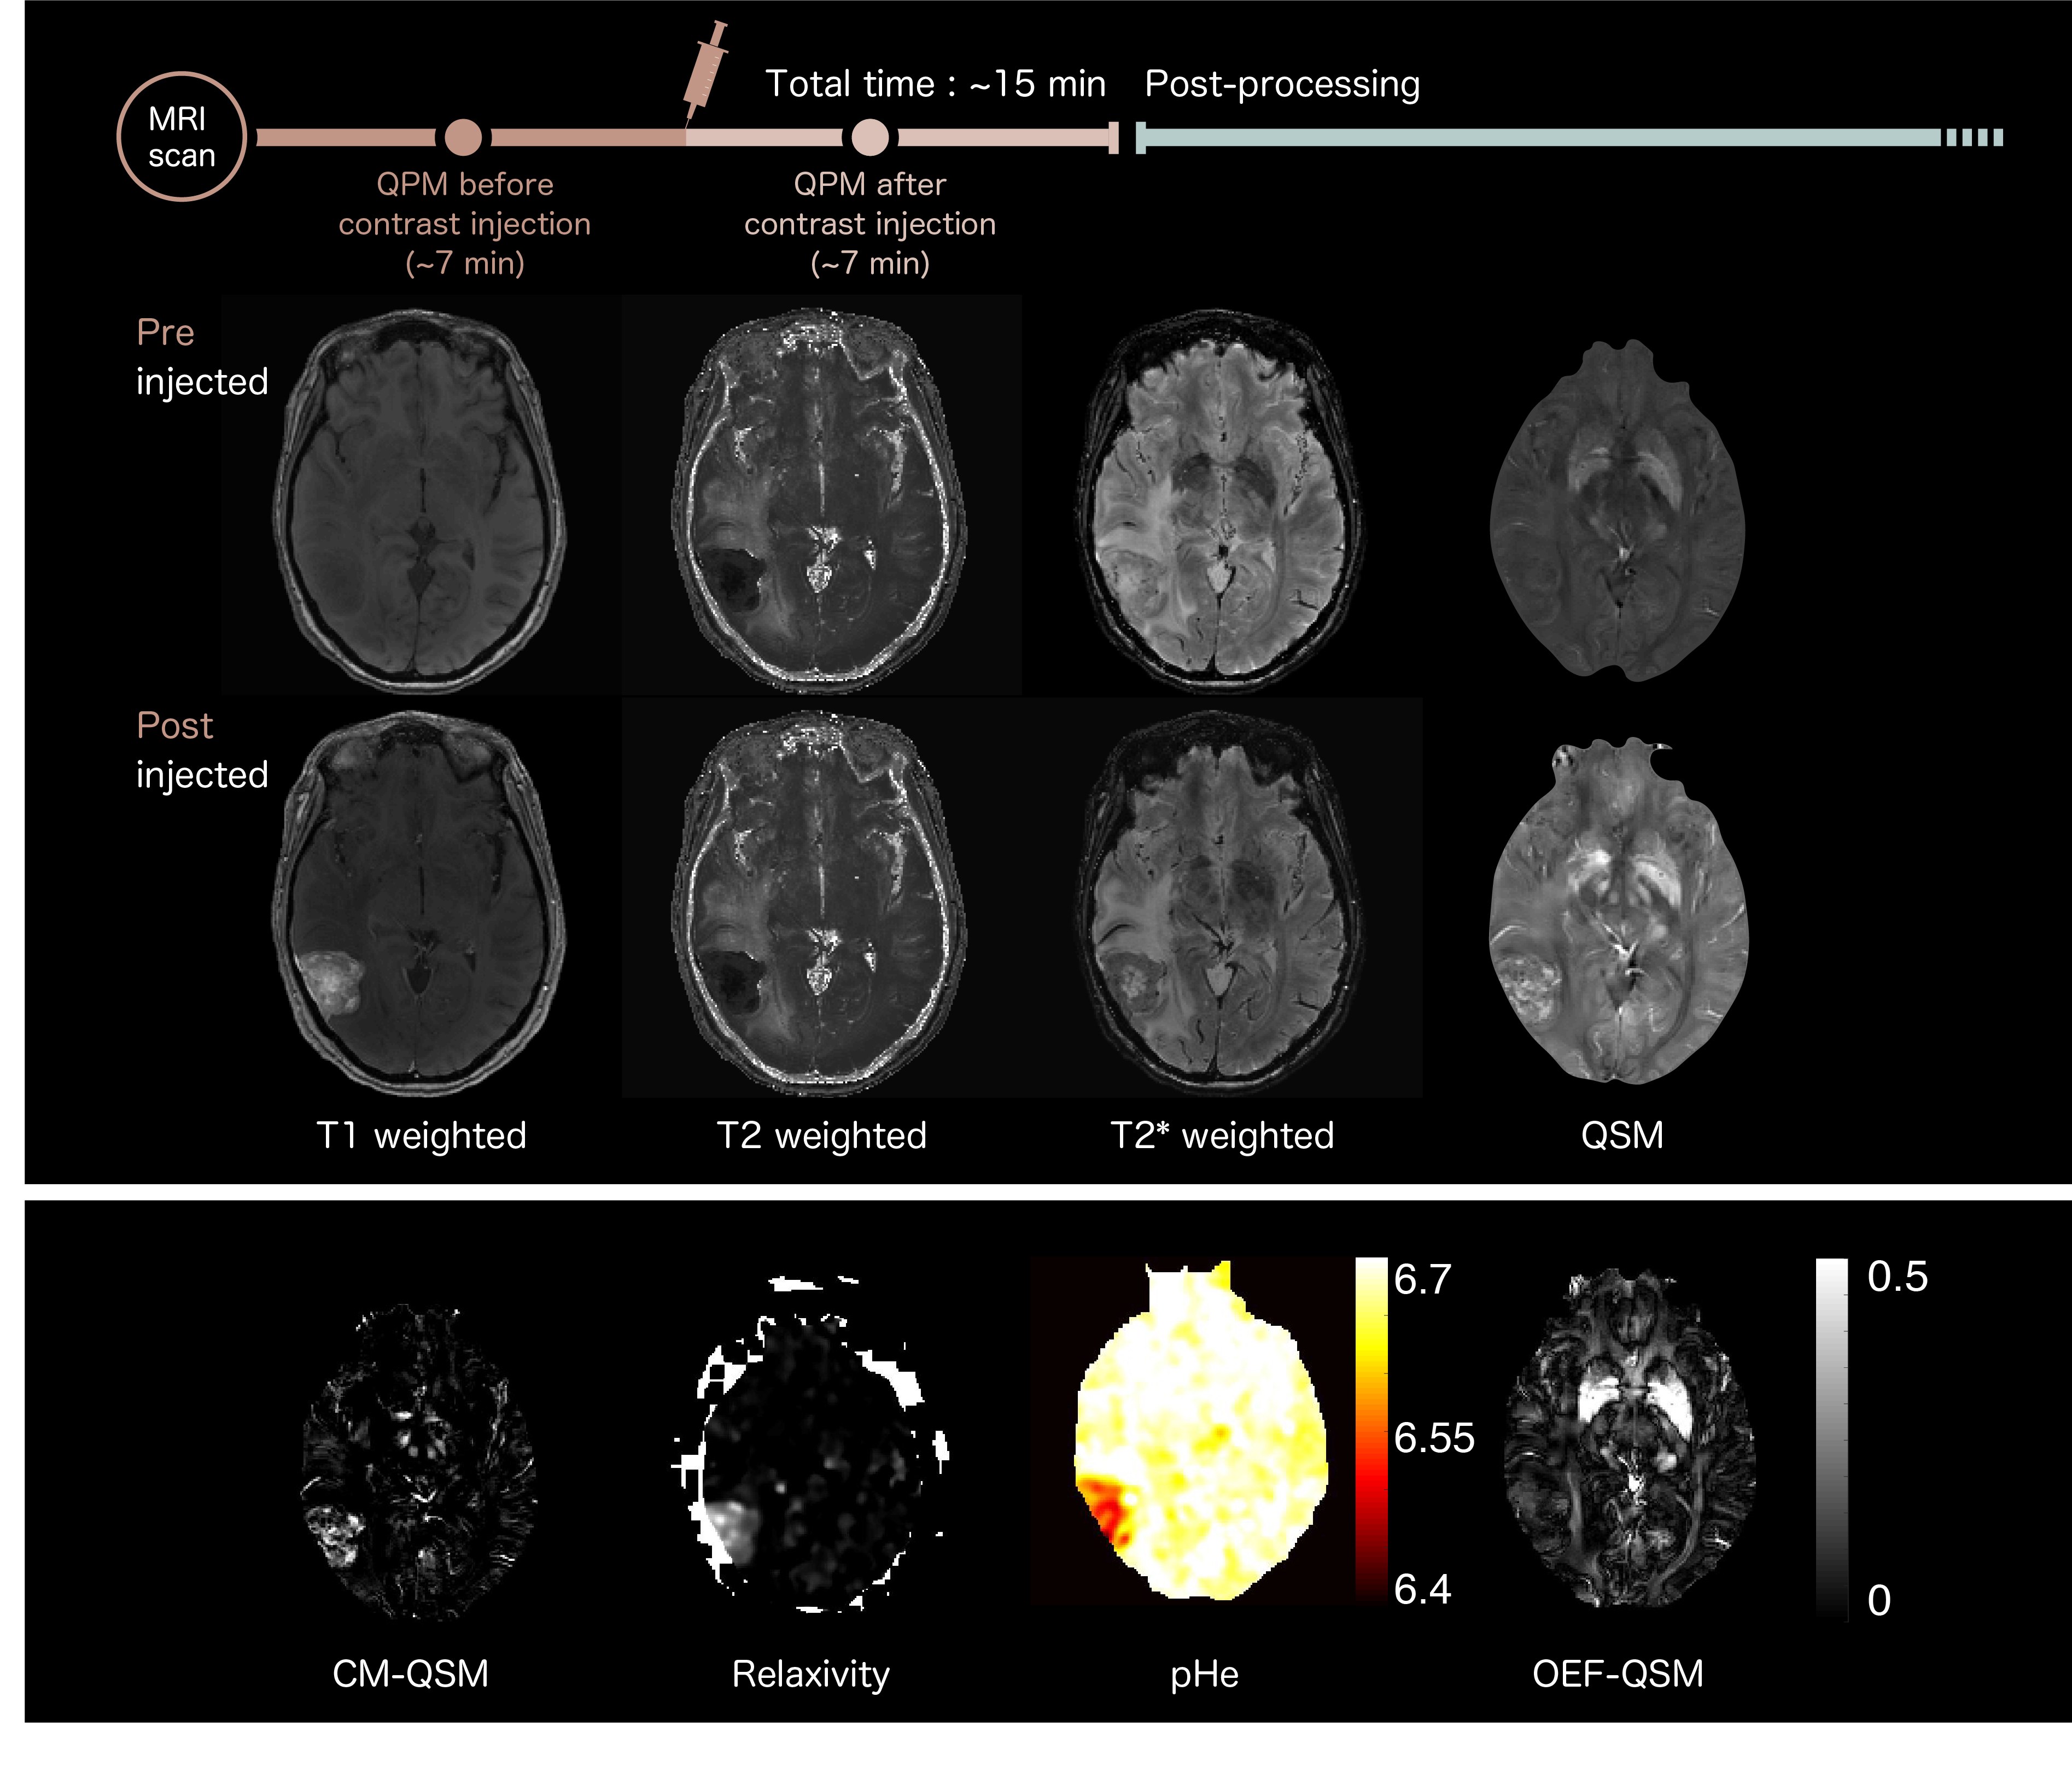
The studies were approved by the local institutional review board and performed on five brain tumor patients. All MRI data was performed on a 3T MRI system (Hitachi, Ltd.) using a QPM both before and after injection of contrast media (Gd-BTDO3A; Gadovist ®). The imaging parameters for QPM imaging were echo time, 4.6–32.3 ms (5 echoes); field of view, 24 cm; matrix size, 256 × 256; slice thickness, 2 mm. Then, CM, r1, extracellular pH, and OEF mapping were calculated as shown in a 7-step procedure (see Fig.1).1. QSM [2] and R1 (1/T1) map both before and after injection were calculated from QPM image dataset.
2. Subtracted map of R1 (R1sub) was calculated from R1 map both before and after injection:
$$$ R1_{sub} = R1_{post} - R1_{pre}$$$
3. CM map of Gd-BTDO3A was calculated from QSM map both before and after injection:
$$$CM = \frac{QSM_{post}-QSM_{pre}}{\chi_{Gd-BTDO3A}}\times mol_{Gd-BTDO3A}$$$
4. Relaxivity r1 of brain diseases was calculated from CM and R1sub :
$$$r1 = \frac{R1_{sub}}{CM}$$$
Then, Gaussian filter was applied to the calculated relaxivity map (σ=2).
5. The relaxivity-pH curve was obtained by performing a phantom study using linear regression analysis among a different concentration of the Gd-BTDO3A each pH value.
6. pHe map was calculated from the relaxivity map by applying the relaxivity-pH curve:
$$$pHe = 6.57-log_{10}\left[\frac{r1-4.48}{5.20-r1}\right]^{1.03}$$$
7. OEF of areas surrounding the affected brain area was estimated using QSM before injection [3,4] :
$$$OEF = \frac{\mid QSM_{pre} \mid \times 7.0}{0.8 \times 0.45}$$$
After obtaining these quantitative maps, a region of interest (ROI) was set in the tumor region on the calculated mapping. Initially, linear regression analysis was performed between CM-QSM and R1sub. Statistical significance of differences in the patients was then calculated to compare whether changes in the calculated mapping were dependent on brain diseases (Mann–Whitney U-test; P-value > 0.05). Additionally, the relationship between pH and OEF value was confirmed.
Results and Discussions
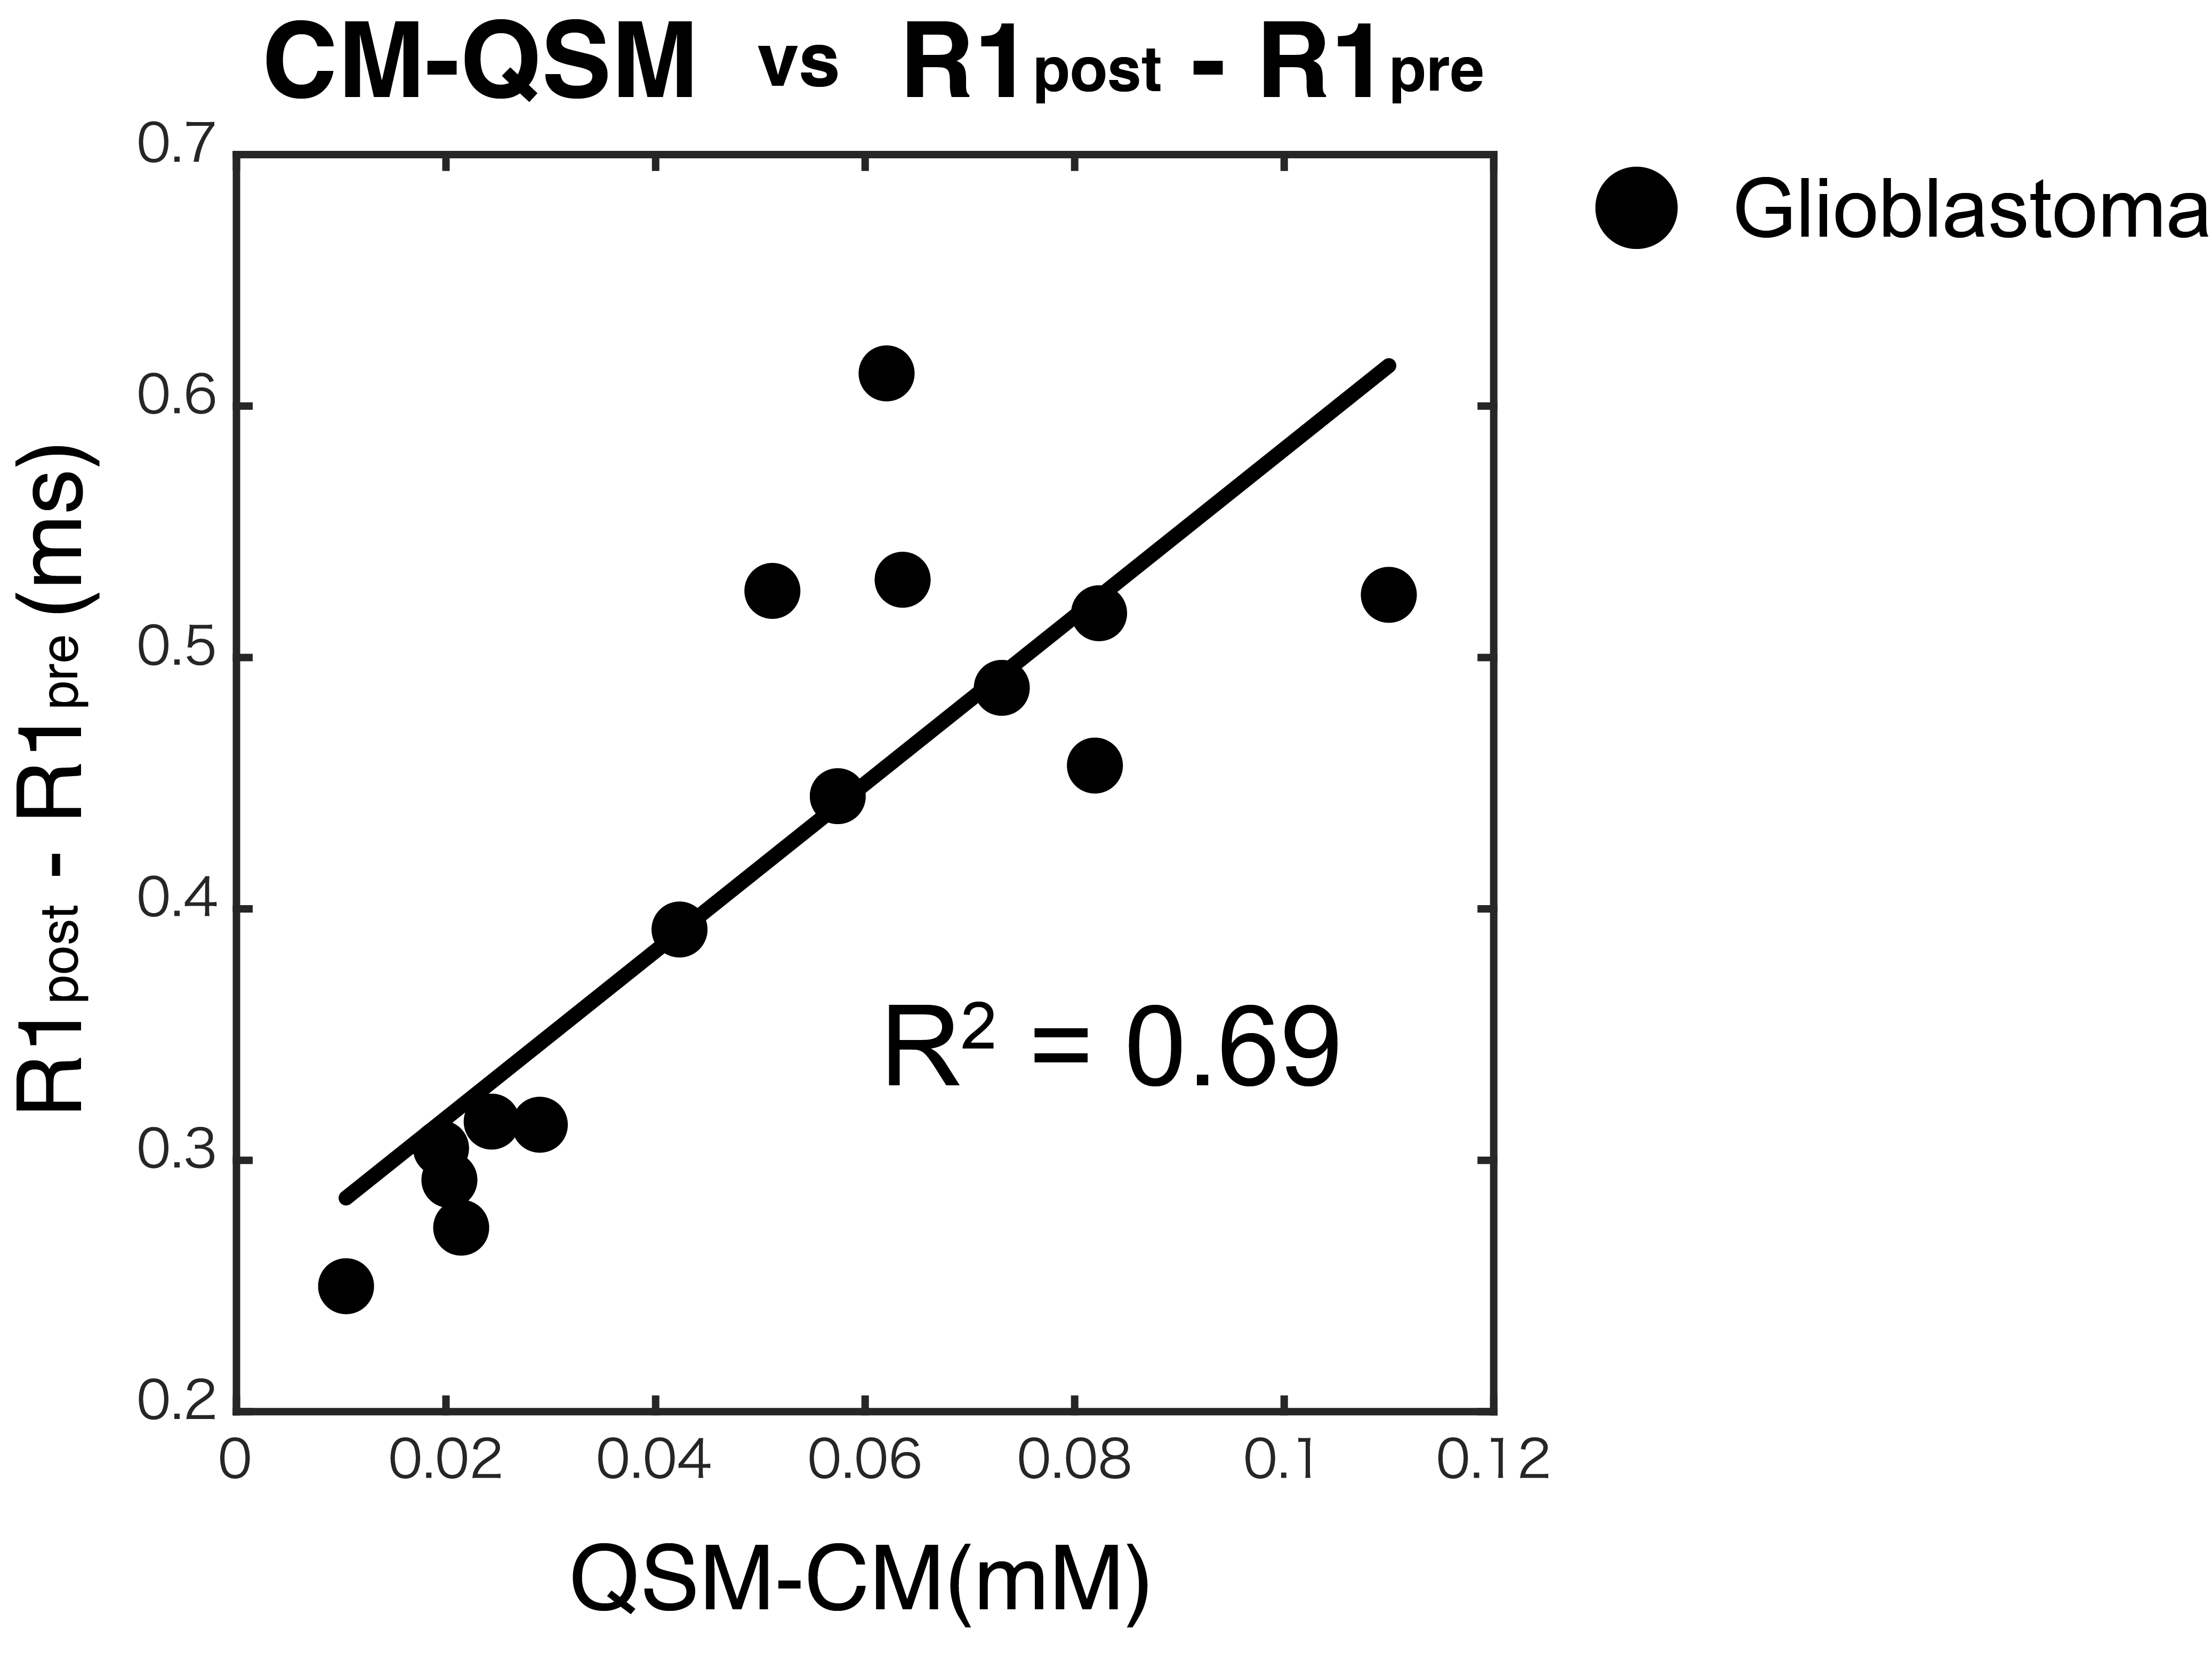
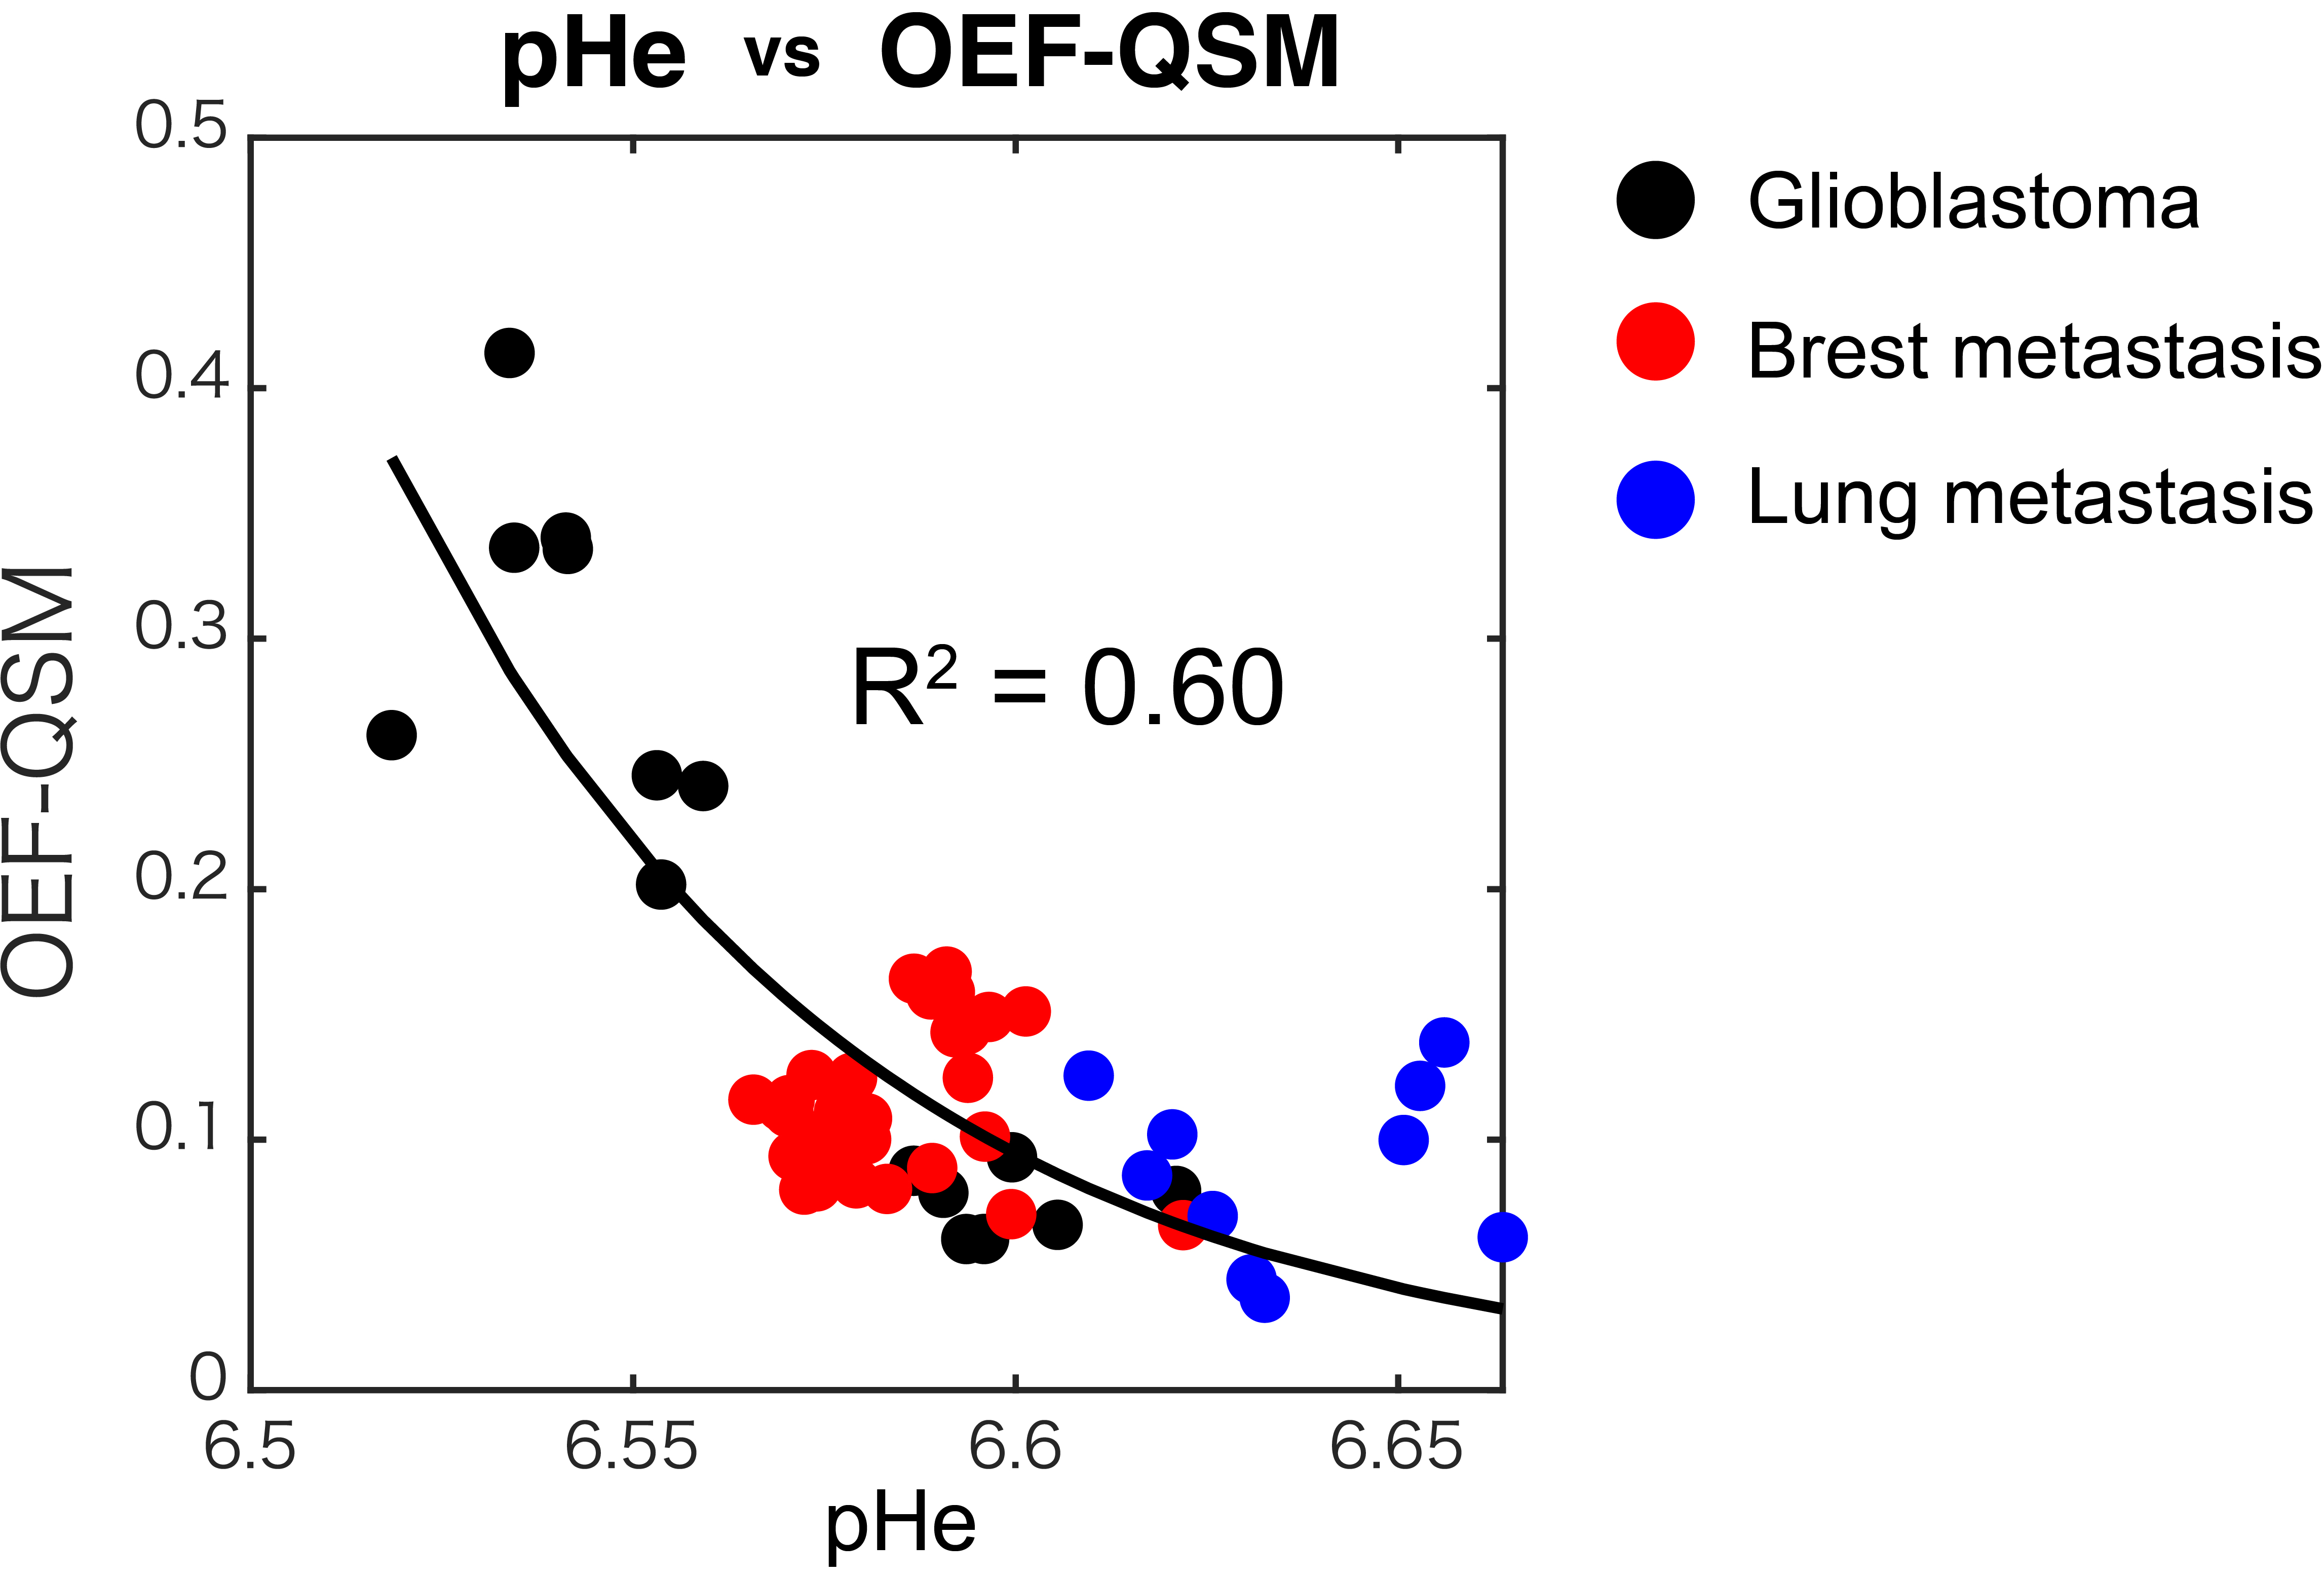
The comparison between CM-QSM and R1sub maps of brain metastasis with radiotherapy is shown, demonstrating a strong correlation (see Fig.2; R2 = 0.69). The pHe value on glioblastoma or brain metastasis region was significantly lower than radiation necrosis (see Fig.3; P < 0.001). The OEF value on glioblastoma region was significantly lower than that of radiation necrosis and lung metastasis (P < 0.001), while there was no significant difference amongst glioblastoma, breast metastasis, and lung metastasis (P > 0.05). These results may indicate that our developed method is sufficient in detecting characterization of the tumor environment. In this study, the pHe was obtained by the non-linear regression of $$$pHe = 6.57-log_{10}\left[\frac{r1-4.48}{5.20-r1}\right]^{1.03}$$$ and it depended on tumor malignancy (Fig.3). This finding is consistent with other reports of a variety of pH values depending on the malignancy [5]. Additionally, the relationship between pHe and OEF exhibited non-linear correlation (R2=0.60) (Fig.4). pHe depended on OEF and this means that these maps can quantitatively measure changes in tissue environment of diseases.Conclusion
The developed method is advantageous because the conventional weighted images that are used in the diagnosis of brain tumor can be obtained (see Fig.5).In conclusion, QPM both before and after injection can quantitatively measure changes in the tissue environment of diseases and this method might therefore have an impact on the evaluation of a brain tumor.
Acknowledgements
No acknowledgement found.References
[1] Taniguchi Y, et al. Proceedings of ISMRM. 2018; 5630.
[2] Sato R, et al. Magn Reson Med Sci, 2017.
[3] Cho J, et al. Magn Reson Med. Oct;80(4):1595-1604, 2018
[4] Uwano I, et al. Stroke Aug;48(8):2136-2141, 2017
[5] Gary V, et al. NMR Biomed. Dec; 24(10): 1380–1391, 2011
Figures