0550
A real-time quantitative method of Gd-DTPA concentration in neuroimaging using T1 3D MP-RAGE sequence at 3.0T1Institute of Medical Technology(IMT), Peking University Health Science Center(PKUHSC), Beijing, China, 2Department of Radiology, Peking University Third Hospital, Beijing, China, 3Key Laboratory of Magnetic Resonance Imaging Equipment and Technique, Beijing, China
Synopsis
We proposed a simple quantitative method based on the linear relationship between MR signal enhancement and Gd-DTPA concentration (C) by using T1 3D MP-RAGE for the real-time in vivo measurement of Gd-DTPA concentration in neuroimaging at 3.0 T. A good linear relationship between ΔSI and Gd-DTPA concentration existed over the concentration range of 0–1 mM (R2=0.985). Further, six human subjects with different brain tumors were enrolled for in vivo application of the novel method. All the results revealed that the quantitative method presented by our study is accurate, real-time and applicable.
Purpose
To propose a simple and real-time quantitative method based on the linear relationship between magnetic resonance (MR) signalenhancement (ΔSI=SIpostcontrast−SIprecontrast) and gadolinium-diethylenetriamine pentaacetic acid (Gd-DTPA) concentration (C) by using T1-weighted three-dimensional magnetization-prepared rapid acquisition gradient-echo (T1 3D MP-RAGE) sequence for the in vivo measurement of Gd-DTPA concentration in real-time neuroimaging at 3.0 T.Material and methods
Phantom experiment was carried out to study the linear fitting of signal intensity change vs. Gd-DTPA concentration (ΔSI–C)curve. A goodness-of-fit test was performed to compare the accuracy between the proposed method and the conventional method based on longitudinal relaxation rate (R1=1/T1) measurement. The influences on the goodness of fit (R2) and the signal-to-noise ratio (SNR) by sequence parameters were explored. Six human subjects with different brain tumors, who underwent a Gd-DTPA-enhanced MRI, were enrolled for in vivo application of the novel method.Results
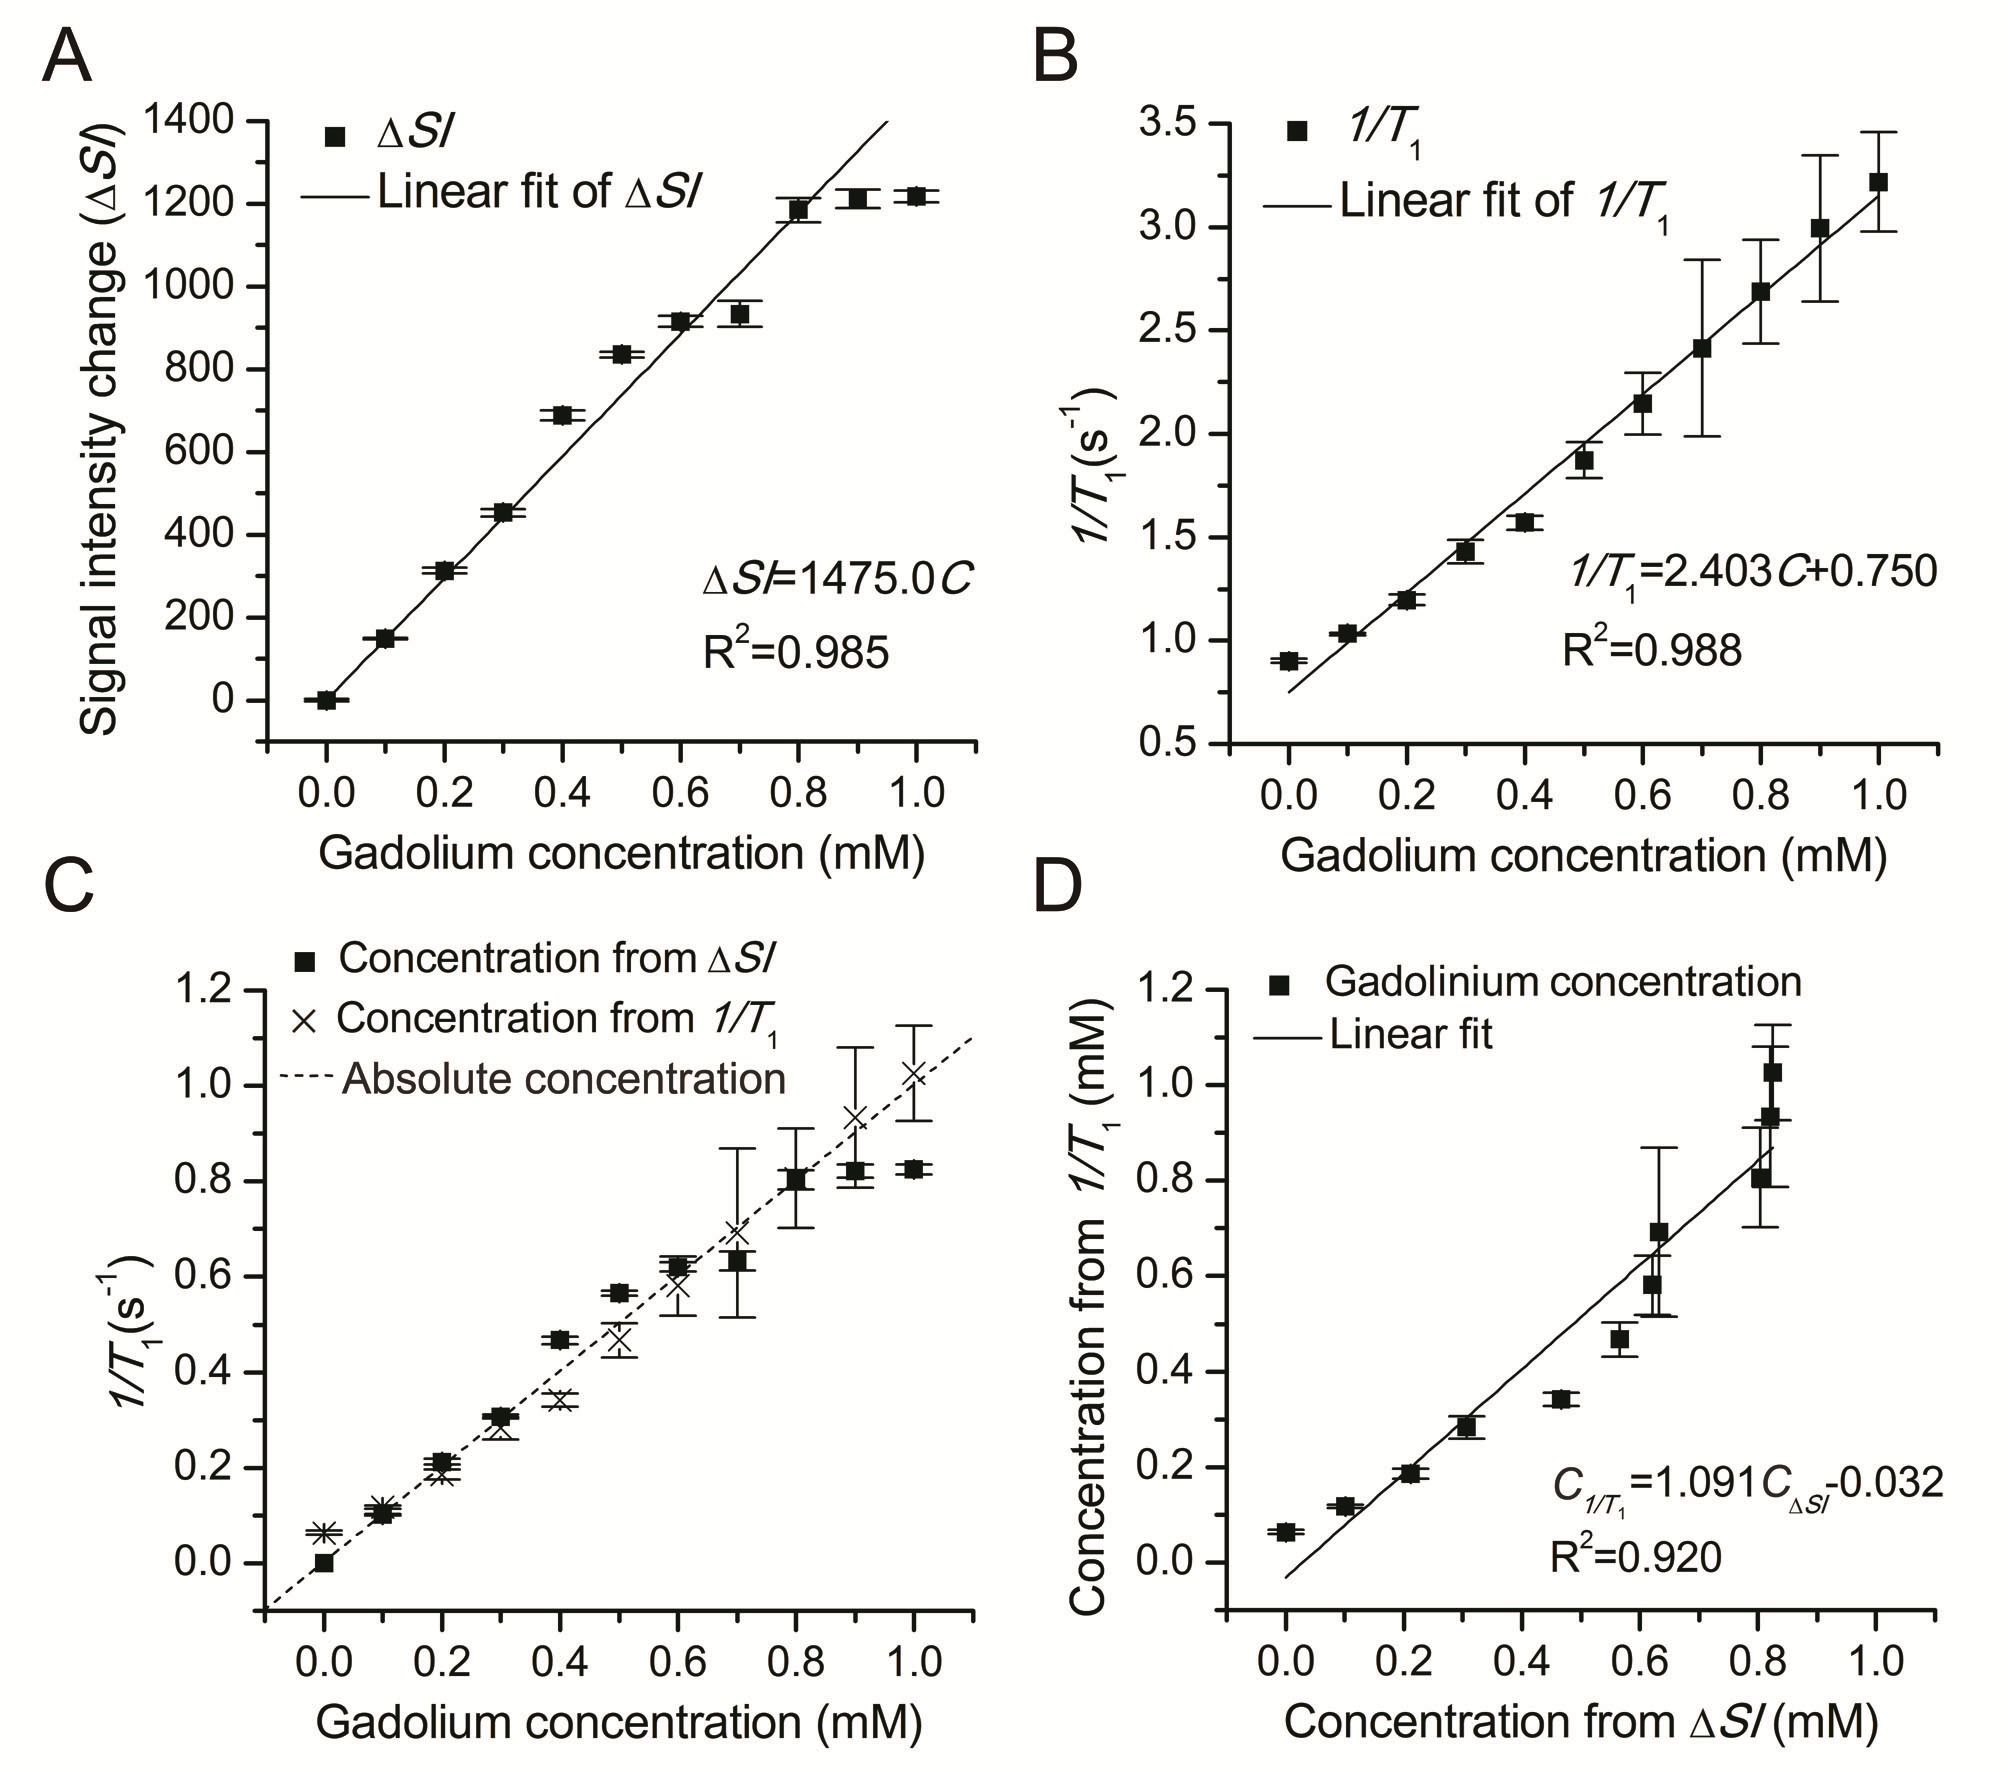
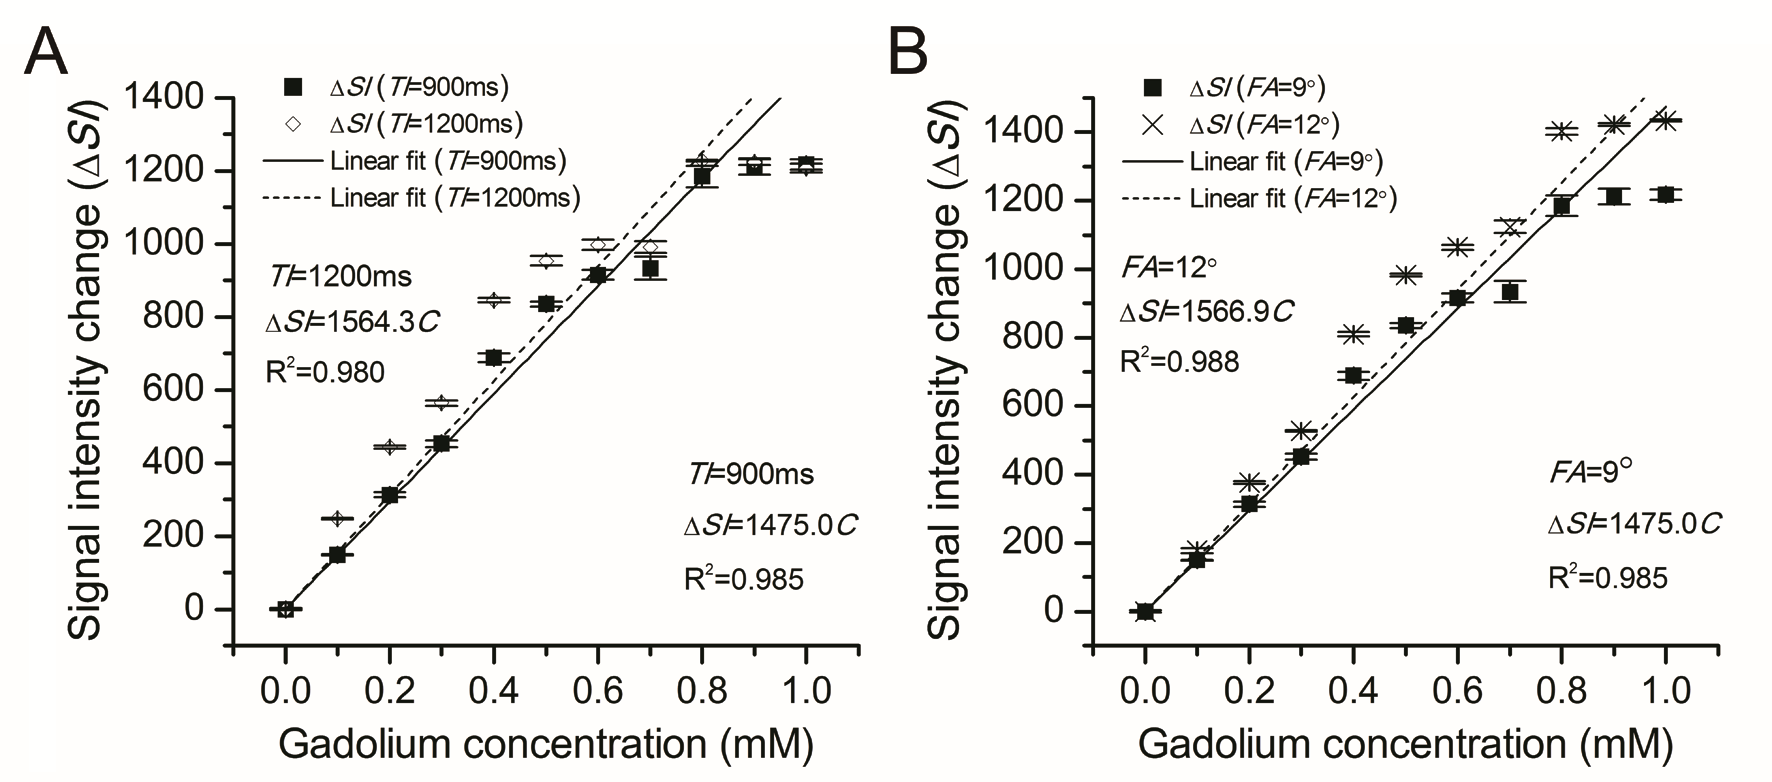
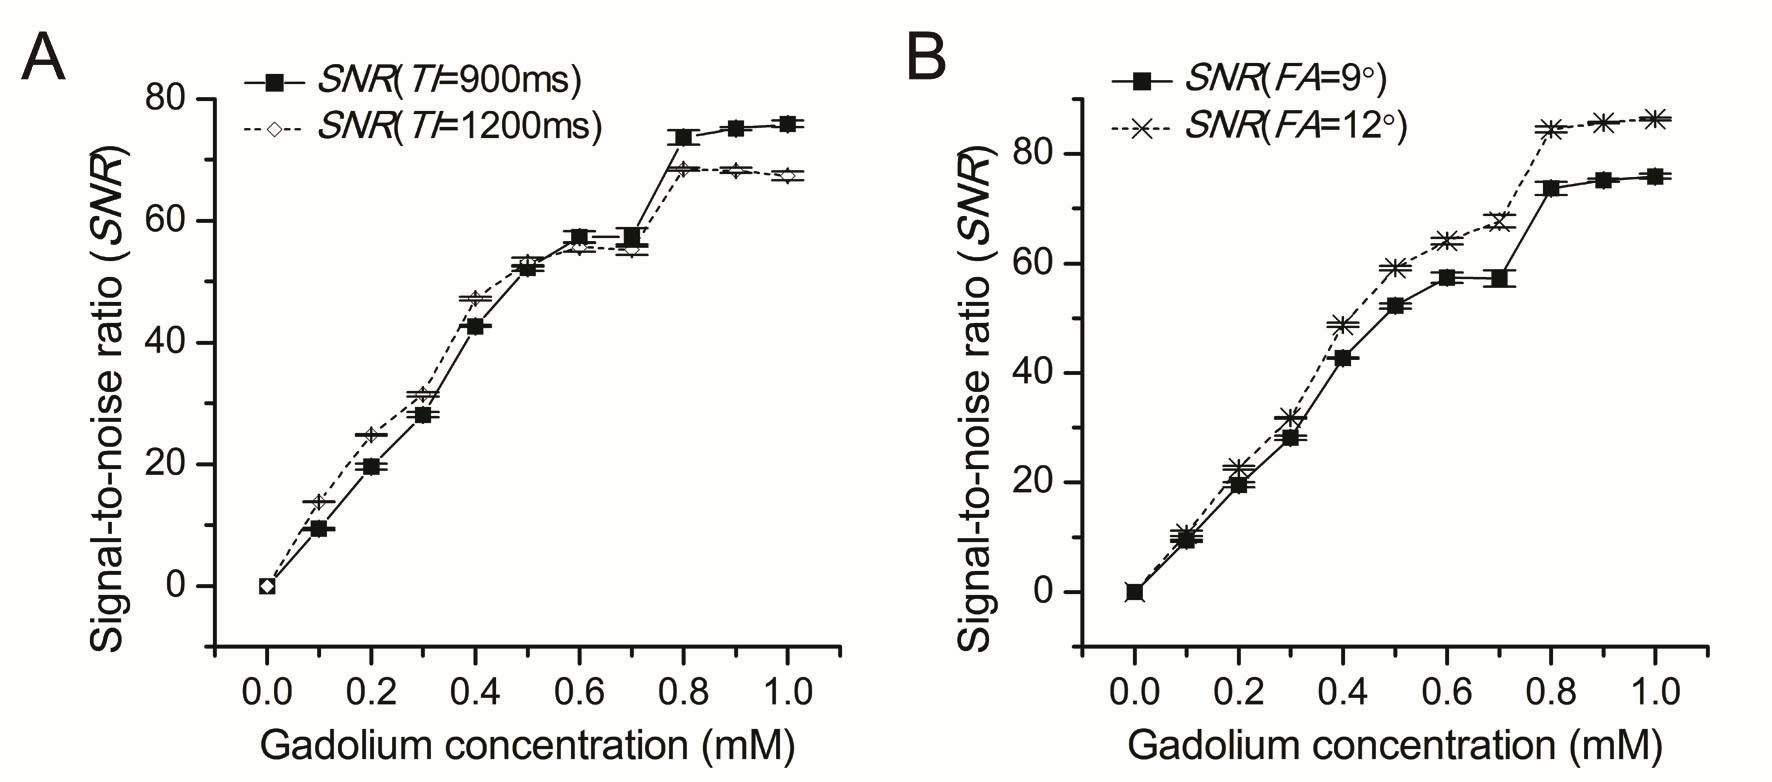
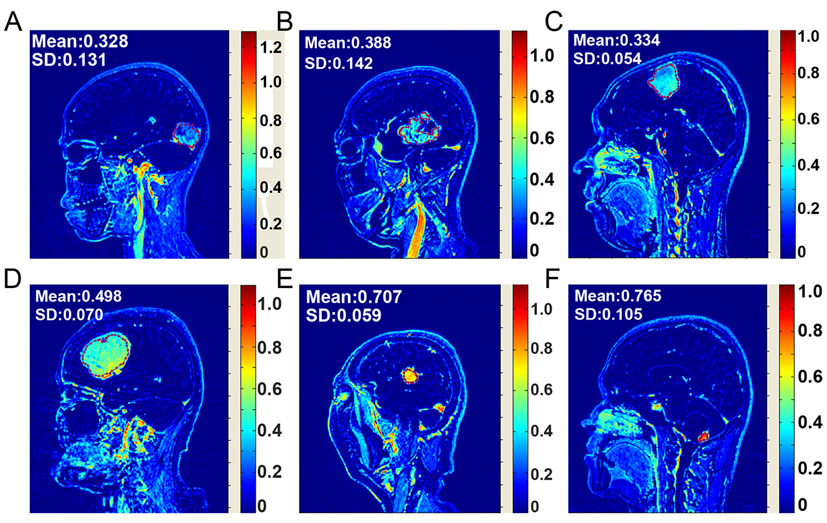
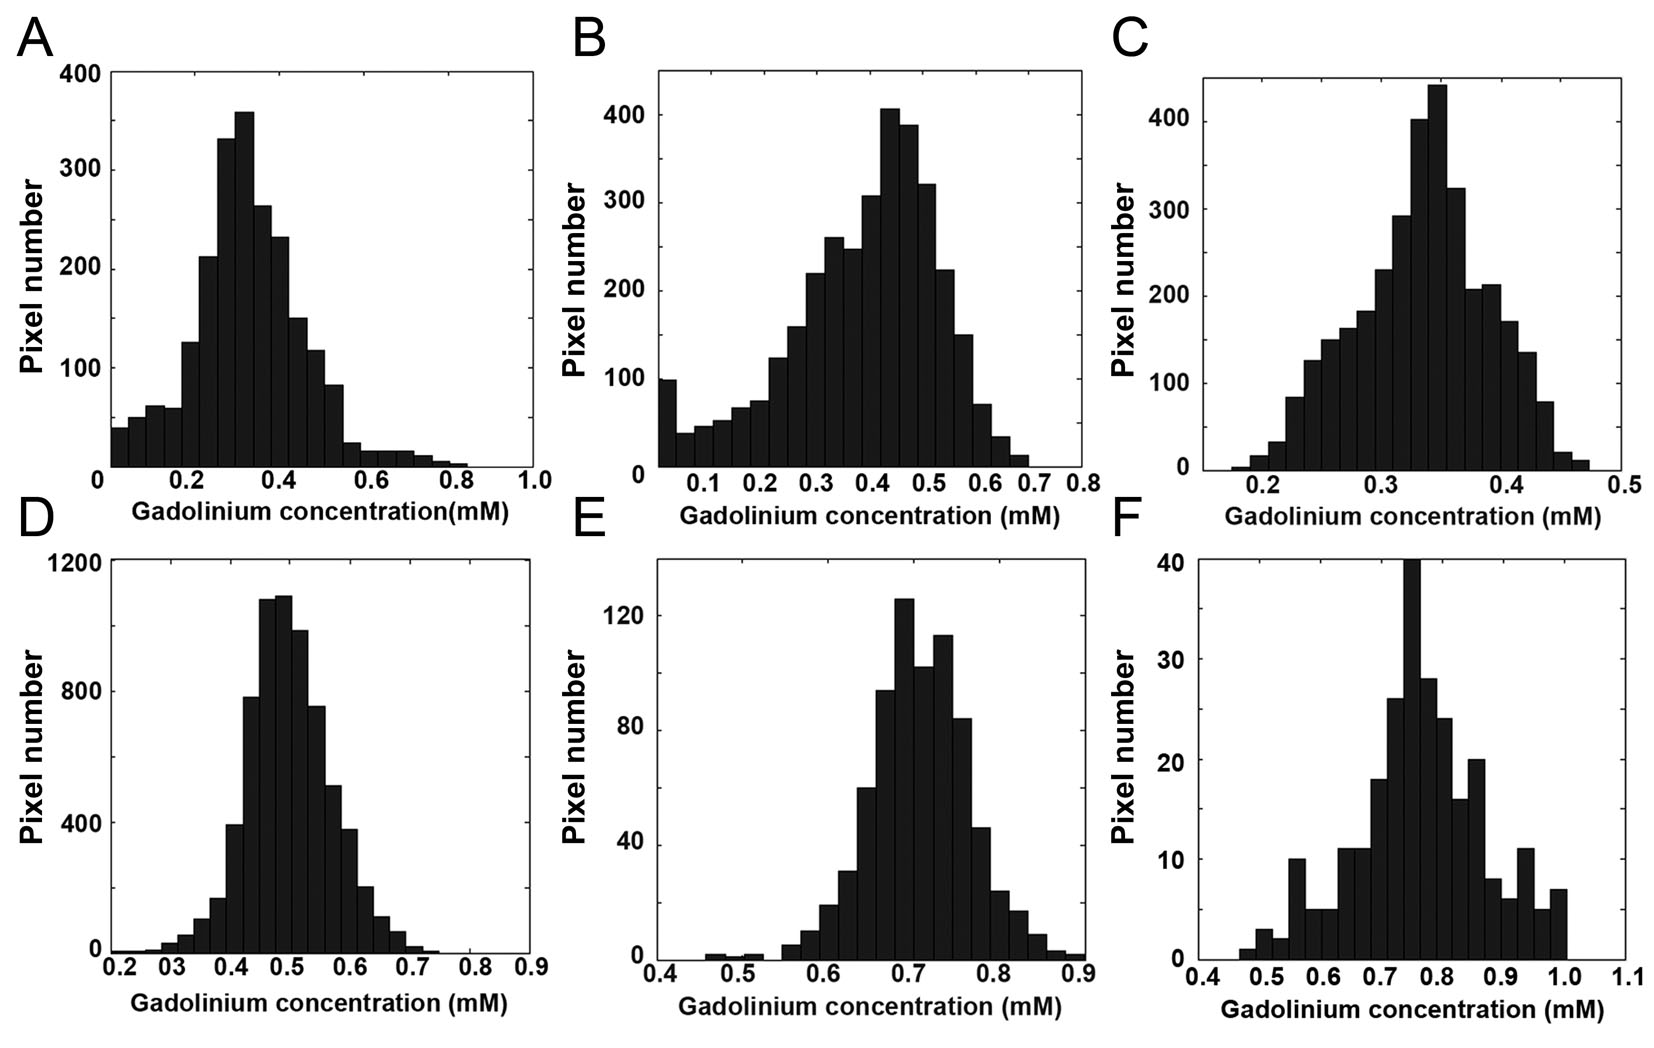
A good linear relationship between ΔSI and Gd-DTPA concentration existed over the concentration range of 0–1 mM (R2=0.985).The linearity of the ΔSI–C curve was as good as that of the 1/T1–C curve (R2=0.988). Concentrations calculated by both methods had a strong correlation (R2=0.920). An improved linearity of the ΔSI–C curve and an increased SNR can be achieved using sequences with a shorter inversion time (TI) and a higher flip angle. The concentration range of Gd-DTPA in human brain tumors was within the quantitativescope of 0–1 mM.Discussion
The feature of MP RAGE sequence is, by employing a separate MP period, better tissue contrast properties can be obtained in a much shorter imaging time when compared to other GRE sequences. The method presented by our study is real-time compared to the conventional quantitative method of 1/T1. The experimental data of our novel quantitative method agreed well with the theoreticalconclusion of mathematical deduction. It was revealed that the linearity of the ΔSI–C curve was improved by sequences with a shorter TI (900 ms) and a higher flip angle (12°). From this point, factors that can promote the percentage of T1 weight make better use of the novel method. Despite the method based on ΔSI measurements having a limitation at high concentrations beyond 1 mM, the quantitative scope is acceptable for in vivo measurement of brain tumors, where the amount of the Gd-DTPA is not that large. In our study, there was no pixel where the concentration was beyond 1mM even in the hemangioblastoma. In order to make the method sufficient for reliable pharmacokinetic modeling, in vivo modulation of drug delivery would be done in the future, for example, by reducing the initial dose of Gd-DTPA to limit the concentration of the vascular input over the linear range.Conclusion
The proposed quantitative method based on ΔSI measurement is real-time, accurate and applicable for real-time neuroimaging at 3.0 T. More applications of this method and its promotion are yet to be explored.Acknowledgements
No acknowledgement found.References
[1] De Vita E , Ridgway G R , White M J , et al. Neuroanatomical correlates of prion disease progression - a 3T longitudinal voxel-based morphometry study[J]. NeuroImage: Clinical, 2017, 13:89-96.
[2] Zhang D, Feng XY, Henning TD, Wen L, Lu WY, Pan H, et al. MRimaging of tumor angiogenesis using sterically stabilized Gd-DTPAliposomes targeted to CD105. Eur J Radiol 2009;70(70):180–9.
[3] Fritz-Hansen T, Rostrup E, Larsson HB, Sondergaard L, Ring P,Henriksen O. Measurement of the arterial concentration of Gd-DTPAusing MRI: a step toward quantitative perfusion imaging. Magn ResonMed 1996;36(2):225–31.
[4] Bokacheva L, Rusinek H, Chen Q, Oesingmann N, Prince C, Kaur M,et al. Quantitative determination of Gd-DTPA concentration in T1-weighted MR renography studies. Magn Reson Med 2007;57(6):1012–8.
[5] Deichmann R, Good CD, Josephs O, Ashburner J, Turner R.Optimization of 3-D MP-RAGE sequences for structural brainimaging. NeuroImage 2000;12(1):112–27.
Figures