0547
Improved Volumetric Myelin Imaging in Human Brain Utilizing Inversion Recovery Prepared Ultrashort Echo Time with Complex Echo Subtraction1University of California, San Diego, San Diego, CA, United States, 2VA San Diego Healthcare System, San Diego, CA, United States
Synopsis
Myelin accelerates neural signaling in the central and peripheral nervous systems. Ultrashort echo time (UTE)-based imaging techniques have been proposed for direct capture of magnetic resonance (MR) signal from myelin lipid protons with extremely short T2* (~0.3 ms). To suppress signal from long T2 water components and thereby improve myelin imaging, inversion recovery (IR)-based UTE techniques have been proposed. In this study, we explored the efficacy and feasibility of qualitative myelin imaging in vivo combining dual-echo IR-UTE with complex echo subtraction.
Introduction
Myelin accelerates transfer of neural signal in the central and peripheral nervous systems. Recently, ultrashort echo time (UTE)-based imaging techniques have been proposed for direct capture of the magnetic resonance (MR) signal from myelin lipid protons with extremely short T2* (~0.3 ms)1,2. To suppress signal from long T2 water components and thereby improve the dynamic range of myelin imaging, inversion recovery (IR)-based UTE imaging techniques have been proposed3–7. In this study, we explored the efficacy and feasibility of qualitative myelin imaging in vivo combining dual-echo IR-UTE with the complex echo subtraction technique.Methods
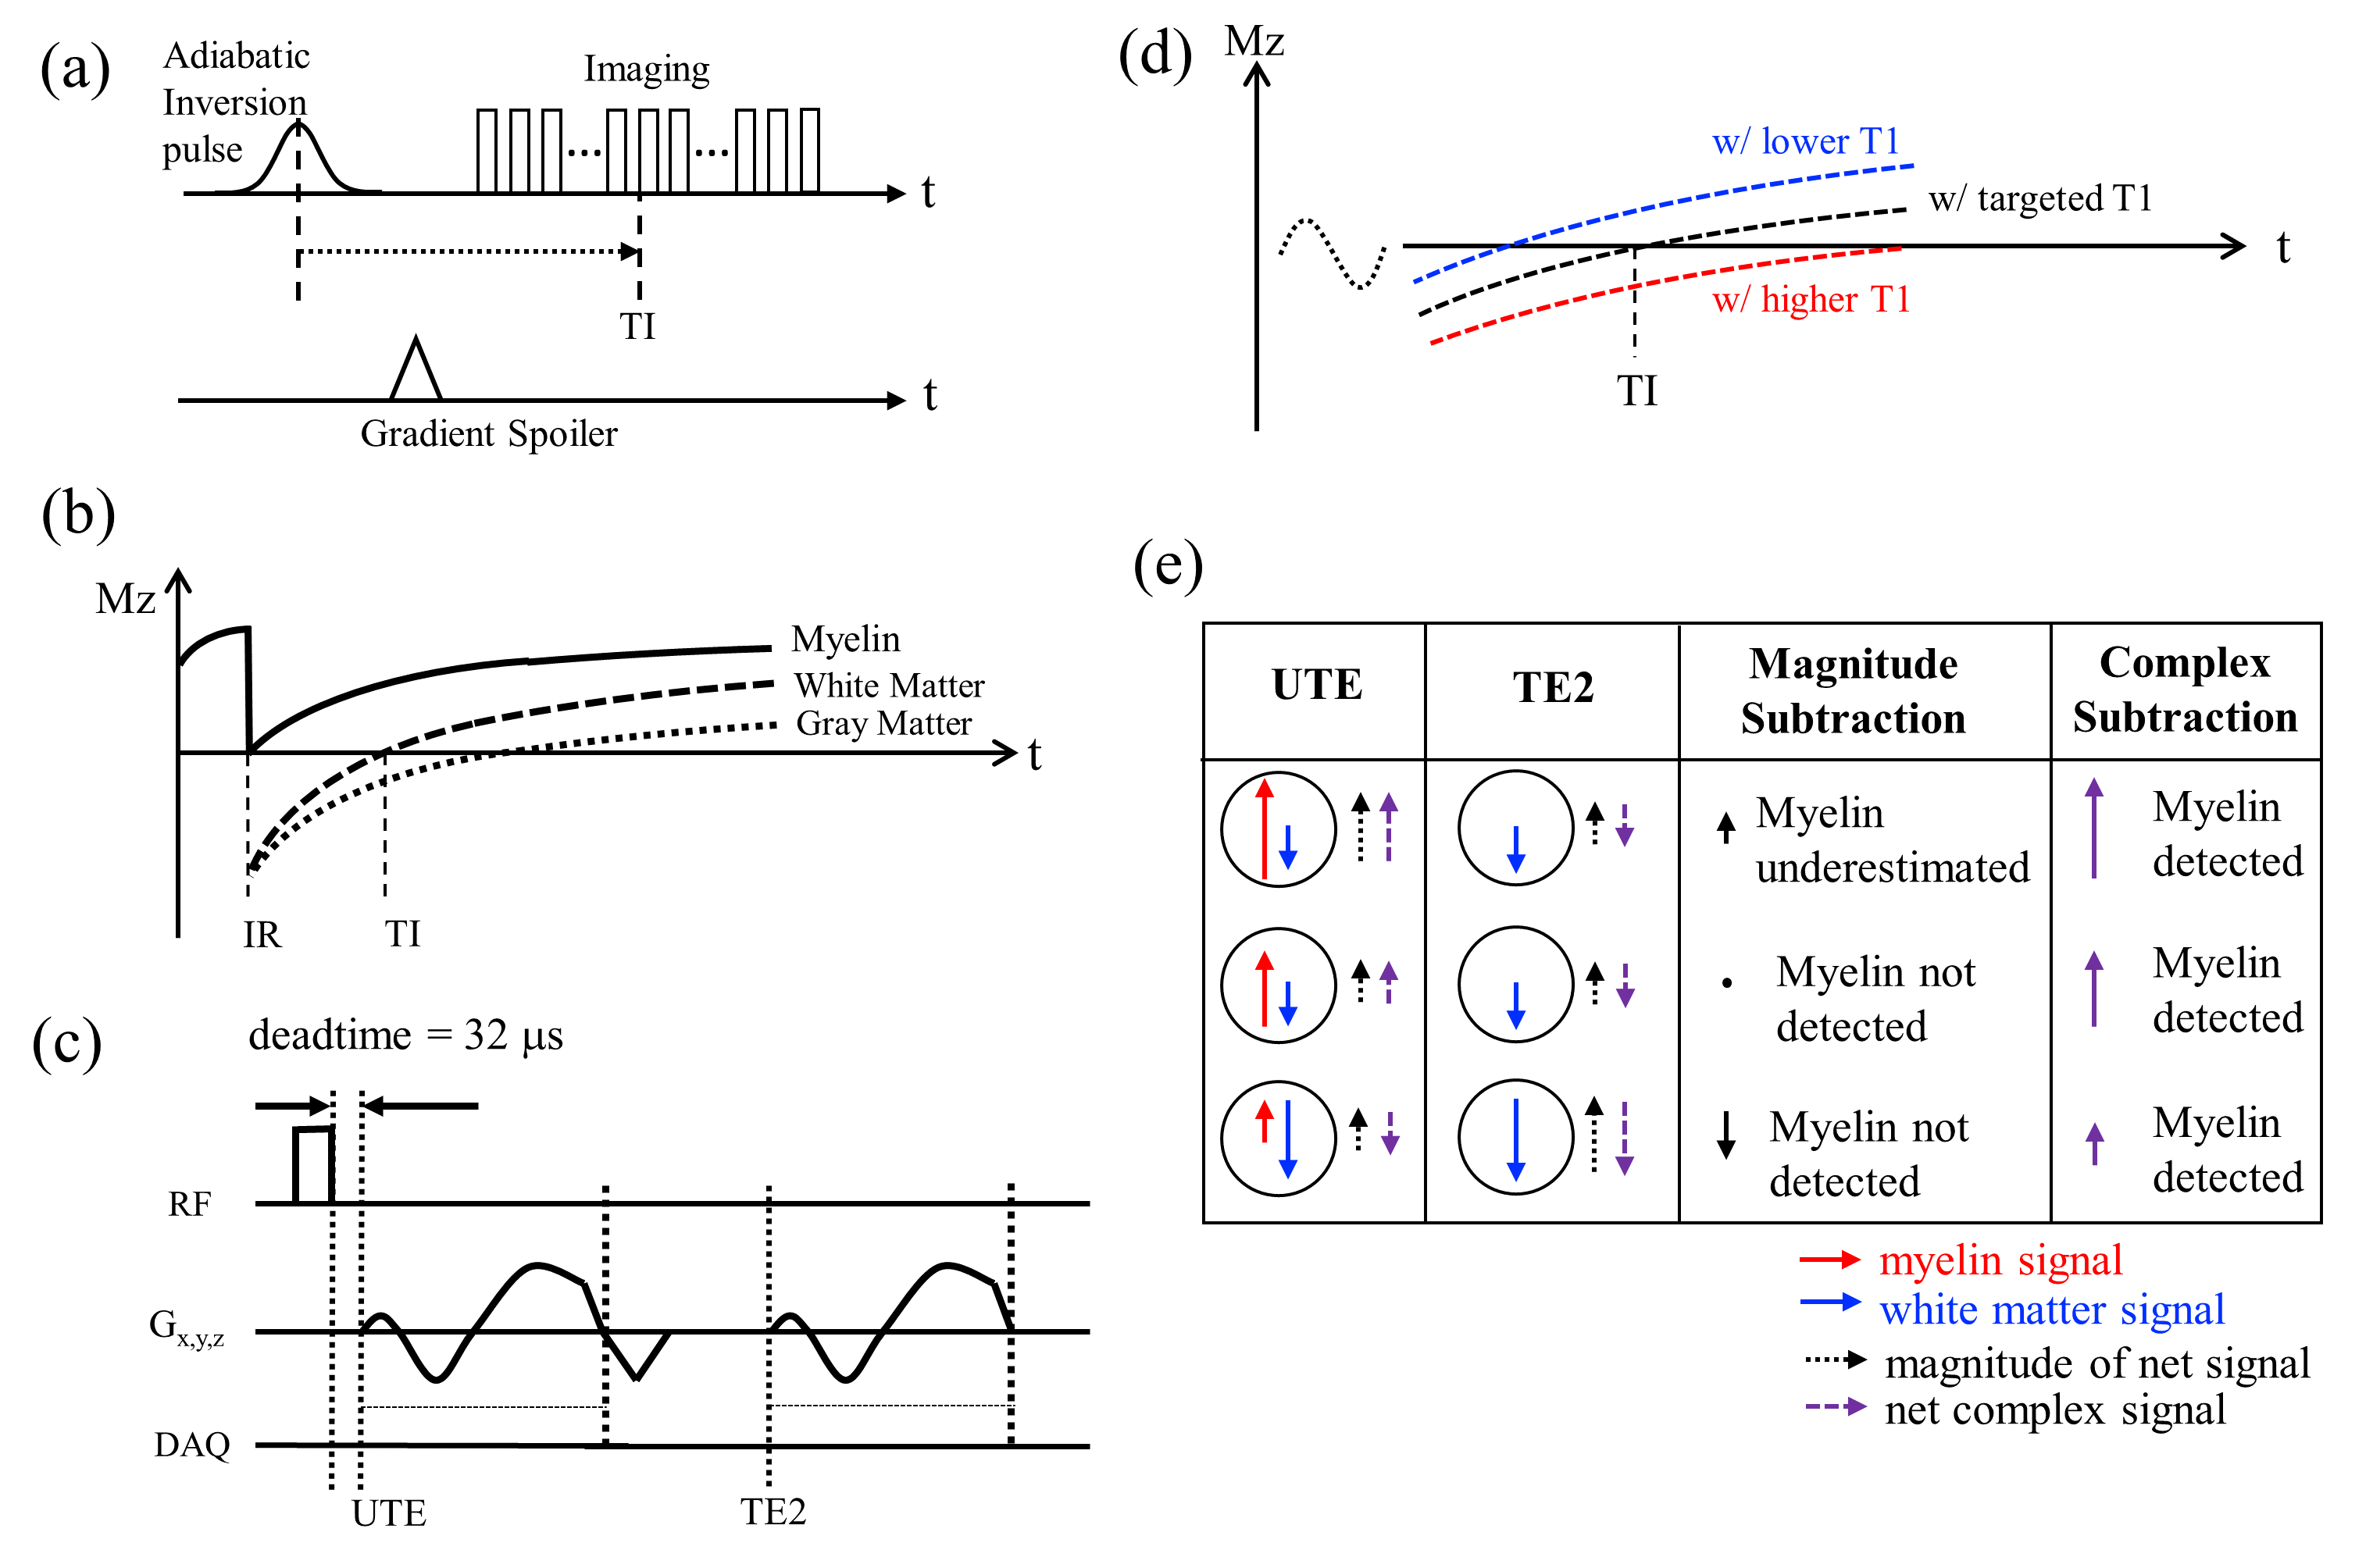
Figure 1-a illustrates the IR-UTE-Cones sequence, where an adiabatic IR pulse inverts the longitudinal magnetization (Mz) of long T2 water components8. Figure 1-b shows typical IR of long T2 white matter (WML), gray matter (GM), and myelin. The myelin magnetization is not inverted, but partially saturated, by the long adiabatic inversion pulse, showing positive Mz following the pulse9. The TI is adjusted to the nulling point of WML. At that point, two images at UTE and TE2 are acquired by dual echo UTE imaging (Figure 1-c), where the subsequent echo subtraction reveals myelin signal with short T2*. Unfortunately, it is difficult to completely suppress all WML signals at the TI due to inhomogeneous T1 (Figure 1-d). Consequently, residual WML signal with negative Mz can lead to error in myelin detection with magnitude subtraction (Figure 1-e) due to the opposite initial phases of transverse magnetizations in the residual WML. Conversely, complex subtraction can resolve the myelin signal regardless of the initial phase of residual WML by correcting for the phase error due to RF pulse, readout10, and B0 inhomogeneity11. After phase correction, the complex signal at UTE is subtracted by the signal at TE2, and the remaining real component is myelin signal.To evaluate the proposed method, 3D IR-UTE-Cones imaging was performed on 3T GE-MR750. Five healthy volunteers (41.4±10.3 years) and five multiple sclerosis (MS) patients (59.4±7.7 years) were recruited per IRB guidelines. Subjects underwent MP-RAGE, FLAIR, and IR-UTE-Cones imaging. A dual echo UTE-Cones acquisition was also performed to acquire a B0 map. For one healthy volunteer, actual flip angle imaging based variable flip angle (AFI-VFA) UTE-Cones sequences were added to map T112. A 12-channel receive-only head coil was used for imaging with the following parameters: 1) MP-RAGE: flip angle (FA)=12°, FOV=256x256x178mm3, matrix=256x256x148, readout bandwidth (rBW)=±41.7kHz, TE=3.2ms, TR/TI=8.2/450ms, acceleration factor=4, scantime=5 min. 2) FLAIR: FA=90°, FOV=256x256x256mm3, matrix=256x256x256, rBW=±41.7kHz, TE=116.5ms, TR/TI=7600ms/2162ms, acceleration factor=4, scantime=6min 54sec. 3) IR-UTE-Cones: adiabatic inversion pulse (Silver-Hoult, duration=6.048ms and bandwidth=1.643kHz), TR=1000ms, TI=330ms, TE=0.032/2.2ms, number-of-spoke-per-IR=21, tau=7.1ms, FA=20°, bandwidth=±125kHz, FOV=220×220×151mm3, matrix=192×192×42, scantime=8min 18sec. 4) Field map acquisition: matched IR-UTE-Cones excepting TR=7.2ms, TE=0.032/2.2ms, FA=10°, scantime=1min 13sec. 5) AFI-VFA-T1 mapping: matched IR-UTE-Cones excepting FA=5/10/15/20/30°, TE=2.2ms, scantime=16min 47sec. The UTE-Cones images were reconstructed using NuFFT13. The phase offset was estimated by using the phase at UTE. B0 field map was estimated using FMRIB Software Library (v5.0)14. For AFI-VFA UTE-Cones T1 measurement in a brain, the Levenberg‐Marquardt algorithm was used to solve the non‐linear fitting for T1 measurement15.
Results
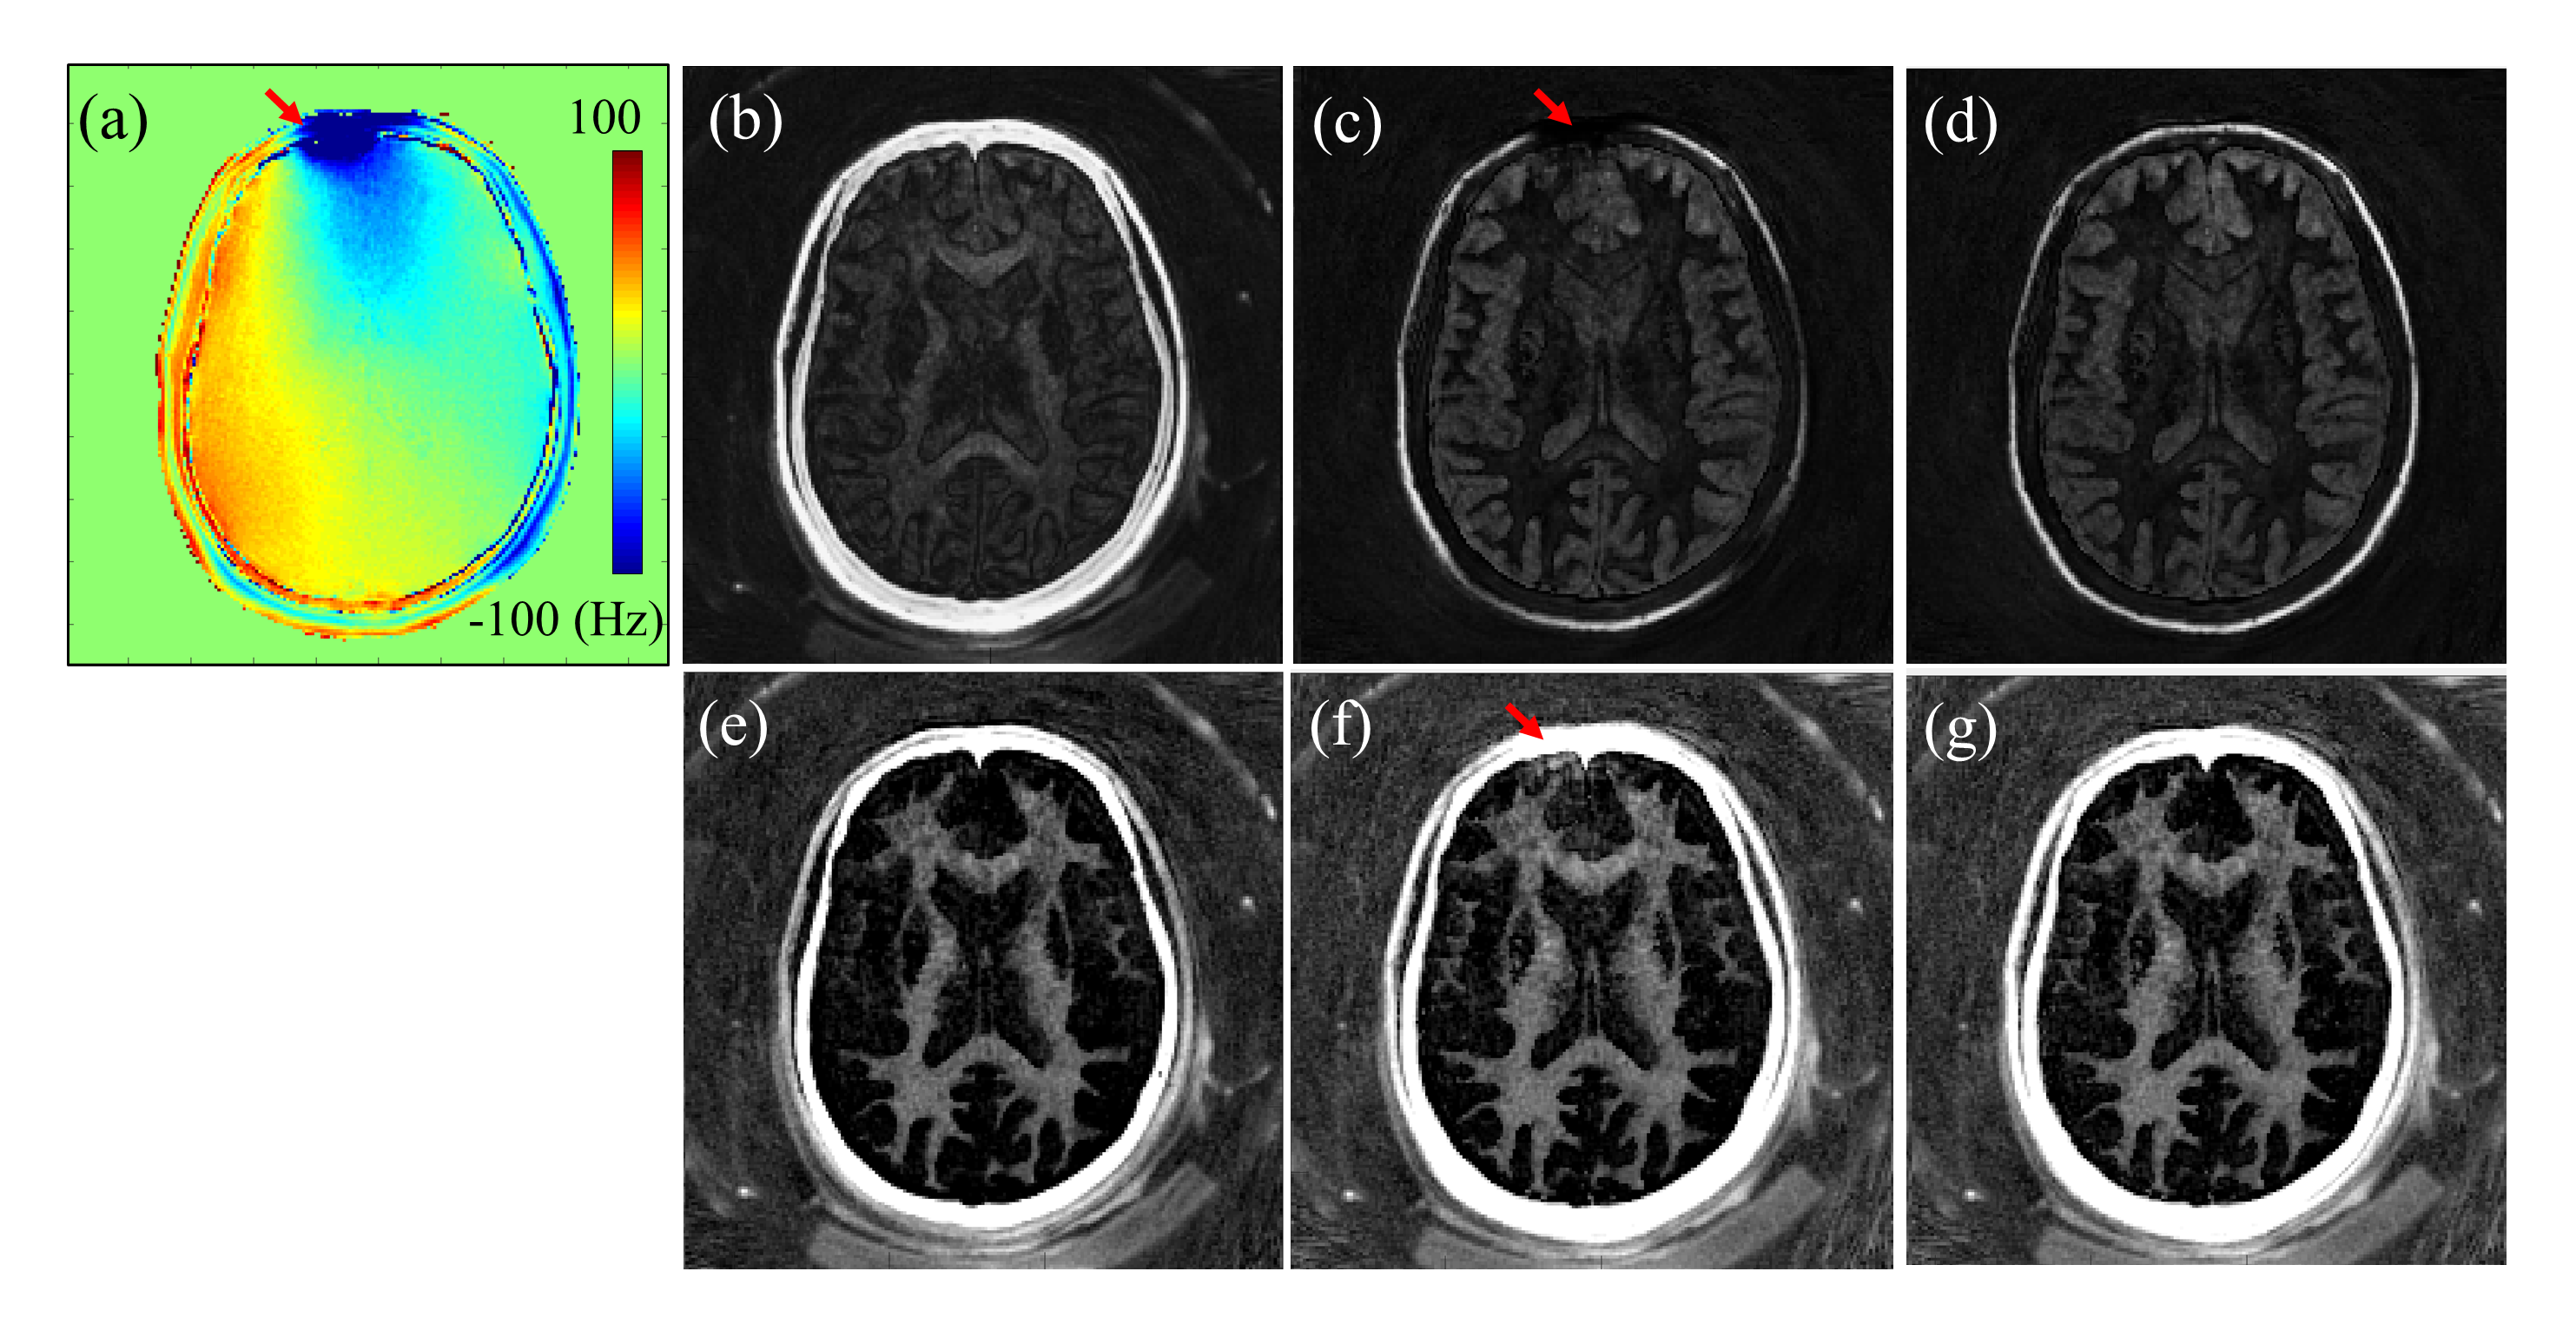
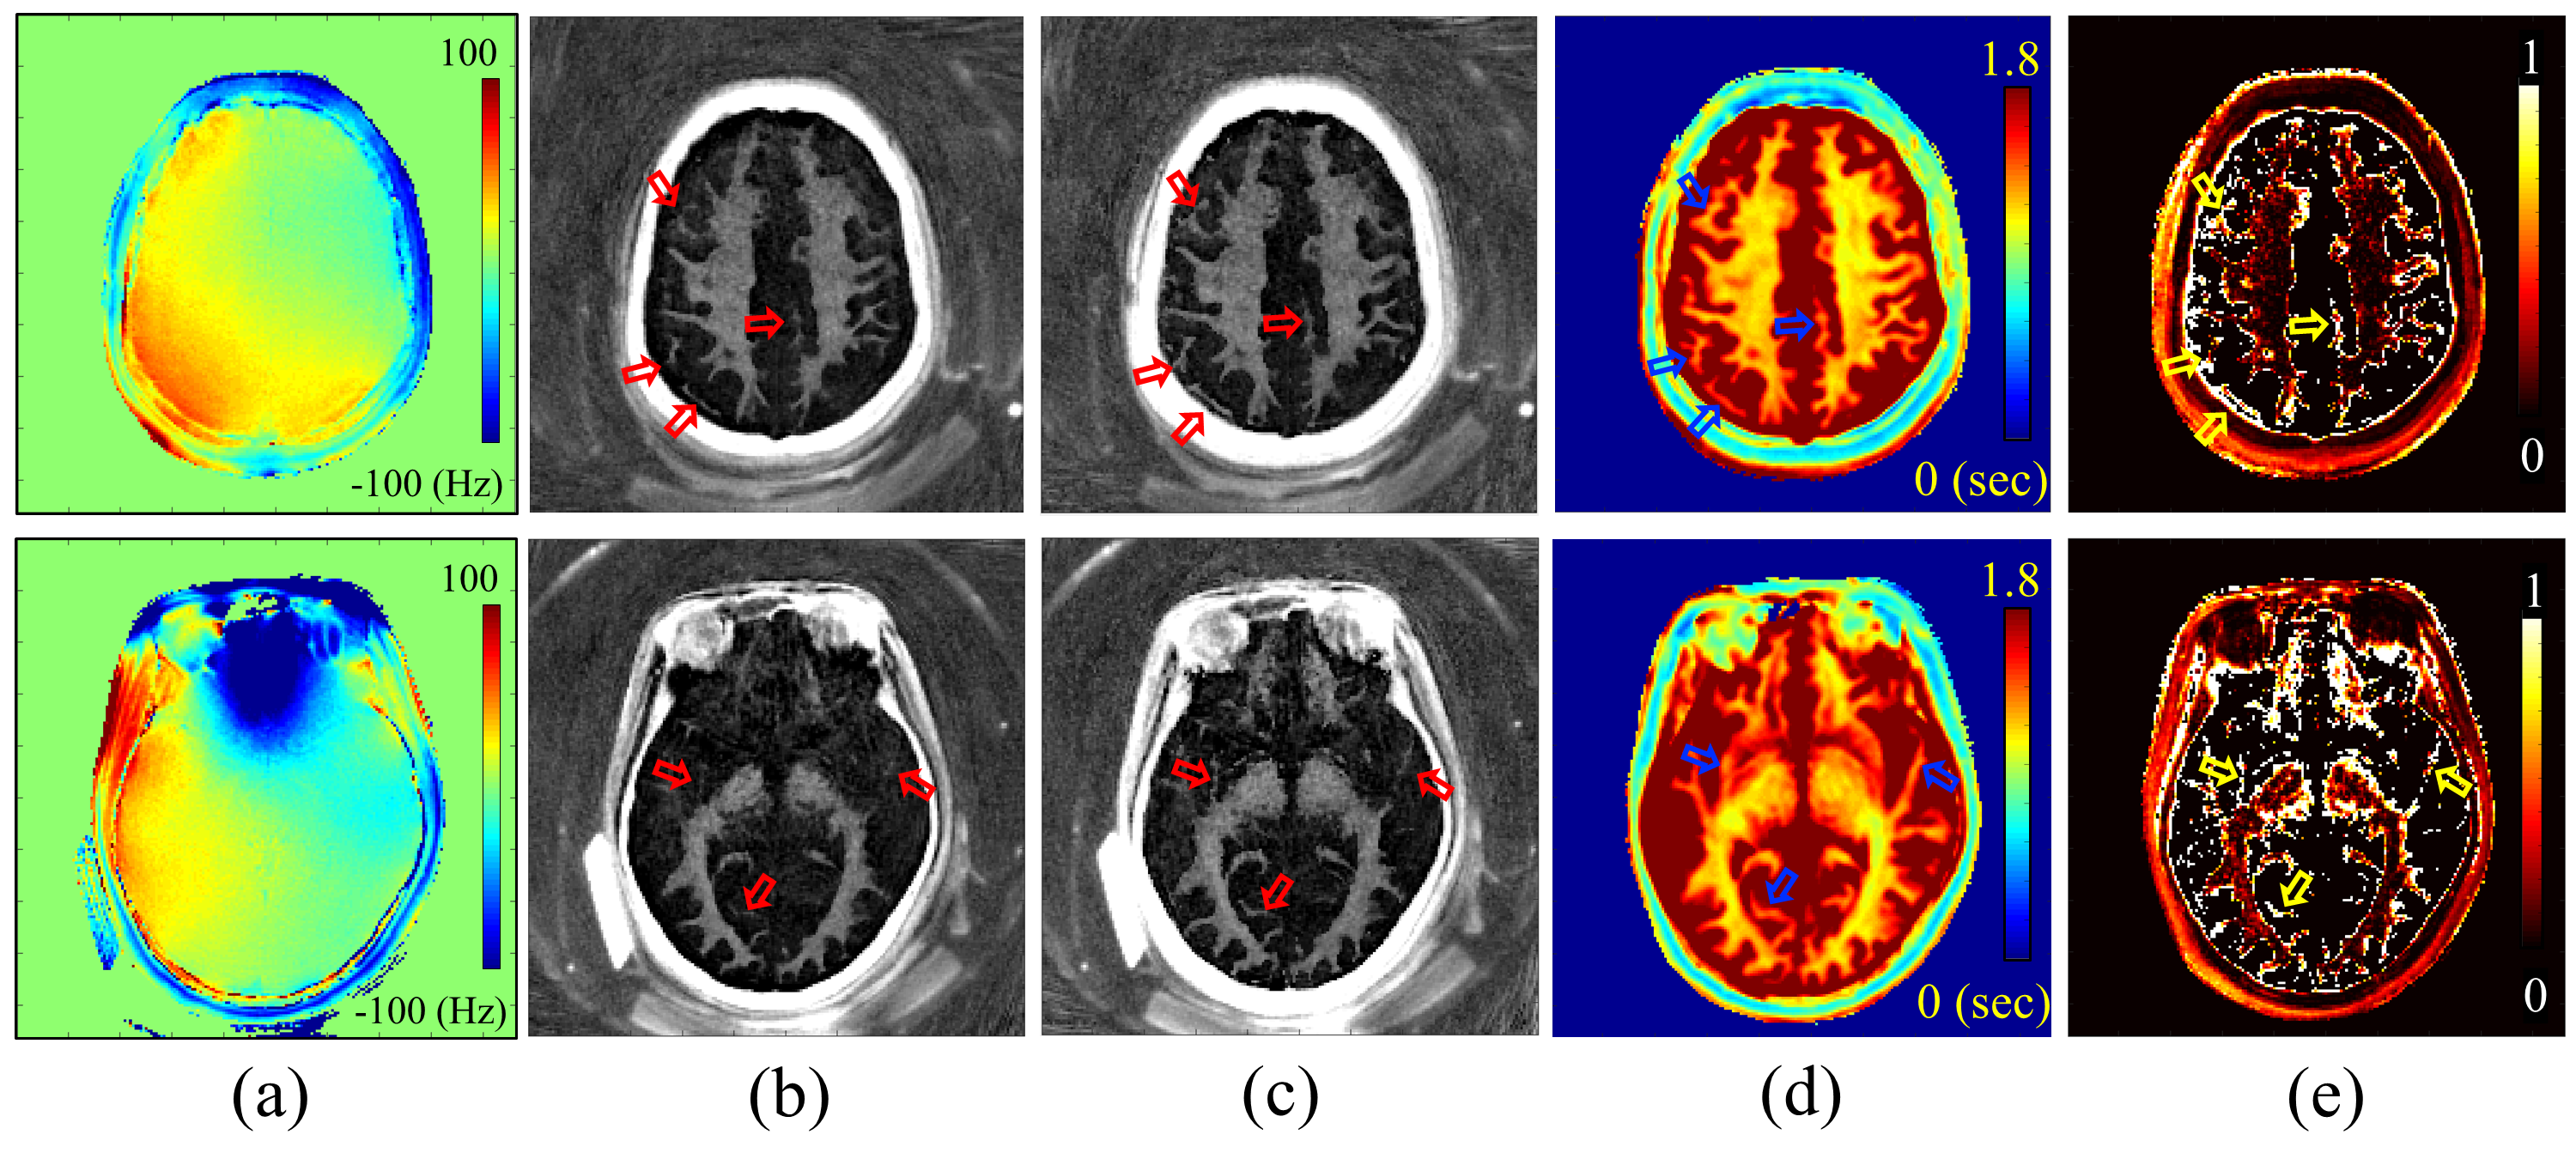
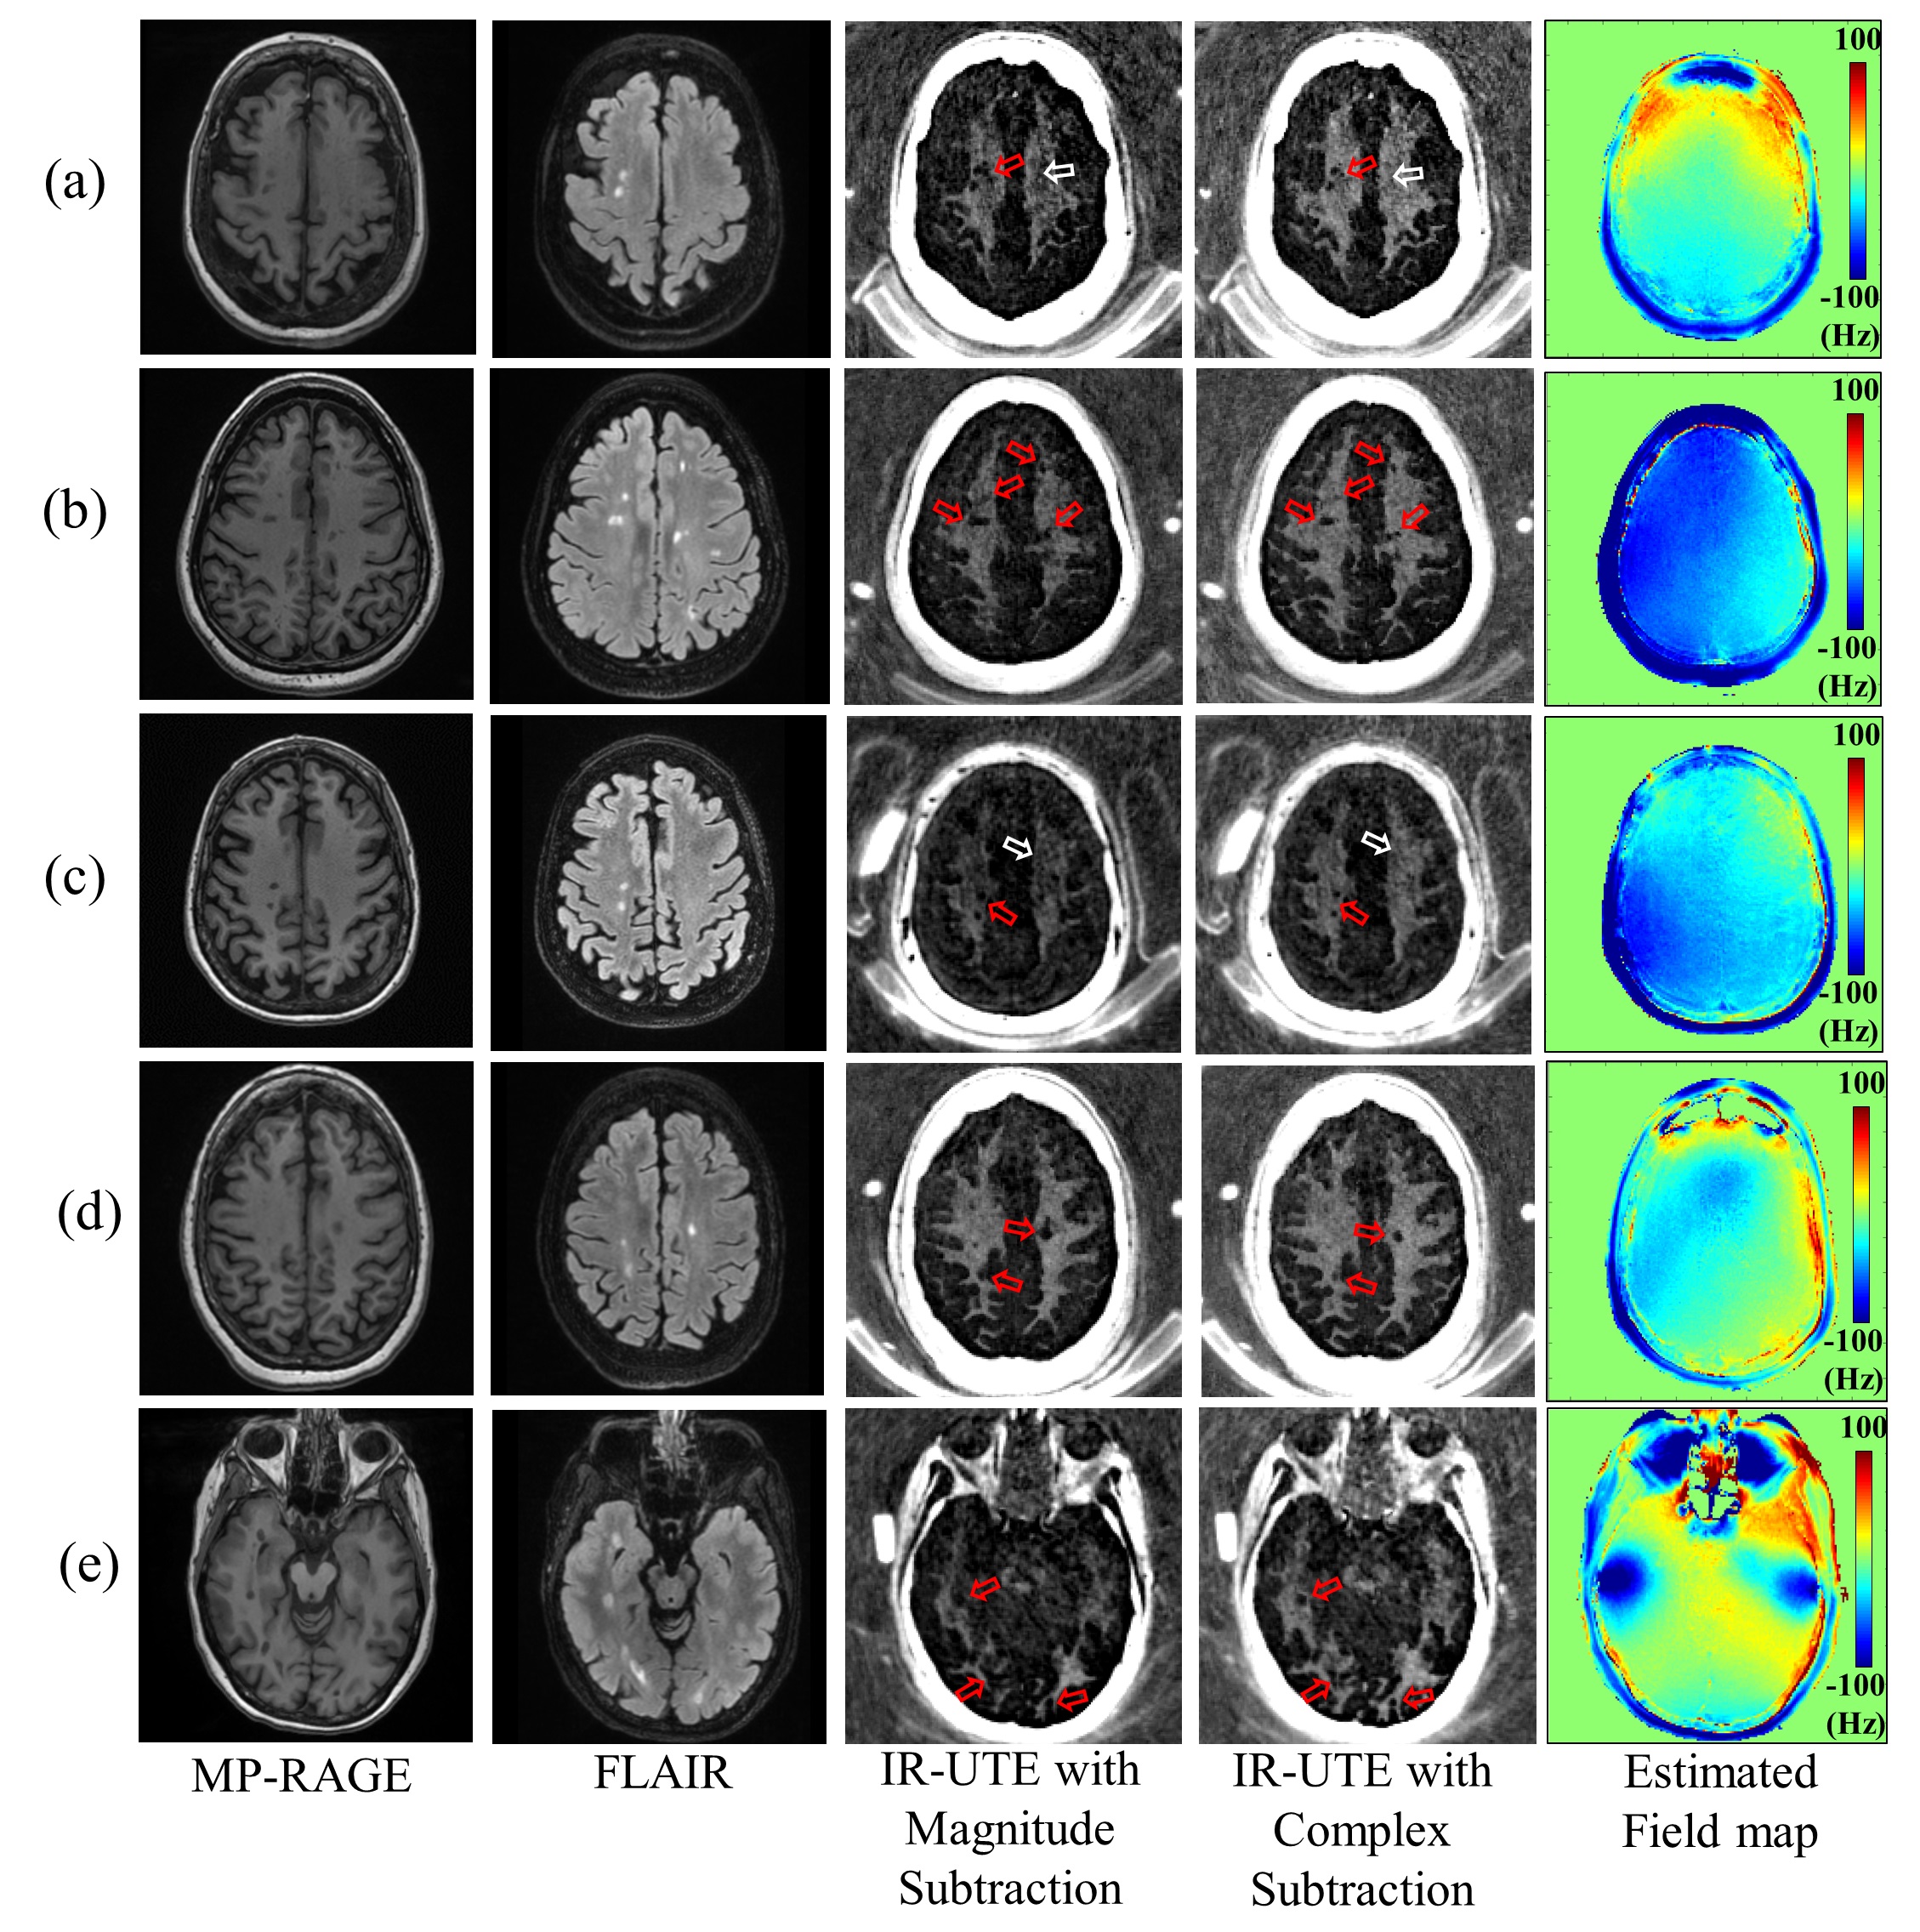
For all subjects, complex subtraction showed obvious improvement in detection of fine myelin structures. Figures 2 and 3 show results from a representative healthy volunteer. The artifact due to field inhomogeneity was suppressed by phase correction (Figure 2). Figure 3 shows that more morphological structures of myelin were detected with complex subtraction in the WM region (red arrows); the fine myelin structures detected by complex subtraction correspond to the pixels with higher T1 (blue arrows). Figure 3-e displays the normalized error map between complex and magnitude subtraction, showing increased error in the region with higher T1 (yellow arrows), implying that T1 variation is associated with underestimated/undetected myelin signal in magnitude subtraction. Figure 4 shows results from MS patients. The myelin image obtained with complex subtraction exhibits more fine myelin structures. Complex subtraction detects the foci of demyelinated lesion more clearly than magnitude subtraction (red arrows). Moreover, myelin signal is underestimated with the magnitude subtraction (white arrow), presumably due to increased T1 associated with pathological changes in WM. Figure 5 shows the detected myelin signal from an MS patient. In all regions of interest, complex subtraction showed enhanced myelin signal, also demonstrated by the shifted histogram in Figure 5-d. In total, the myelin signal intensity measured with complex subtraction in the left frontal lobe or left parietal lobe was enhanced by 53.8% or 79.6% for healthy volunteers, and 126.8% or 135.9% for MS patients.Discussion and Conclusion
We showed that complex subtraction improved morphological imaging of myelin by reducing residual WML signal contamination caused by regional T1 variations. In both healthy volunteers and MS patients, the signal intensity in the region of myelin was dramatically improved with complex subtraction. The improvement was more dramatic in the myelin with fine structures. In MS patients, the demyelinated lesions were more clearly detected by the complex subtraction. Moreover, the signal intensity of the detected myelin tended to be higher with the complex subtraction in the normal appearing white matter. These results imply that complex subtraction may also improve quantitative myelin imaging, such as in the estimation of myelin proton density, T1, and T2*, which will be investigated in future studies.Acknowledgements
The authors acknowledge grant support from the NIH (1R01 NS092650 and T32 EB005970), and GE Healthcare.References
1. Fan S-J, Ma Y, Chang EY, Bydder GM, Du J. Inversion recovery ultrashort echo time imaging of ultrashort T 2 tissue components in ovine brain at 3 T: a sequential D 2 O exchange study. NMR Biomed. 2017;30:e3767.
2. Fan SJ, Ma Y, Zhu Y, et al. Yet more evidence that myelin protons can be directly imaged with UTE sequences on a clinical 3T scanner: Bicomponent T2* analysis of native and deuterated ovine brain specimens. Magn. Reson. Med. 2018;80:538–547.
3. Du J, Ma G, Li S, et al. Ultrashort echo time (UTE) magnetic resonance imaging of the short T2 components in white matter of the brain using a clinical 3T scanner. Neuroimage 2014;87:32–41.
4. Sheth V, Shao H, Chen J, et al. Magnetic resonance imaging of myelin using ultrashort Echo time (UTE) pulse sequences: Phantom, specimen, volunteer and multiple sclerosis patient studies. Neuroimage 2016;136:37–44.
5. Sheth VR, Fan S, He Q, et al. Inversion recovery ultrashort echo time magnetic resonance imaging: A method for simultaneous direct detection of myelin and high signal demonstration of iron deposition in the brain – A feasibility study. Magn. Reson. Imaging 2017;38:87–94.
6. Waldman a, Rees JH, Brock CS, Robson MD, Gatehouse PD, Bydder GM. MRI of the brain with ultra-short echo-time pulse sequences. Neuroradiology 2003;45:887–892.
7. Wilhelm MJ, Ong HH, Wehrli SL, et al. Direct magnetic resonance detection of myelin and prospects for quantitative imaging of myelin density. Proc. Natl. Acad. Sci. 2012;109:9605–9610 doi: 10.1073/pnas.1115107109.
8. Tannús A, Garwood M. Adiabatic pulses. NMR Biomed. 1997;10:423–434.
9. Sheth V, Shao H, Chen J, et al. Magnetic resonance imaging of myelin using ultrashort Echo time (UTE) pulse sequences: Phantom, specimen, volunteer and multiple sclerosis patient studies. Neuroimage 2016;136:37–44.
10. Carl M, Chiang J-TA. Investigations of the origin of phase differences seen with ultrashort TE imaging of short T2 meniscal tissue. Magn. Reson. Med. 2012;67:991–1003.
11. Jang H, Carl M, Ma Y, et al. Fat suppression for ultrashort echo time imaging using a single-point Dixon method. NMR Biomed. 2019:e4069.
12. Ma Y-J, Lu X, Carl M, et al. Accurate T1 mapping of short T2 tissues using a three-dimensional ultrashort echo time cones actual flip angle imaging-variable repetition time (3D UTE-Cones AFI-VTR) method. Magn. Reson. Med. 2018;80:598–608.
13. Fessler JA. On NUFFT-based gridding for non-Cartesian MRI. J. Magn. Reson. 2007;188:191–195 doi: 10.1016/j.jmr.2007.06.012.
14. Woolrich MW, Jbabdi S, Patenaude B, et al. Bayesian analysis of neuroimaging data in FSL. Neuroimage 2009;45:S173–S186.
15. Ma Y-J, Zhao W, Wan L, et al. Whole knee joint T 1 values measured in vivo at 3T by combined 3D ultrashort echo time cones actual flip angle and variable flip angle methods. Magn. Reson. Med. 2018:1–11.
Figures