0545
Measurement of Blood-Brain Barrier Permeability in Human Brain using Magnetization Transfer Effect at 7T.1Department of Electrical and Computer Engineering, Auburn University, Auburn, AL, United States, 2Auburn University MRI Research Center, Auburn, AL, United States
Synopsis
Blood-brain barrier (BBB) plays a very important role in regulating water and nutrients delivery between vascular circulation and central nervous system (CNS). Any disruption in the blood brain barrier may cause the alteration of normal functional activity of the nervous system. The techniques currently available to measure BBB permeability are prone to certain limitations and potential side effects. In this study we demonstrated a non-invasive technique of evaluating BBB permeability using the magnetization transfer (MT) effect on endogenous water labeled by arterial spin labeling (ASL) technique as a perfusion tracer.
Introduction
Blood-brain barrier (BBB) integrity is critical for the protection of central nervous system (CNS) as it restricts neurotoxins and macromolecules, providing a suitable functional environment for the CNS 1. Many CNS diseases such as Multiple Sclerosis, Alzheimer’s disease etc. are associated with compromised BBB 2-4. The methods currently available to evaluate BBB permeability are PET, dynamic contrast enhanced (DCE) MRI and diffusion weighted arterial spin labeling (ASL); which involve radio activity, potential side effects and complex model fitting 5,6. Evidence of limited water exchange between cerebral vascular circulation and tissue space makes perfusion signal a strong tool to assess BBB permeability. The perfusion signal measured with and without brain macromolecular saturation can be used to calculate permeability surface area product (PS). The technique relies on the fact that if the brain macromolecules are saturated with additional magnetization transfer (MT) pulses during perfusion imaging, the vascular water and the water that has been exchanged with tissue water, will experience very different MT effect 7,8. A previous study has used similar concept to estimate water extraction fraction (E) in rat brain 9. In this study we demonstrate a novel technique using the MT effect on QUIPSS II 10 method to measure BBB permeability surface area product in human brain at 7T.Methods
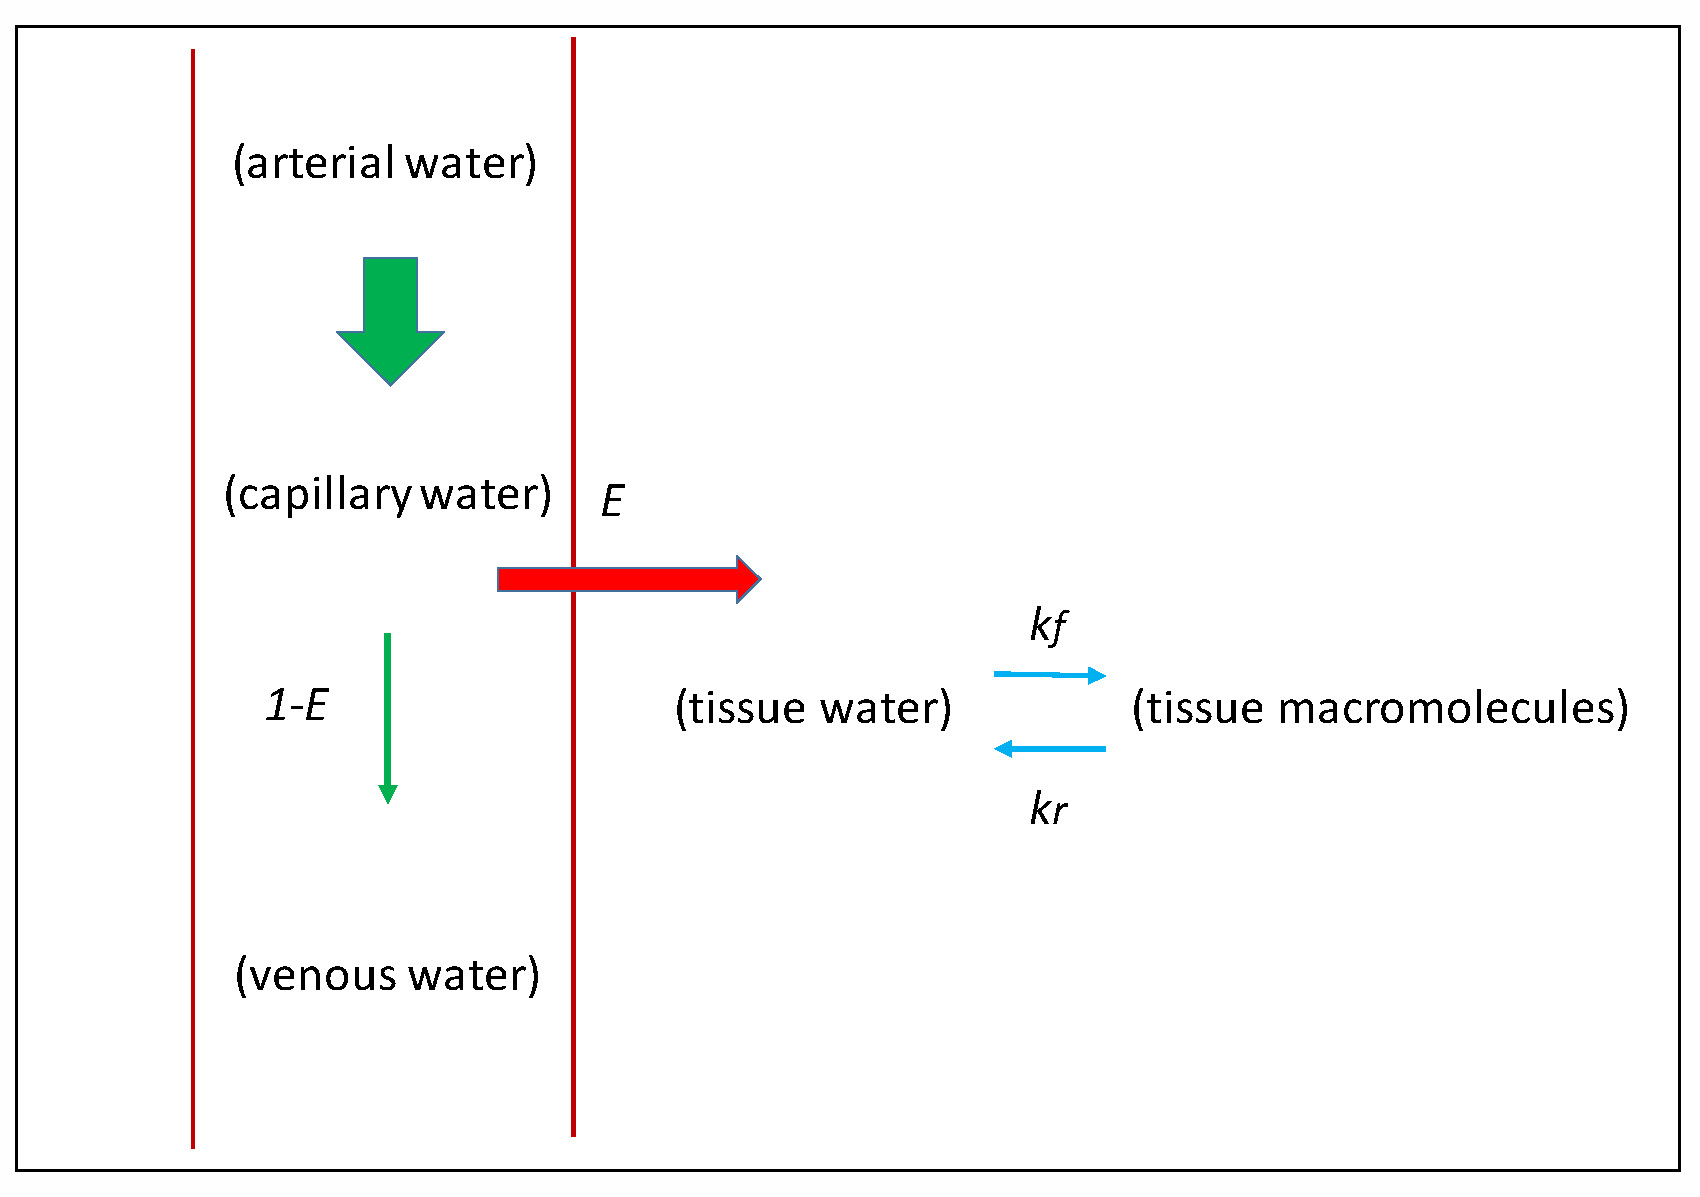
Figure 1 shows the schematic of the model used for perfusion measurement including E and the MT effect due to the cross relaxation between tissue water and tissue macromolecules. Including these parameters in Bloch equation, E can be estimated using 10:$$E=1-\frac{1}{2VS_{0}\alpha} [\frac{\frac{S_{2}-S_{3}}{S_{3}+(2\alpha-1)S_{2}}-(1+\delta T_{1t})\frac{S_{0}-S_{1}}{S_{1}+(2\alpha -1)S_{0}}}{\frac{1}{S_{3}+(2\alpha-1)S_{2}}-(1+\delta T_{1t})\frac{1}{S_{1}+(2\alpha -1)S_{0}}}]$$
Where V = vascular volume fraction in unit voxel 11, α = labeling efficiency 12,13, S0 and S1 are control and tag signal without additional MT, S2 and S3 are control and tag signals with MT, T1t is brain water proton relaxation time constant and δ is defined as:
$$\delta=\frac{k_{f}}{1+k_{r}T_{1m}}$$
Where kf and kr are forward and reverse MT rate constants, T1m is brain macromolecular proton relaxation time constant.
We have implemented QUIPSS II FAIR ASL technique to perform quantitative brain perfusion measurements in humans at 7T 7,14. Additional MT pulses were incorporated in the pulse sequence to saturate the macromolecules during ASL acquisition. ASL signal with and without MT pulses can be used to determine variable β as defined below:
$$\beta=\frac{S_{SS}-S_{NS}}{S_{SSm}-S_{NSm}}=(1+\delta T_{1t})$$
Where SSSm and SNSm are slice selective and non-selective acquisitions with MT, SSS and SNS are slice selective and non-selective acquisitions without MT.
Incorporating this into equation 1 yields:
$$E=1-\frac{1}{2VS_{NS}\alpha} [\frac{\beta\frac{S_{SSm}-S_{NSm}}{S_{SSm}+(2\alpha-1)S_{NSm}}-\frac{S_{SS}-S_{NS}}{S_{SS}+(2\alpha -1)S_{NS}}}{\beta\frac{1}{S_{SSm}+(2\alpha-1)S_{NSm}}-\frac{1}{S_{SS}+(2\alpha -1)S_{NS}}}]$$
PS is then calculated from perfusion and E using the method described in 15,16. Magnetization transfer ratio (MTR) fraction can be calculated from the non-selective acquisitions using the method described in 17.
All experiments were performed on a Siemens 7T Magnetom (Erlangen, Germany) using a 32 channel head coil. Six sets of data were acquired from 4 healthy subjects. Pulse sequence was developed for FAIR QUIPSS II ASL approach with and without MT pulses in an interleaved fashion. 8 ms hyperbolic secant adiabatic pulse was used to acquire tag (SS) and control (NS) image. Double saturation was applied TI1 sec after the inversion pulse with pulse duration of 2.56 ms to achieve a 40 mm saturation, with a gap of 1 cm between proximal edge of imaging slice and distal edge of saturation slice. 6 MT pulses with duration of 16.64 ms were used to saturate the macromolecules. MT on and off frequency was 500 Hz and 100000 Hz with MT pulse angle of 500 to acquire MT on and MT off data respectively. The complete data set was acquired in an interleaved fashion in the order: SS (MT on)/NS (MT on)/SS (MT off)/NS (MT off). A FLASH readout was used with the following imaging parameters: FOV=256 mm, TI1=0.8 s, TI2=1.8 s, TR=2 s, TE=1.39 ms, Flip angle=100, slice thickness=8 mm, in-plane resolution=1mm x 1mm, bandwidth=800 Hz/pixel. A reference proton density image was acquired similarly as the non-selective acquisition with all the saturation and inversion pulses turned off and used to quantify perfusion as described in 14.
Results
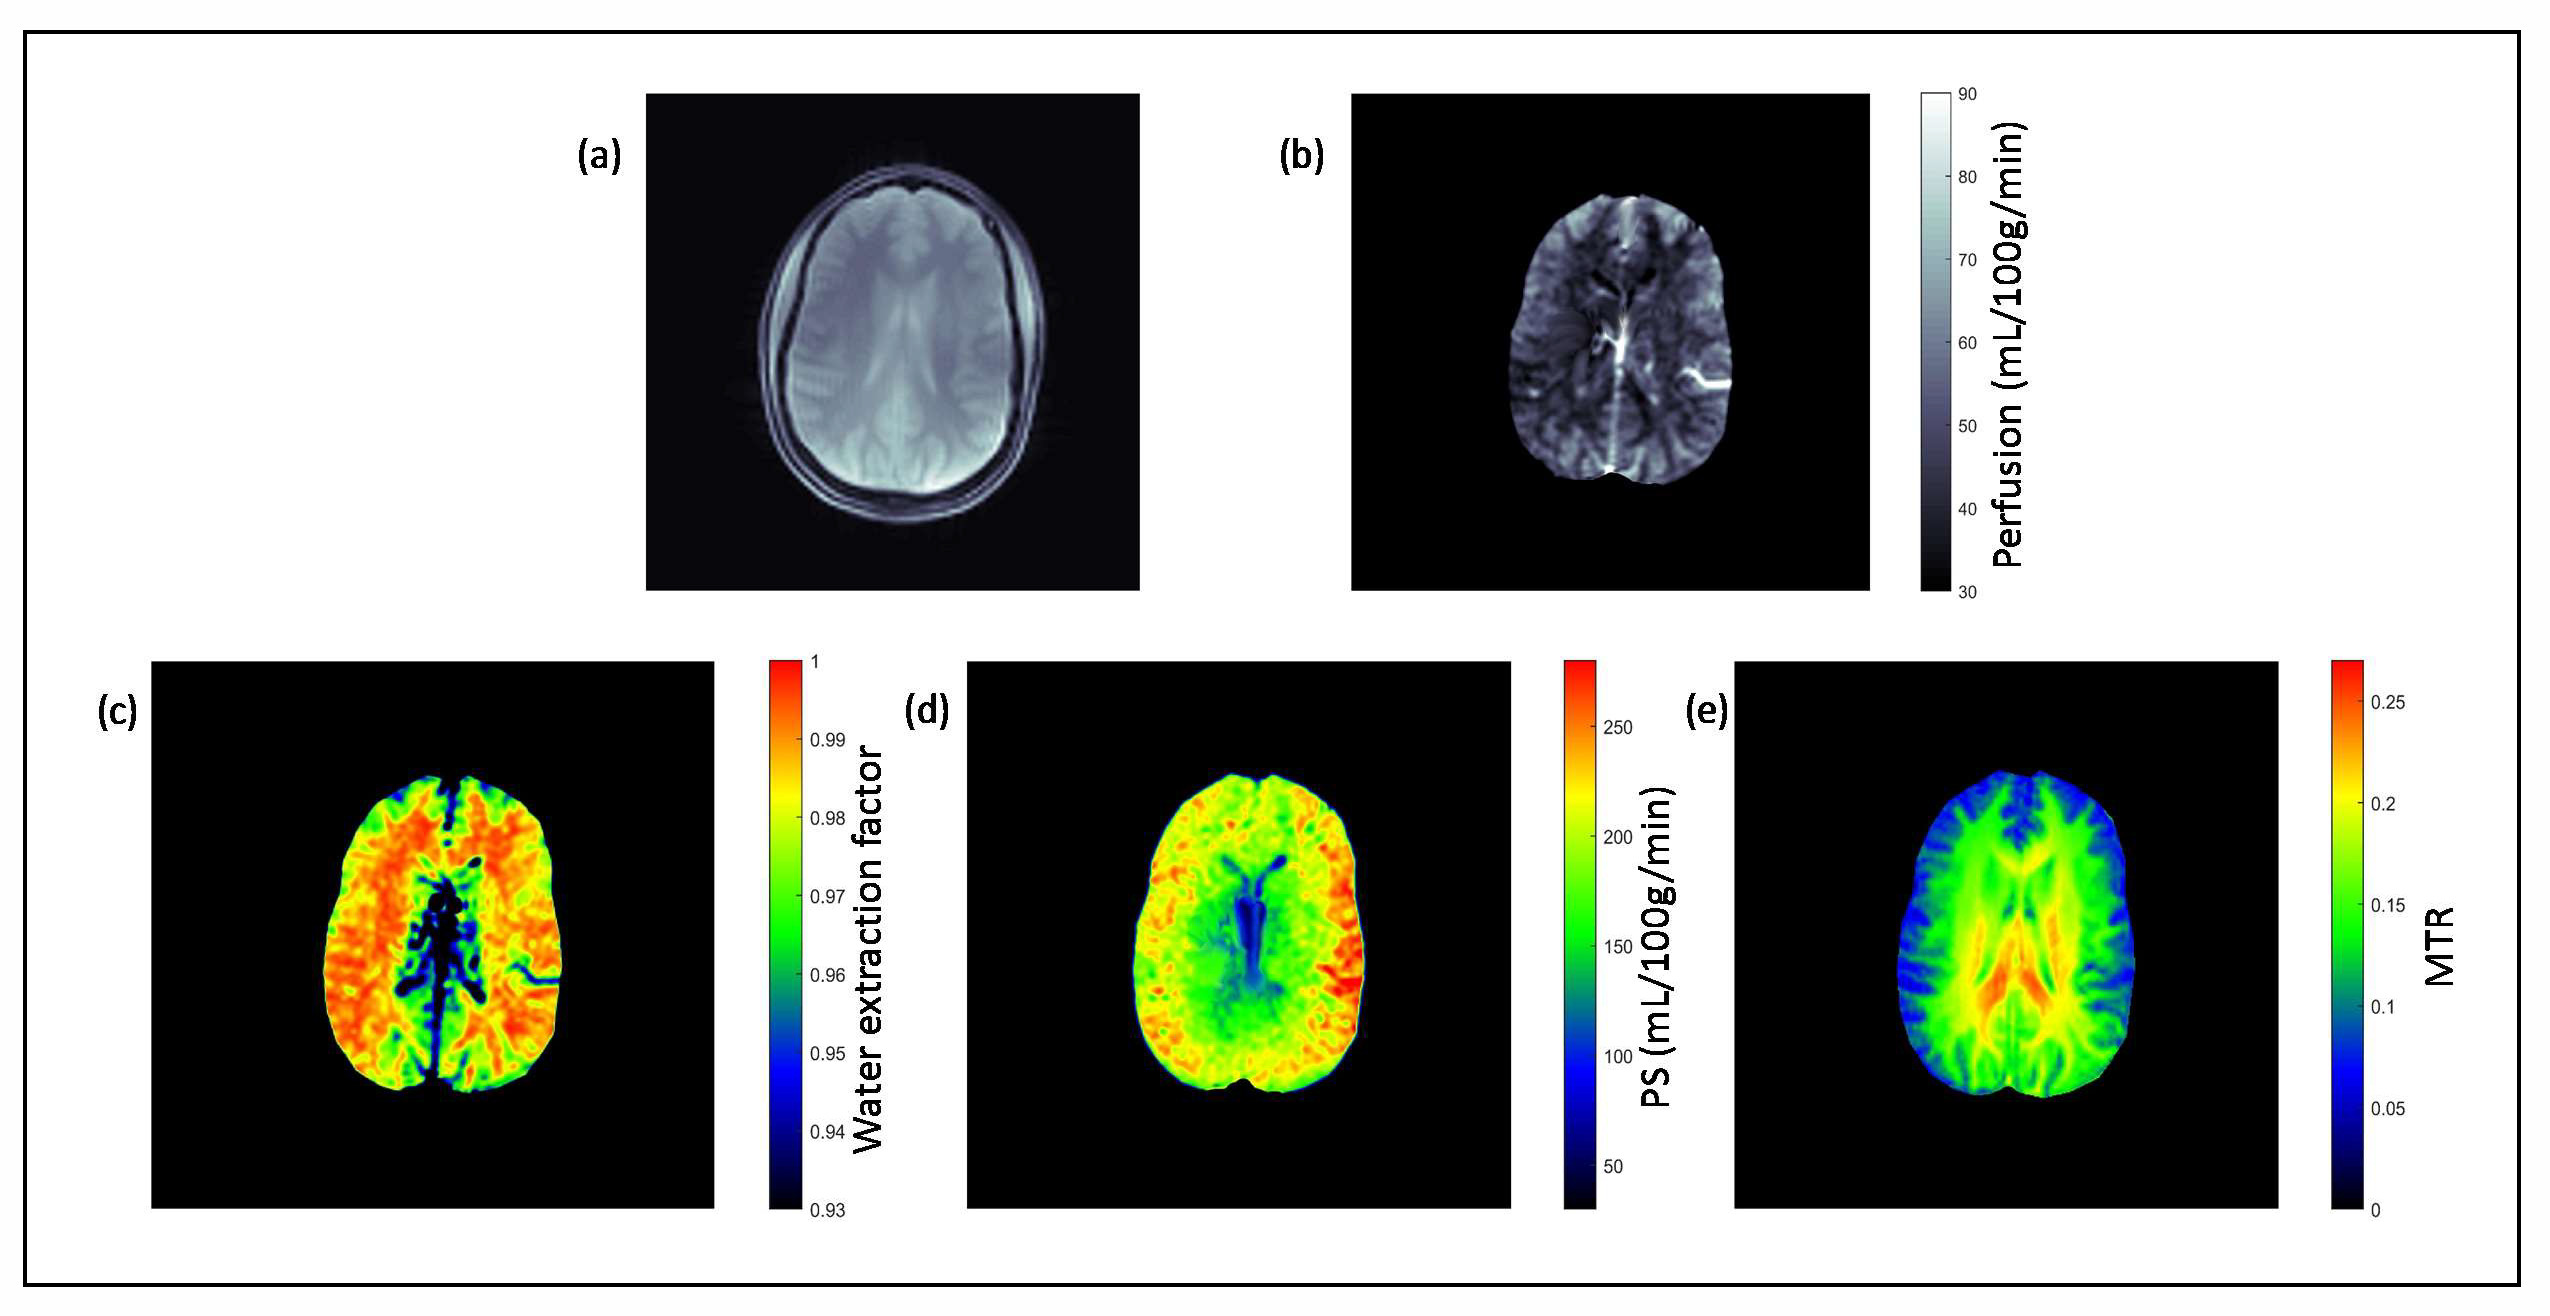
Figure 2a shows the reference proton density image and figure 2b shows the quantitative perfusion map of the brain. Average perfusion in the gray matter and white matter was 66±11 mL/100g/min and 41±14 mL/100g/min respectively. Water extraction fraction map shows that average extraction fraction in white and gray matter was 0.957±0.02 and 0.916±0.03 respectively (figure 2c), which is in agreement with previous reports 18,19. Permeability surface area product map (figure 2d) shows that average PS in white and gray matter was 129±43 mL/100g/min and 163.5±53 mL/100g/min respectively. Figure 2e shows the magnetization transfer ratio (MTR). For the protocol used in this study, average MTR in white and gray matter was 0.144±0.01 and 0.109±0.017 respectively.Discussion
In this study we have demonstrated a novel non-contrast method for measuring BBB permeability using the MT effect on perfusion imaging. This technique enables to measure PS and MTR simultaneously. Besides perfusion and PS, change in MTR due to CNS disease, such as Multiple Sclerosis, has been reported 20. So this technique can be very useful in investigating any CNS disease efficiently.Acknowledgements
No acknowledgement found.References
1. Abbott NJ, Patabendige AAK, Dolman DEM, Yusof SR, Begley DJ. Structure and function of the blood-brain barrier. Neurobiology of Disease 2010;37(1):13-25.
2. Bell RD, Zlokovic BV. Neurovascular mechanisms and blood-brain barrier disorder in Alzheimer's disease. Acta Neuropathologica 2009;118(1):103-113.
3. Desai BS, Monahan AJ, Carvey PM, Hendey B. Blood-brain barrier pathology in Alzheimer's and Parkinson's disease: Implications for drug therapy. Cell Transplantation 2007;16(3):285-299.
4. Kermode AG, Thompson AJ, Tofts P, Macmanus DG, Kendall BE, Kingsley DPE, Moseley IF, Rudge P, Mcdonald WI. Breakdown of the Blood-Brain-Barrier Precedes Symptoms and Other Mri Signs of New Lesions in Multiple-Sclerosis - Pathogenetic and Clinical Implications. Brain 1990;113:1477-1489.
5. Olchowy C, Cebulski K, Lasecki M, Chaber R, Olchowy A, Kalwak K, Zaleska-Dorobisz U. The presence of the gadolinium-based contrast agent depositions in the brain and symptoms of gadolinium neurotoxicity - A systematic review. Plos One 2017;12(2).
6. Wengler K, Bangiyev L, Canli T, Duong TQ, Schweitzer ME, He X. 3D MRI of whole-brain water permeability with intrinsic diffusivity encoding of arterial labeled spin (IDEALS). Neuroimage 2019;189:401-414.
7. Dousset V, Degreze P, Mieze S, Sesay M, BasseCathalinat B, Caille JM. Magnetization transfer on in vitro circulating blood: Implications for time-of-flight MR angiography. Jmri-J Magn Reson Im 1995;5(6):786-788.
8. Balaban RS, Ceckler TL. Magnetization transfer contrast in magnetic resonance imaging. Magn Reson Q 1992;8(2):116-137.
9. Silva AC, Zhang W, Williams DS, Koretsky AP. Estimation of water extraction fractions in rat brain using magnetic resonance measurement of perfusion with arterial spin labeling. Magn Reson Med 1997;37(1):58-68.
10. Wong EC, Buxton RB, Frank LR. Quantitative imaging of perfusion using a single subtraction (QUIPSS and QUIPSS II). Magn Reson Med 1998;39(5):702-708.
11. Reinstrup P, Ryding E, Ohlsson T, Dahm PL, Uski T. Cerebral blood volume (CBV) in humans during normo- and hypocapnia: influence of nitrous oxide (N(2)O). Anesthesiology 2001;95(5):1079-1082.
12. Wong EC, Buxton RB, Frank LR. A theoretical and experimental comparison of continuous and pulsed arterial spin labeling techniques for quantitative perfusion imaging. Magnet Reson Med 1998;40(3):348-355.
13. Zhang X, Petersen ET, Ghariq E, De Vis JB, Webb AG, Teeuwisse WM, Hendrikse J, van Osch MJ. In vivo blood T(1) measurements at 1.5 T, 3 T, and 7 T. Magn Reson Med 2013;70(4):1082-1086.
14. Alsop DC, Detre JA, Golay X, Gunther M, Hendrikse J, Hernandez-Garcia L, Lu H, MacIntosh BJ, Parkes LM, Smits M, van Osch MJ, Wang DJ, Wong EC, Zaharchuk G. Recommended implementation of arterial spin-labeled perfusion MRI for clinical applications: A consensus of the ISMRM perfusion study group and the European consortium for ASL in dementia. Magn Reson Med 2015;73(1):102-116.
15. Crone C. The Permeability of Capillaries in Various Organs as Determined by Use of the 'Indicator Diffusion' Method. Acta Physiol Scand 1963;58:292-305.
16. Renkin EM. Transport of potassium-42 from blood to tissue in isolated mammalian skeletal muscles. Am J Physiol 1959;197:1205-1210.
17. Grossman RI, Gomori JM, Ramer KN, Lexa FJ, Schnall MD. Magnetization-Transfer - Theory and Clinical-Applications in Neuroradiology. Radiographics 1994;14(2):279-290.
18. Lin ZX, Li Y, Su P, Mao D, Wei ZL, Pillai JJ, Moghekar A, van Osch M, Ge YL, Lu HZ. Non-contrast MR imaging of blood-brain barrier permeability to water. Magnet Reson Med 2018;80(4):1507-1520.
19. Herscovitch P, Raichle ME, Kilbourn MR, Welch MJ. Positron emission tomographic measurement of cerebral blood flow and permeability-surface area product of water using [15O]water and [11C]butanol. J Cereb Blood Flow Metab 1987;7(5):527-542.
20. Liu Z, Pardini M, Yaldizli O, Sethi V, Muhlert N, Wheeler-Kingshott CAM, Samson RS, Miller DH, Chard DT. Magnetization transfer ratio measures in normal-appearing white matter show periventricular gradient abnormalities in multiple sclerosis. Brain 2015;138:1239-1246.
Figures