0543
Quantification of T1 and relative proton density in the brain ultrashort-T2* component1Department of Radiology and Biomedical Imaging, University of California, San Francisco, San Francisco, CA, United States, 2Department of Neuroimaging, King’s College London, London, United Kingdom
Synopsis
This study presents a VFA approach for quantification of T1 and relative proton density of the brain ultrashort-T2* component. Measured T1 values corresponding to the ultrashort-T2* component were lower compared to T1 values corresponding to long-T2* components, and did not exhibit gray/white matter differences. Qualitatively, ultrashort-T2* component fraction maps showed better gray/white matter contrast and clearer white matter structure delineation which we expect to be a more accurate representation of relative proton density. These results show that added VFA T1 encoding in characterization of the brain ultrashort-T2* component can more accurately differentiate white matter anatomy.
Introduction
Myelin plays a critical role in facilitating rapid neural signal conduction across the brain. MRI is the preferred imaging modality for assessing myelin given its sensitivity to water content, binding, and diffusion. Recent studies have characterized ultrashort-T2 components in the brain using a novel ultrashort echo time (UTE) relaxometry method. These components are most likely associated with methylene protons in myelin phospholipid membranes and are a potentially more direct measure of myelination1, 2, 3, 4, 5.Longitudinal relaxation time (T1) also provides insight into the microstructure of many tissues. T1 relaxation time differs significantly between white and gray matter and T1 weighted images are used routinely in clinical scans acting as a crucial biomarker for morphological assessment for myelination. In this work, we used a variable flip angle (VFA), variable TE, 3D UTE sequence to simultaneously measure T1, T2*, and relative proton density of the brain ultrashort-T2* component. Adding T1 measurements to the signal model could potentially characterize ultrashort-T2* components associated with myelin-bound protons more accurately.
Methods
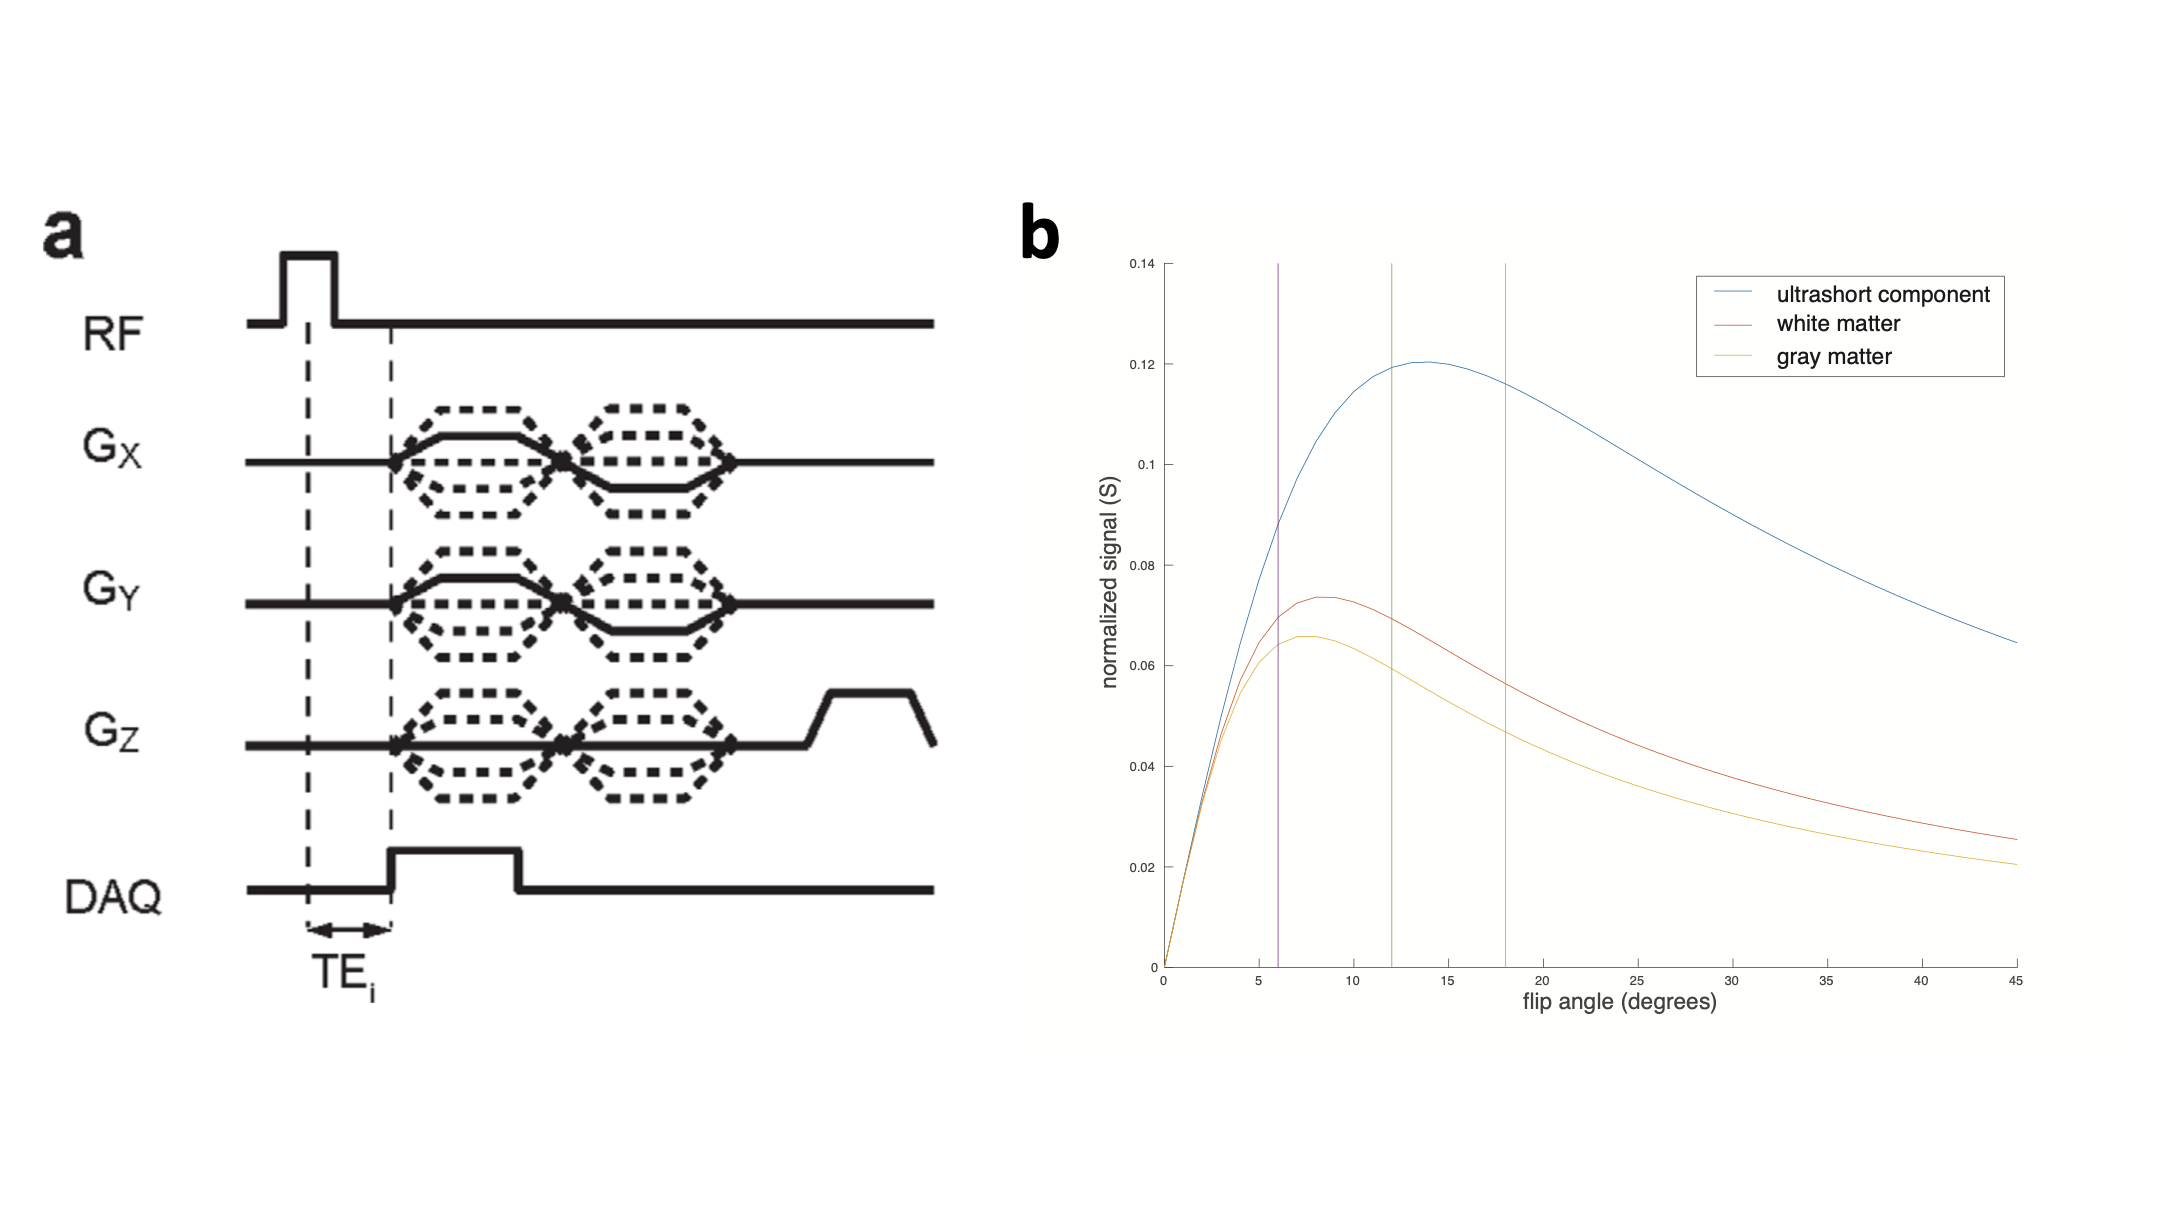
Whole brain relaxometry was performed using a 3D radial pulse sequence supporting UTEs with a nonselective, hard pulse excitation. The delay between excitation and readout was shifted between TRs to acquire a set of 8 different sets TEs within a single scan ranging from 24 µs to 5 ms. Three of these UTE scans were performed at 6, 12, and 18 degree flip angles. T1, T2*, and relative proton density maps were derived using the VFA method and adding the SPGR signal equation to the following signal model:$$S(\vec{r}, TE, \alpha, TR) =\sum_{k=1}^{N} \hat{S}_{0, k}(\vec{r})* \frac{sin(\alpha)*(1 - exp(-TR/T_{1, k}(\vec{r})))}{1-cos(\alpha) * exp(-TR/T_{1, k}(\vec{r}))} * exp(-TE/T^{*}_{2, k}(\vec{r}))exp(i(2\pi \delta f_{k}(\vec{r})TE + \phi _{k}(\vec{r})))$$
with N=2 components where the first captured all long-T2* (> 1 ms) components and the second captured the ultrashort-T2* (< 1 ms) components. Our prior work has shown that, while the long-T2* components are near the water resonance frequency, the ultrashort-T2* component is near the primary fat resonance frequencies (~1.5 ppm)5. Quantitative parameter maps for each flip angle representing each of these measurements were generated in MATLAB (Mathworks). Flip angles were strategically chosen to saddle either side of the Ernst angles for gray, white matter, and the ultrashort-T2* component for more accurate T1 quantification (Figure 1). Other key parameters were 2-2.2 mm isotropic resolution, 4.1-5.8 fold parallel imaging acceleration reconstructed with non-Cartesian ESPIRiT6.
T1 values for ultrashort-T2* and long-T2* components were averaged across 5 healthy volunteers. For maps corresponding to the T1 long-T2* component, a bimodal gaussian mixture model fit with 2 components was performed to measure the mean and standard deviation corresponding to T1 values in white and gray matter.
Results and Discussion
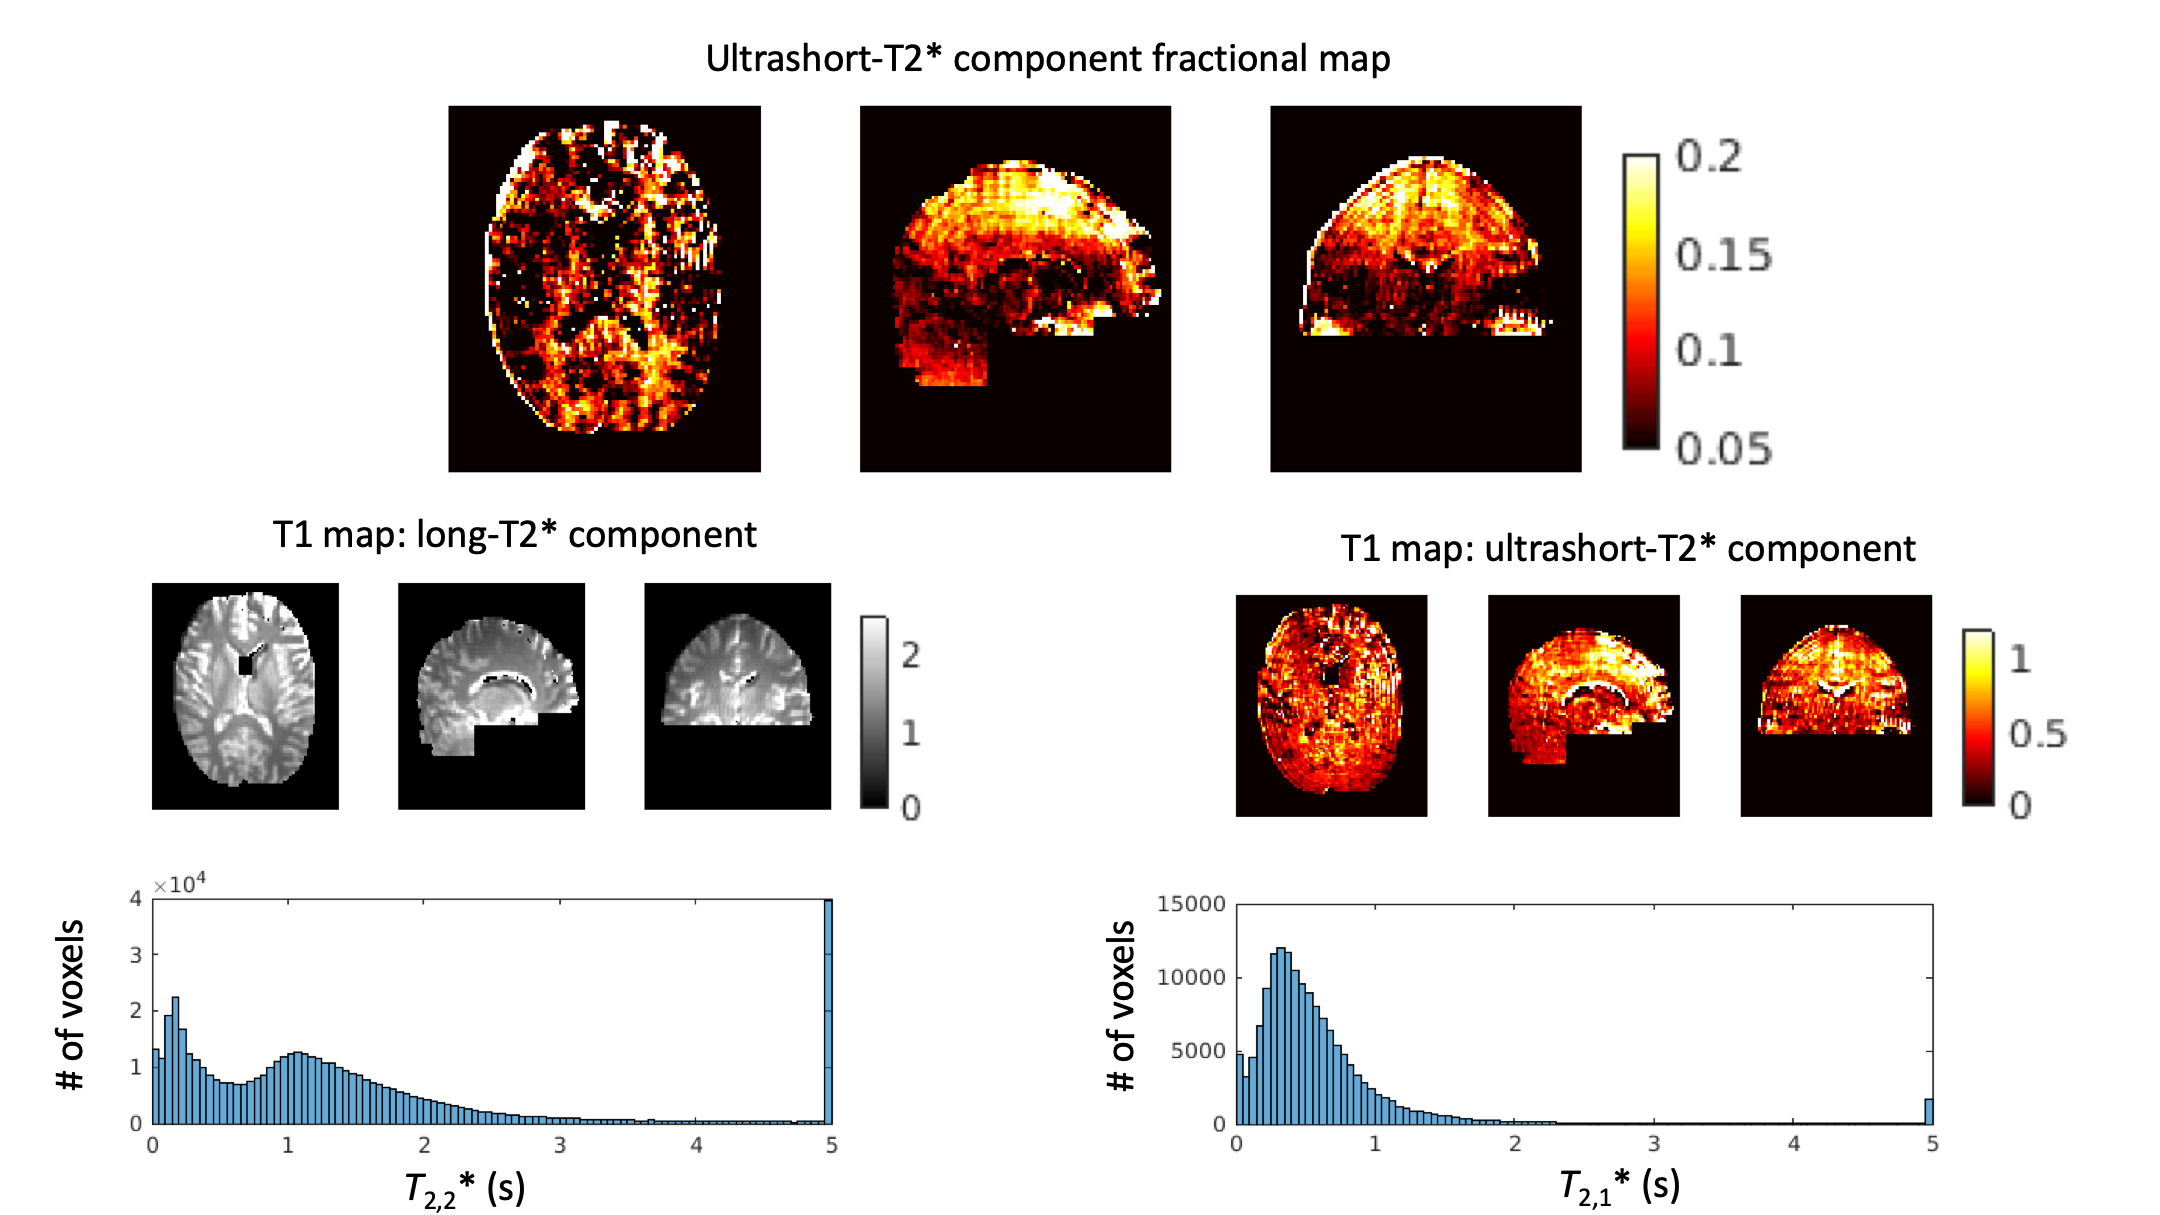
Figure 2 showcases the respective T1 maps for the long-T2* component (at water frequency) and the ultrashort-T2* component (at lipid frequency). The histogram distribution of the long-T2* component displays a classic bimodal distribution where each peak corresponds to white and gray matter respectively demonstrating good contrast between white and gray matter. T1 values for gray matter average to approximately 1300ms while the T1 values for white matter average around 500-600ms. The T1 values for gray matter compare favorably to literature values while white matter values are slightly underestimated. This could be due to B1 field inhomogeneities in the center of the brain and/or the presence of myelin water signal in this T2* > 1ms component.Comparatively, the histogram distribution and averaged values for the ultrashort-T2* component average to approximately 300ms. The lack of a bimodal distribution in the T1 ultrashort-T2* map suggests the measured signals are originating from a similar origin. The reduced measured T1 relaxation time suggests that the signals do not originate from protons in intracellular or extracellular water.
Figure 3 shows whole-brain ultrashort-T2* fractional component maps derived from single flip angle scans in addition to the VFA approach. From the dynamic range scaling bars, measured ultrashort-T2* fractional component values across the brain range from 0.08 to 0.28 in the single flip angle scans. Conversely, ultrashort-T2* fractional component values with added T1 compensation from the SPGR term in the VFA approach are much smaller with a dynamic range between 0.01 and 0.05. We expect this to be more accurate in representing the relative proton density because the single flip angle fractional component maps suffer from differential T1-weighting between gray and white matter in the long-T2* component. Qualitative analysis of the T1-weighted fractional maps shows: i) better gray and white matter contrast and ii) better delineated white matter structures across the cortex.
Conclusion
This work presents an approach for quantification of T1 and relative proton density of the brain ultrashort-T2* component. Specifically, measured T1 values corresponding to the ultrashort-T2* component were lower compared to T1 values corresponding to long-T2* components, and did not exhibit a bimodal distribution (e.g. no gray/white differences). The measured ultrashort-T2* component fraction maps qualitatively showed better white/gray matter contrast and more clear white matter structure delineation with the VFA approach, which we expect to be a more accurate representation of relative proton density. These results show that added VFA T1 encoding in characterization of the brain ultrashort-T2* component can more accurately differentiate white matter anatomy.Acknowledgements
This work was supported by research grants: NIH R21NS089004, NMSS research grant PP3360.References
1. Horch, R. A., Gore, J. C., & Does, M. D. (2011) Origins of the ultrashort-T(2) (1) H NMR signals in myelinated nerve: A direct measure of myelin content?. Magn Reson Med 66, 24-31.
2. Wilhelm, M. J., Ong, H. H., Wehrli, S. L., Li, C., Tsai, P.-H., Hackney, D. B., & Wehrli, F. W. (2012) Direct magnetic resonance detection of myelin and prospects for quantitative imaging of myelin density. Proc Natl Acad Sci U S A 109, 9605-10.
3. Du, J., Ma, G., Li, S., Carl, M., Szeverenyi, N. M., VandenBerg, S., Corey-Bloom, J., & Bydder, G. M. (2014) Ultrashort echo time (UTE) magnetic resonance imaging of the short T2 components in white matter of the brain using a clinical 3T scanner. Neuroimage 87, 32-41.
4. Du J ,Sheth V ,He Q ,Carl M ,Chen J ,Corey-Bloom J ,Bydder GM. Measurement of T1 of the ultrashort T2* components in white matterof the brain at 3T. PLoS One 2014;9:e103296.
5. Boucneau, T., Cao P, Tang, S., Han M., Xuan D., Henry RG., & Larson PEZ. (2018) In Vivo Characterization of Brain Ultrashort-T2 Components. Magn Reson Med, 80(2), 726-735.
6. Uecker, M., Lai, P., Murphy, M. J., Virtue, P., Elad, M., Pauly, J. M., Vasanawala, S. S., & Lustig, M. (2013) ESPIRiT-an eigenvalue approach to autocalibrating parallel MRI: Where SENSE meets GRAPPA. Magn Reson Med , 71(3), 990-1001.
Figures
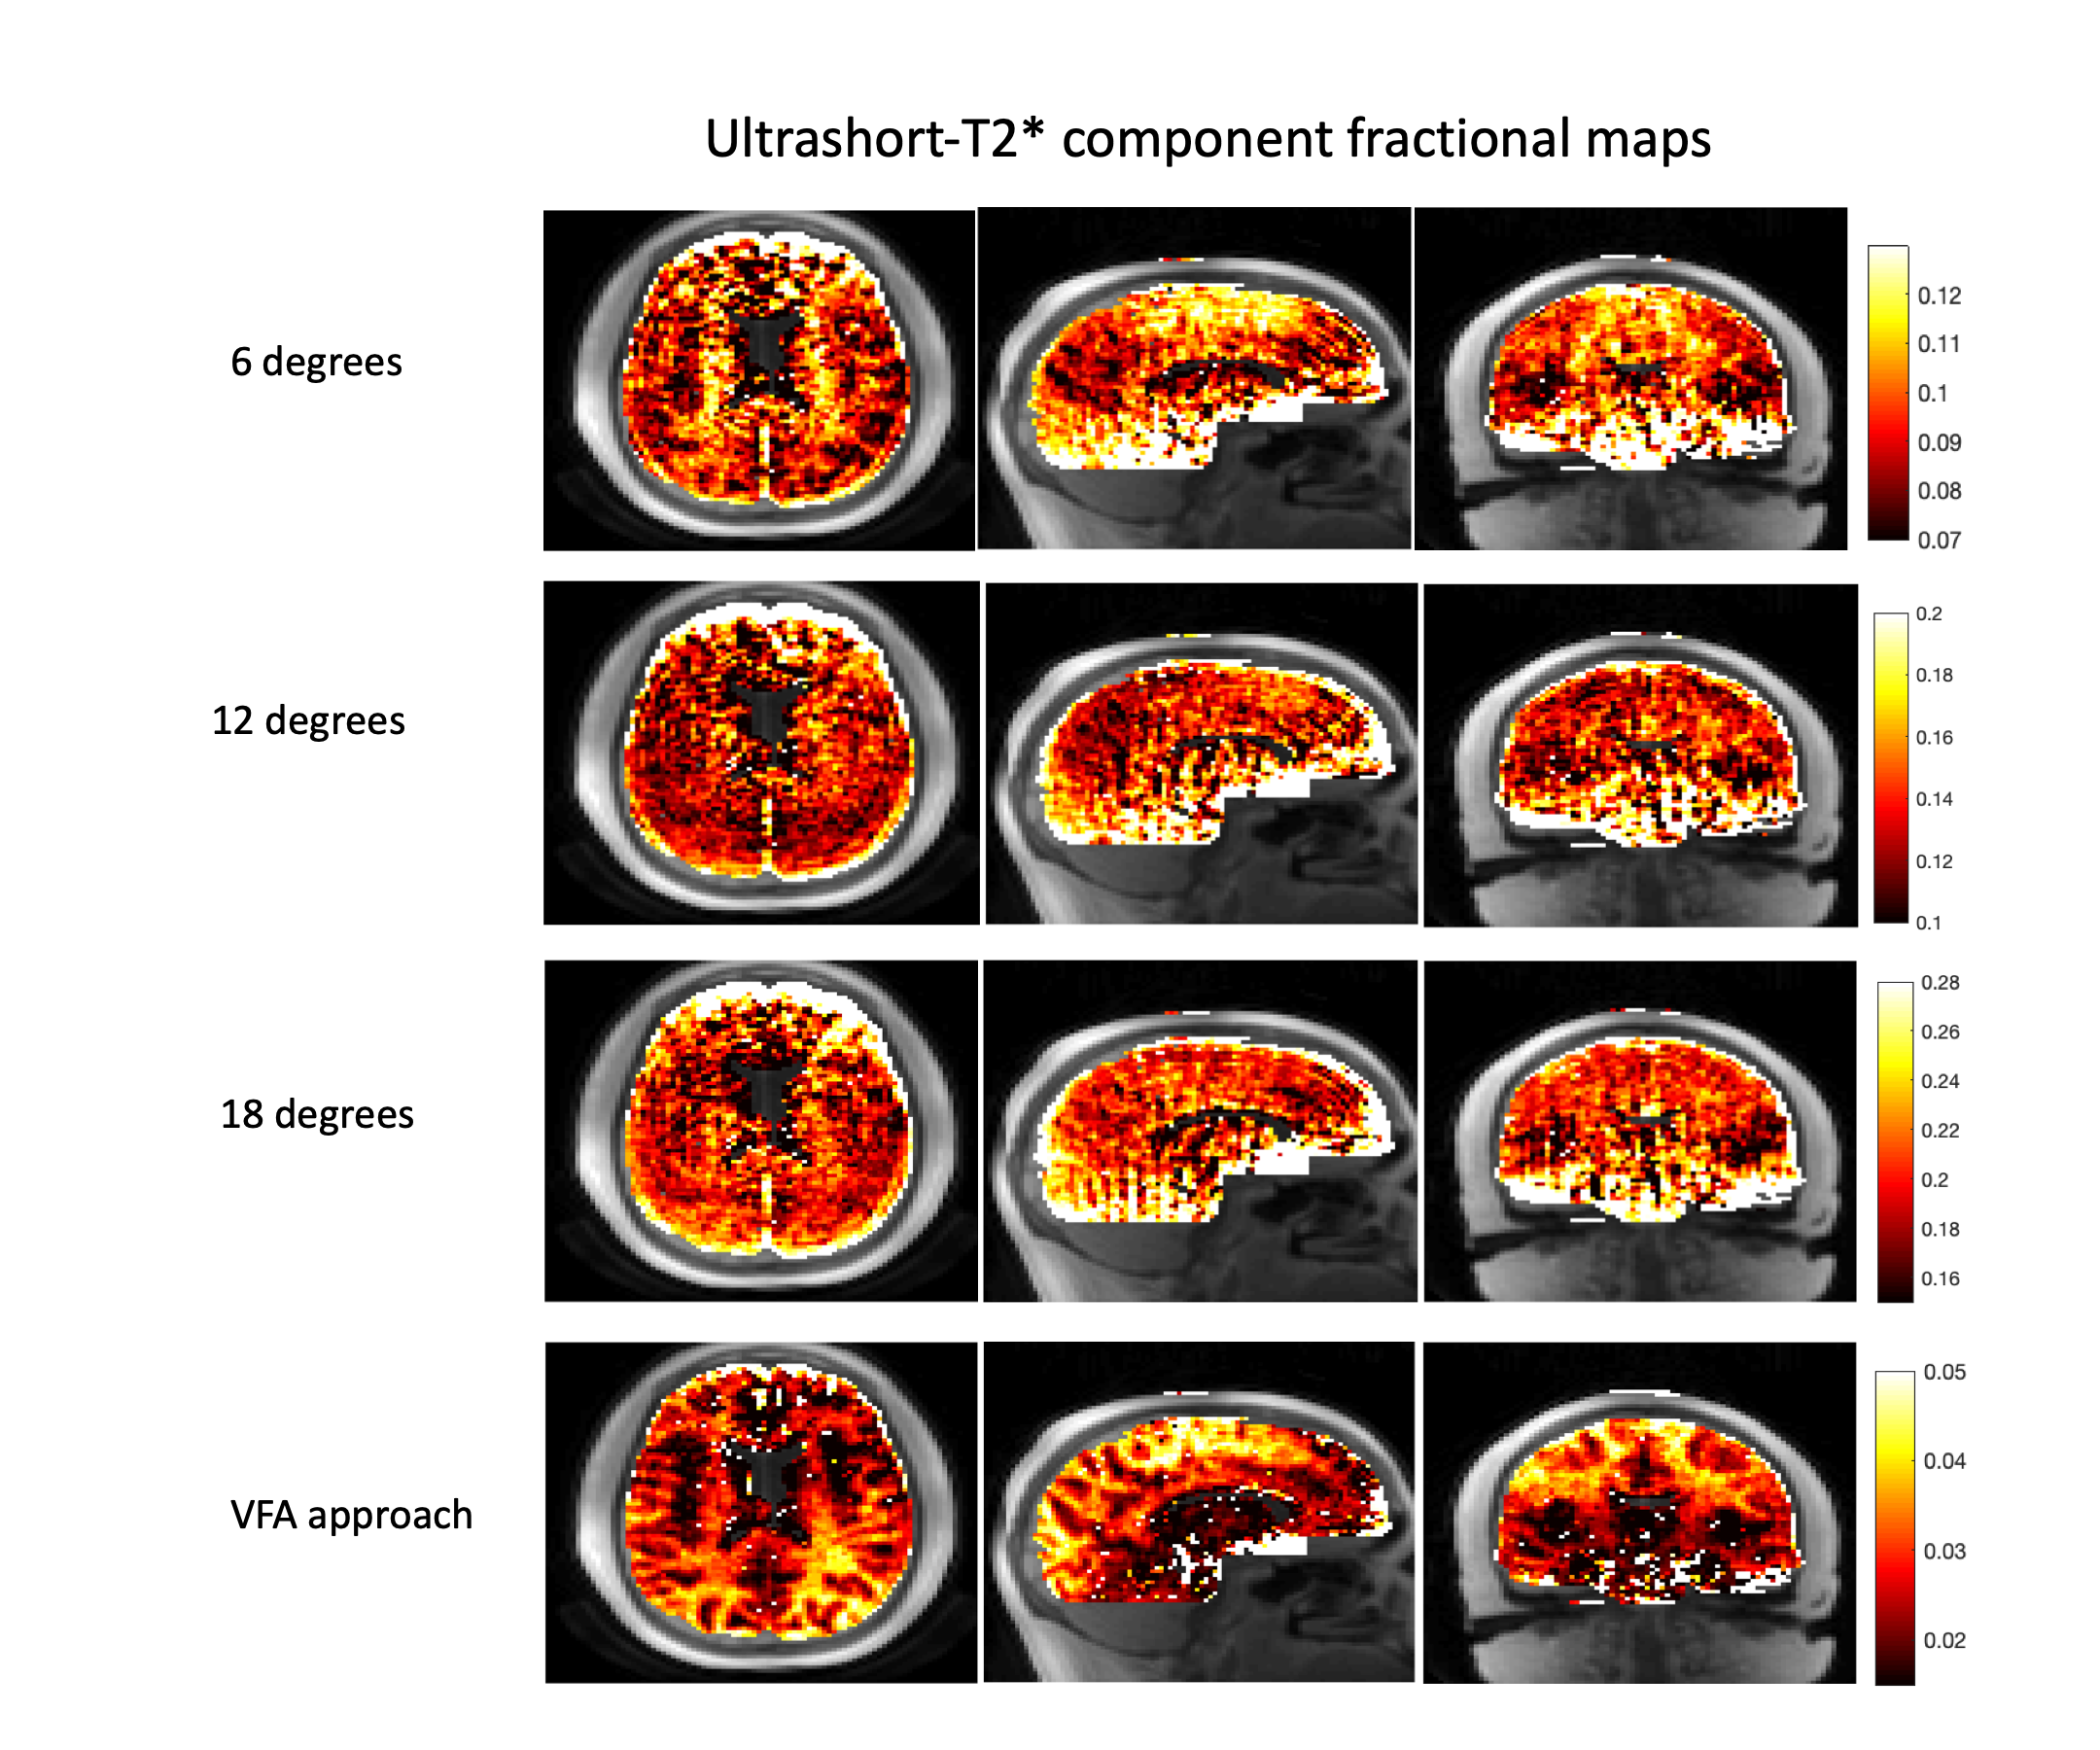
Ultrashort-T2* component fractional maps, computed as the Ultrashort-T2* signal / (Long-T2* signal + Ultrashort-T2* signal) fit from scans with single flip angles as well as with the VFA method. The VFA approach shows both lower fractional component values as well as more clear white and gray matter contrast and well defined white matter structures. We expect this approach to be more accurate, as it accounts for T1 differences in the long-T2* component.