0541
Short-term effects of transcranial direct current stimulation (tDCS) on cerebral blood flow measured with ASL MRI
Iris Asllani1,2, Francesco Di Lorenzo3, Katerina Gialopsou3, Joseph G Woods4,5, Marco Bozzali3, and Mara Cercignani3
1Neuroscience, University of Sussex, Brighton, United Kingdom, 2Biomedical Engineering, Rochester Institute of Technologygy, Rochester, NY, United States, 3University of Sussex, Brighton, United Kingdom, 4Radiology, University of California San Diego, San Diego, CA, United States, 5University of Oxford, Oxford, United Kingdom
1Neuroscience, University of Sussex, Brighton, United Kingdom, 2Biomedical Engineering, Rochester Institute of Technologygy, Rochester, NY, United States, 3University of Sussex, Brighton, United Kingdom, 4Radiology, University of California San Diego, San Diego, CA, United States, 5University of Oxford, Oxford, United Kingdom
Synopsis
Short-term effects of transcranial direct current stimulation (tDCS) on CBF were measured using arterial spin labeling (ASL) MRI. Results showed that anodal surface stimulation of the motor region was followed by an increase in gray matter CBF in that region. Conversely, CBF in the stimulated region following a cathodal stimulation decreased. There was no effect of sham stimulation on the CBF of the stimulated area. These findings may help forge a new path toward a better understanding of the neuro-physiological effects of tDCS in humans.
INTRODUCTION
In 1964, Bidman et al. used transcranial direct current stimulation (tDCS) to show that a brief passage of polarizing current through the surface of the cerebral cortex could alter neuronal firing of the stimulated region1. The study showed that positive (anodal) surface current enhanced neuronal firing and increased the size of evoked potentials in rats1. The application of negative (cathodal) current had the inverse effect1. When the stimulation was prolonged to 5 -10 min, a persistent after-effect was produced, lasting for up to 5 hours1. Since then, tDCS has been applied in humans showing promising results in modulating non-invasively neuronal activity and function of the stimulated cortical areas, providing the rationale for therapeutic use in several brain disorders, such as stroke and depression2,3. Changes in neuronal activity caused by tDCS are thought to be mediated via changes in membrane permeability1, but the underlying physiological mechanisms of these effects remain largely unknown. Depending on the region stimulated, tDCS effects are usually investigated in an indirect way by looking at behavioral outcomes or by analyzing the modulation of the motor evoked potentials using by transcranial magnetic stimulation. Kwon et al. were the first to use BOLD fMRI with tDCS to investigate changes in motor cortex in humans4. In 2011, a similar experiment was performed by combining arterial spin labeling (ASL) with tDCS5. In both studies, the MRI acquisition was done simultaneously with the application of tDCS. Here, we used ASL to measure post-tDCS effects on the CBF in the motor region for both anodal and cathodal applications. We tested the hypothesis that an anodal tDCS current would cause an increase in CBF in the motor region at 25 minutes following the application. Conversely, a depression in CBF would be observed in the same region when cathodal tDCS current was applied.METHODS
Study Protocol: Each subject (n = 6, age = 33 ±8 years, 3 men) participated in 3 separate sessions (3-5 days apart). For each session the protocol was as followed: (1) MRI acquisition, (2) either a baseline/sham or anodal or cathodal tDCS (randomized order across patients), (3) MRI acquisition. For tDCS, a weak direct current of 2 mA (0.057 mA/cm2) was delivered for 20 minutes by means of two surface electrodes (5 x 5 cm2) applied over the left motor region and the contralateral orbito-frontal cortex. The anatomical landmarks were identified through the 10-20 system. Current was ramped up and down to 2 mA during the first 15 s of each session. An MRI visible marker was put in the area of stimulation to aid with the drawing of the motor region of interest (motor_ROI).MRI Acquisition: The pCASL images were acquired about ~25 minutes following the end of tDCS delivery with: labeling duration = 2s, post labeling delay = 1.8s, 40 control/label pairs, TR = 4.5s, TE = 14ms. For one participant, the protocol was run twice, 4 months apart, for a total of 6 sessions. MPRAGE and Diffusion Weighted images were also acquired on all participants before and after stimulation.
Image Processing & Analyses: Partial volume correction algorithm was applied to ASL data. A motor_ROI was computed directly under the area of stimulation using an in-house MatLab code based on local image-thresholding. A ‘mirror’ motor_ROI was computed for the contralateral hemisphere that was not stimulated. Paired t-test analysis was run on the motor_ROI CBF for sham/anodal and sham/cathodal conditions. CBF ASL values for gray matter (GM volume > 70%) are reported. Percent change in CBF images (ΔCBF) were computed as: (CBFtDCS - CBFsham)*100/CBFsham, with CBFtDCS denoting either anodal or cathodal tDCS.
RESULTS
The motor_ROI values for each participant and condition are shown in Fig.1. The average ΔCBF in the stimulated region was 14.6 ± 7.2 % and -8.8 ± 4.2 % for anodal and cathodal tDCS stimulation, respectively, (p < 0.008). Baseline (sham) and 'raw' ΔCBF images for both anodal and cathodal applications are shown in Fig.2. For the baseline(sham) CBF images, there was no significant difference in the motor_ROI across sessions and participants (mean 4.1 ± 2.8 %, p = 0.3). Results from the analysis of the test-retest experiment are shown in Fig.3.SUMMARY
We used ASL MRI to measure short-term (~25min) changes in CBF following a 20-min application of tDCS. Results showed there was a positive/negative change in CBF in the stimulated region when an anodal/cathodal tDCS current was applied, boding well with the literature findings of an increase/decrease in neuronal firing during anodal/cathodal surface current application. More research is needed to address the study’s limitations, including potentially low statistical power, variability in electrode position, and effects of stimulation parameters on the observed results. Investigating the relationship between tDCS and neuroimaging markers may lead to a better understanding of the neuroplastic phenomena associated with tDCS and provide insight for tailored clinical applications.Acknowledgements
No acknowledgement found.References
1L J Bindman et al., J. Physiol. (1964); 2G Schlaug et al., Arch Neurol (2008); 3D Bennabi & E Haffen, Brain Sci. (2018); 4Y H Kwon & M H Ko, Neurosci Lett., (2008); 5X Zheng et al., NeuroImaging, (2011); 6I Asllani et al., MRM (2009).Figures
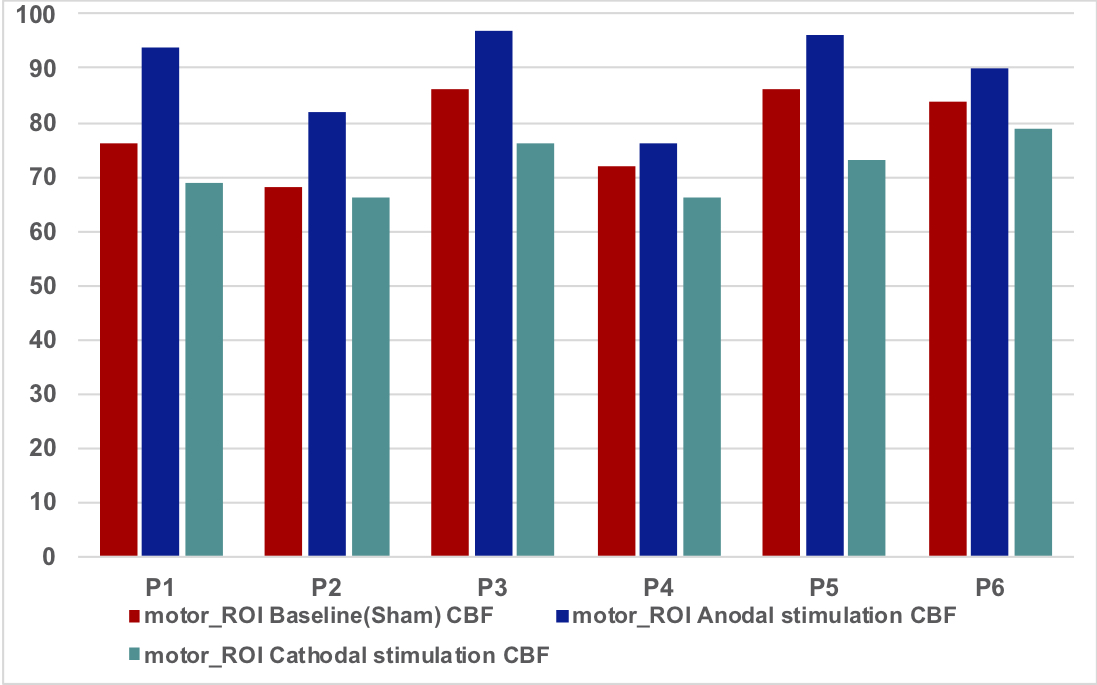
GM CBF measured in the motor_ROI for all conditions and participants.
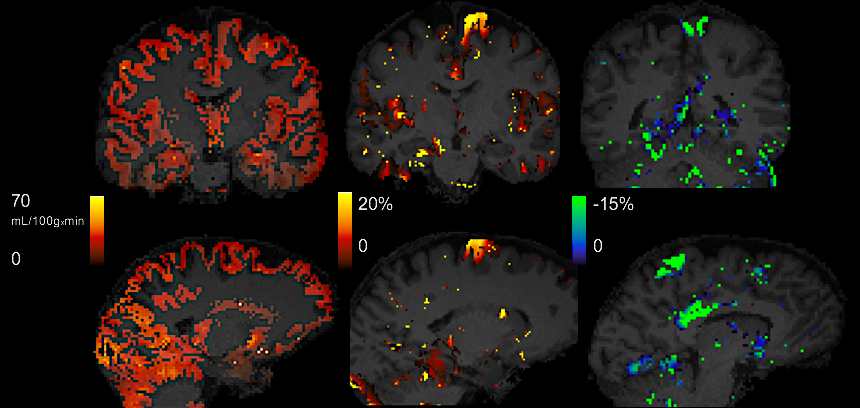
Partial volume corrected baseline GM CBF (left), anodal ΔCBF (middle), and cathodal ΔCBF (left) from a randomly selected participant. Note that the ΔCBF images shown are 'raw', i.e., no statistical thresholding or additional masking was done on the images.
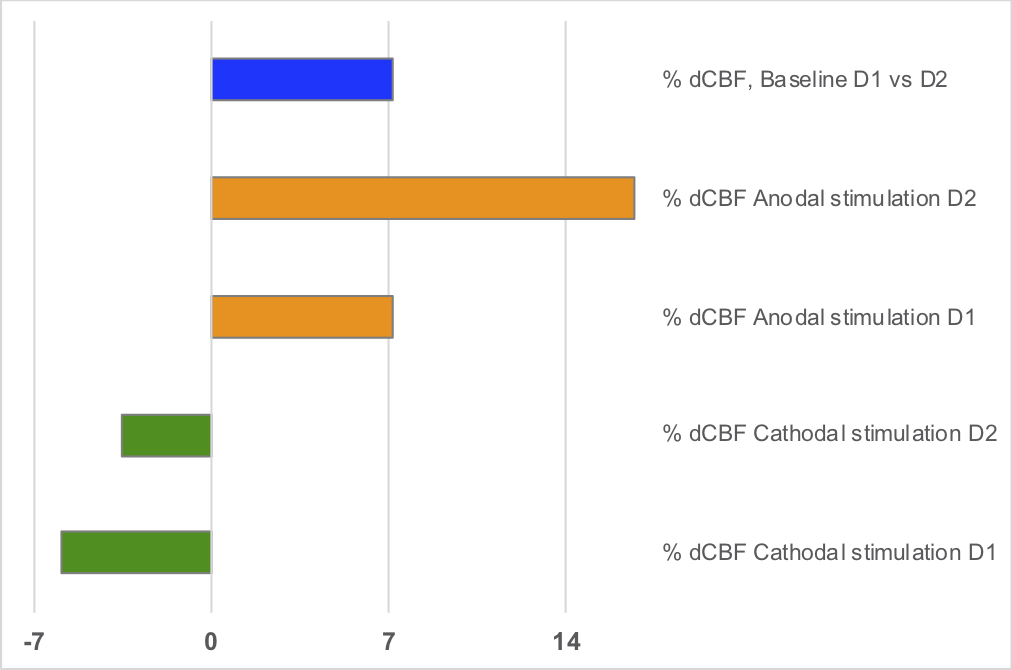
ΔCBF computed on two different days, D1 and D2, 4 months apart acquired on one of the subjects.