0540
Real-Time EPI Phase Contrast Acquisition for Imaging of CSF Dynamics1Radiology, Mayo Clinic, Rochester, MN, United States, 2Philips Healthcare, Gainesville, FL, United States
Synopsis
CSF flow has been most commonly evaluated using a gated 2D phase contrast (PC) acquisition at the cerebral aqueduct or foramen magnum. However, real-time acquisitions that allow for evaluation of changes in flow with the cardiac and respiratory may provide additional insight into CSF dynamics disorders. In this study we apply a real-time EPI based PC acquisition for imaging of intracranial CSF flow at multiple intracranial locations. Quantitative analyses are validated by comparison with a standard phase contrast acquisition. Frequency spectra analysis demonstrates dominant variations in CSF flow with the cardiac and respiratory cycles.
Introduction
CSF dynamics disorders have become more widely recognized as contributors to neurologic diseases such as normal pressure hydrocephalus, supported by prior studies showing elevated flow through the cerebral aqueduct in these patients1–4. These prior studies most commonly implemented cardiac-gated 2D sequences at a single location such as the cerebral aqueduct or foramen magnum. However, it has been shown that CSF flow varies with the cardiac and respiratory cycles, and real-time (non-gated) acquisitions are necessary to detect these variations5,6. Challenges in using a real-time acquisition include obtaining adequate temporal and spatial resolution as well as accurate phase information. We hypothesize that an echo-planar imaging (EPI) based phase contrast (PC) acquisition may be applied for real-time imaging of CSF flow and analysis of variations in CSF flow with the cardiac and respiratory cycles. Additionally, analysis of CSF flow at multiple intracranial locations, beyond the foramen magnum and cerebral aqueduct, may provide useful information in evaluation of overall intracranial CSF dynamics. This is particularly germane in the context of extra ventricular CSF dynamics disorders. The goals of this work are to (i) apply a real-time 2D EPI PC acquisition for quantification of CSF flow, (ii) compare flow quantification via the EPI-based acquisition with that of a standard clinical gated acquisition, and (iii) demonstrate the ability to detect changes in CSF flow with the cardiac and respiratory cycles at multiple intracranial locations.Material and Methods
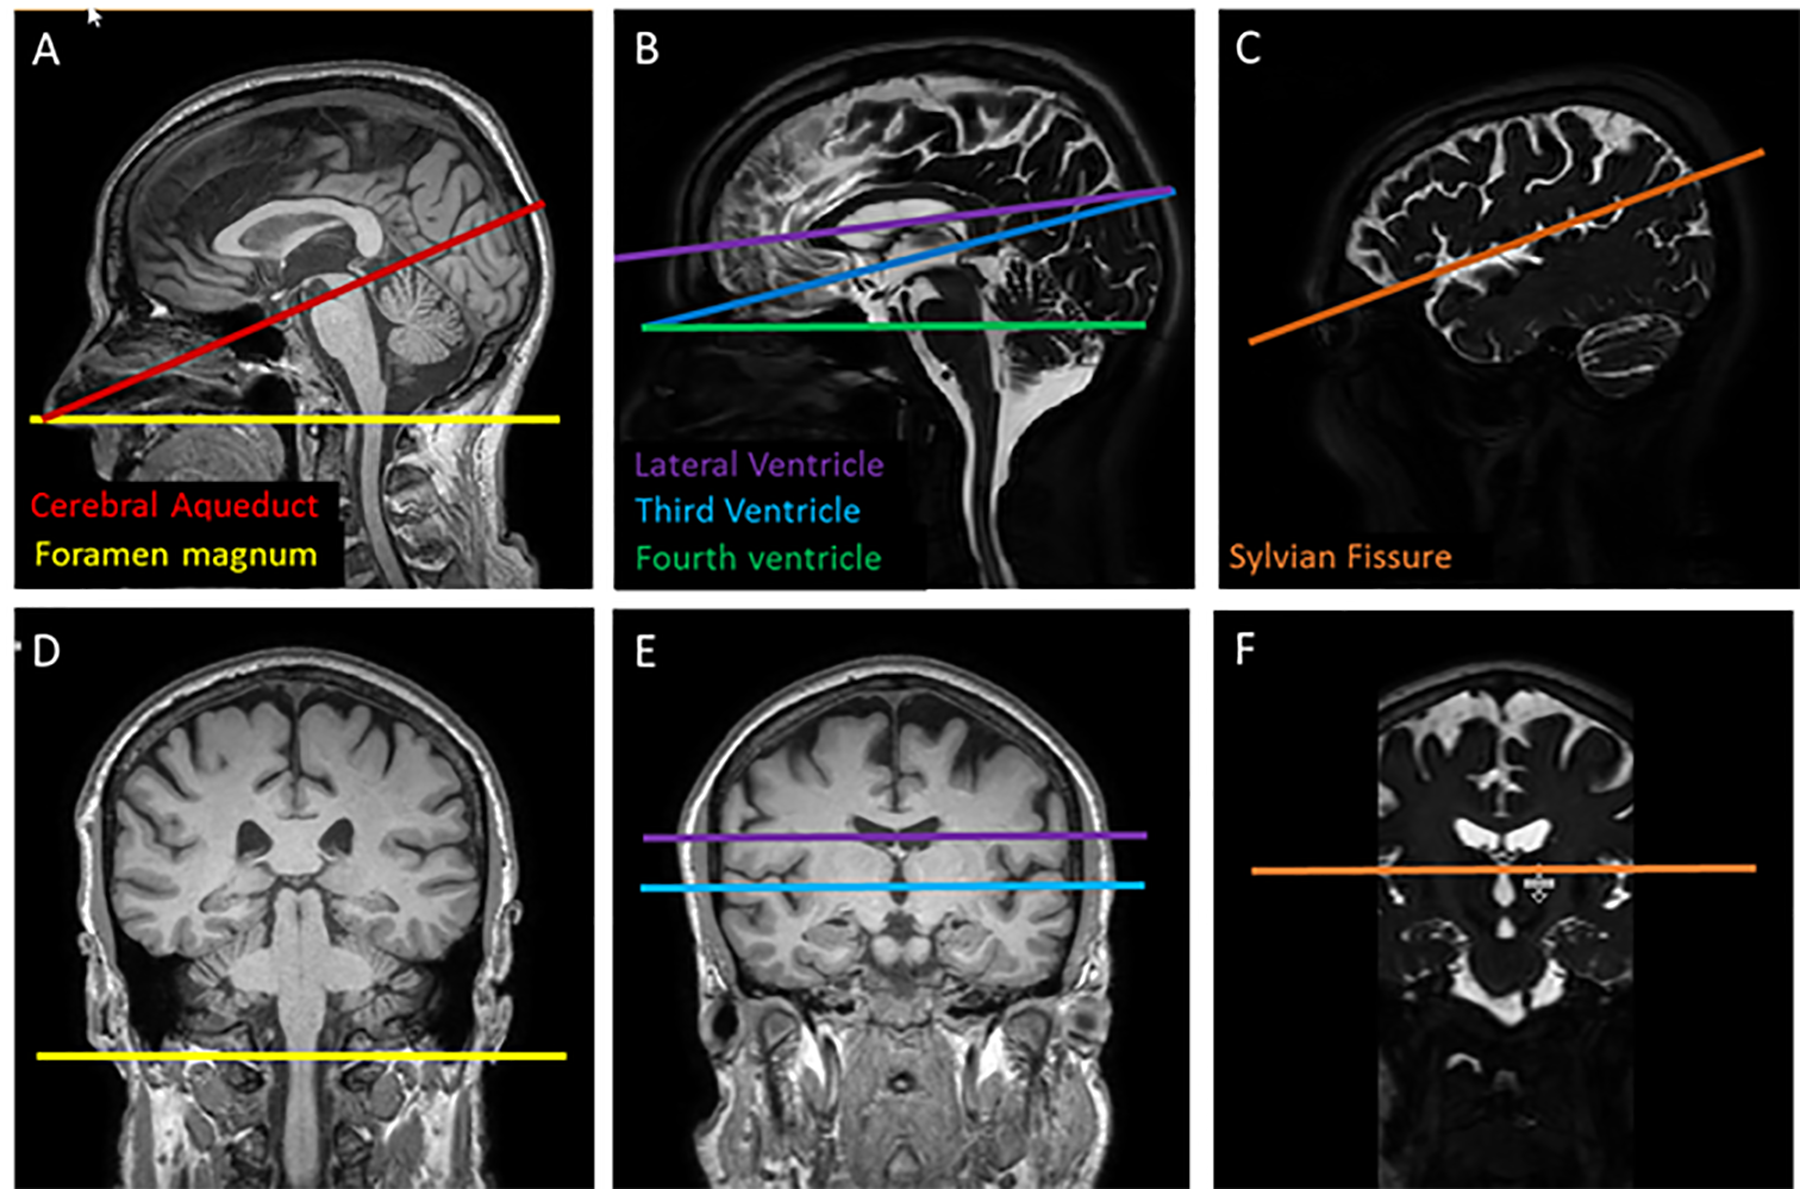
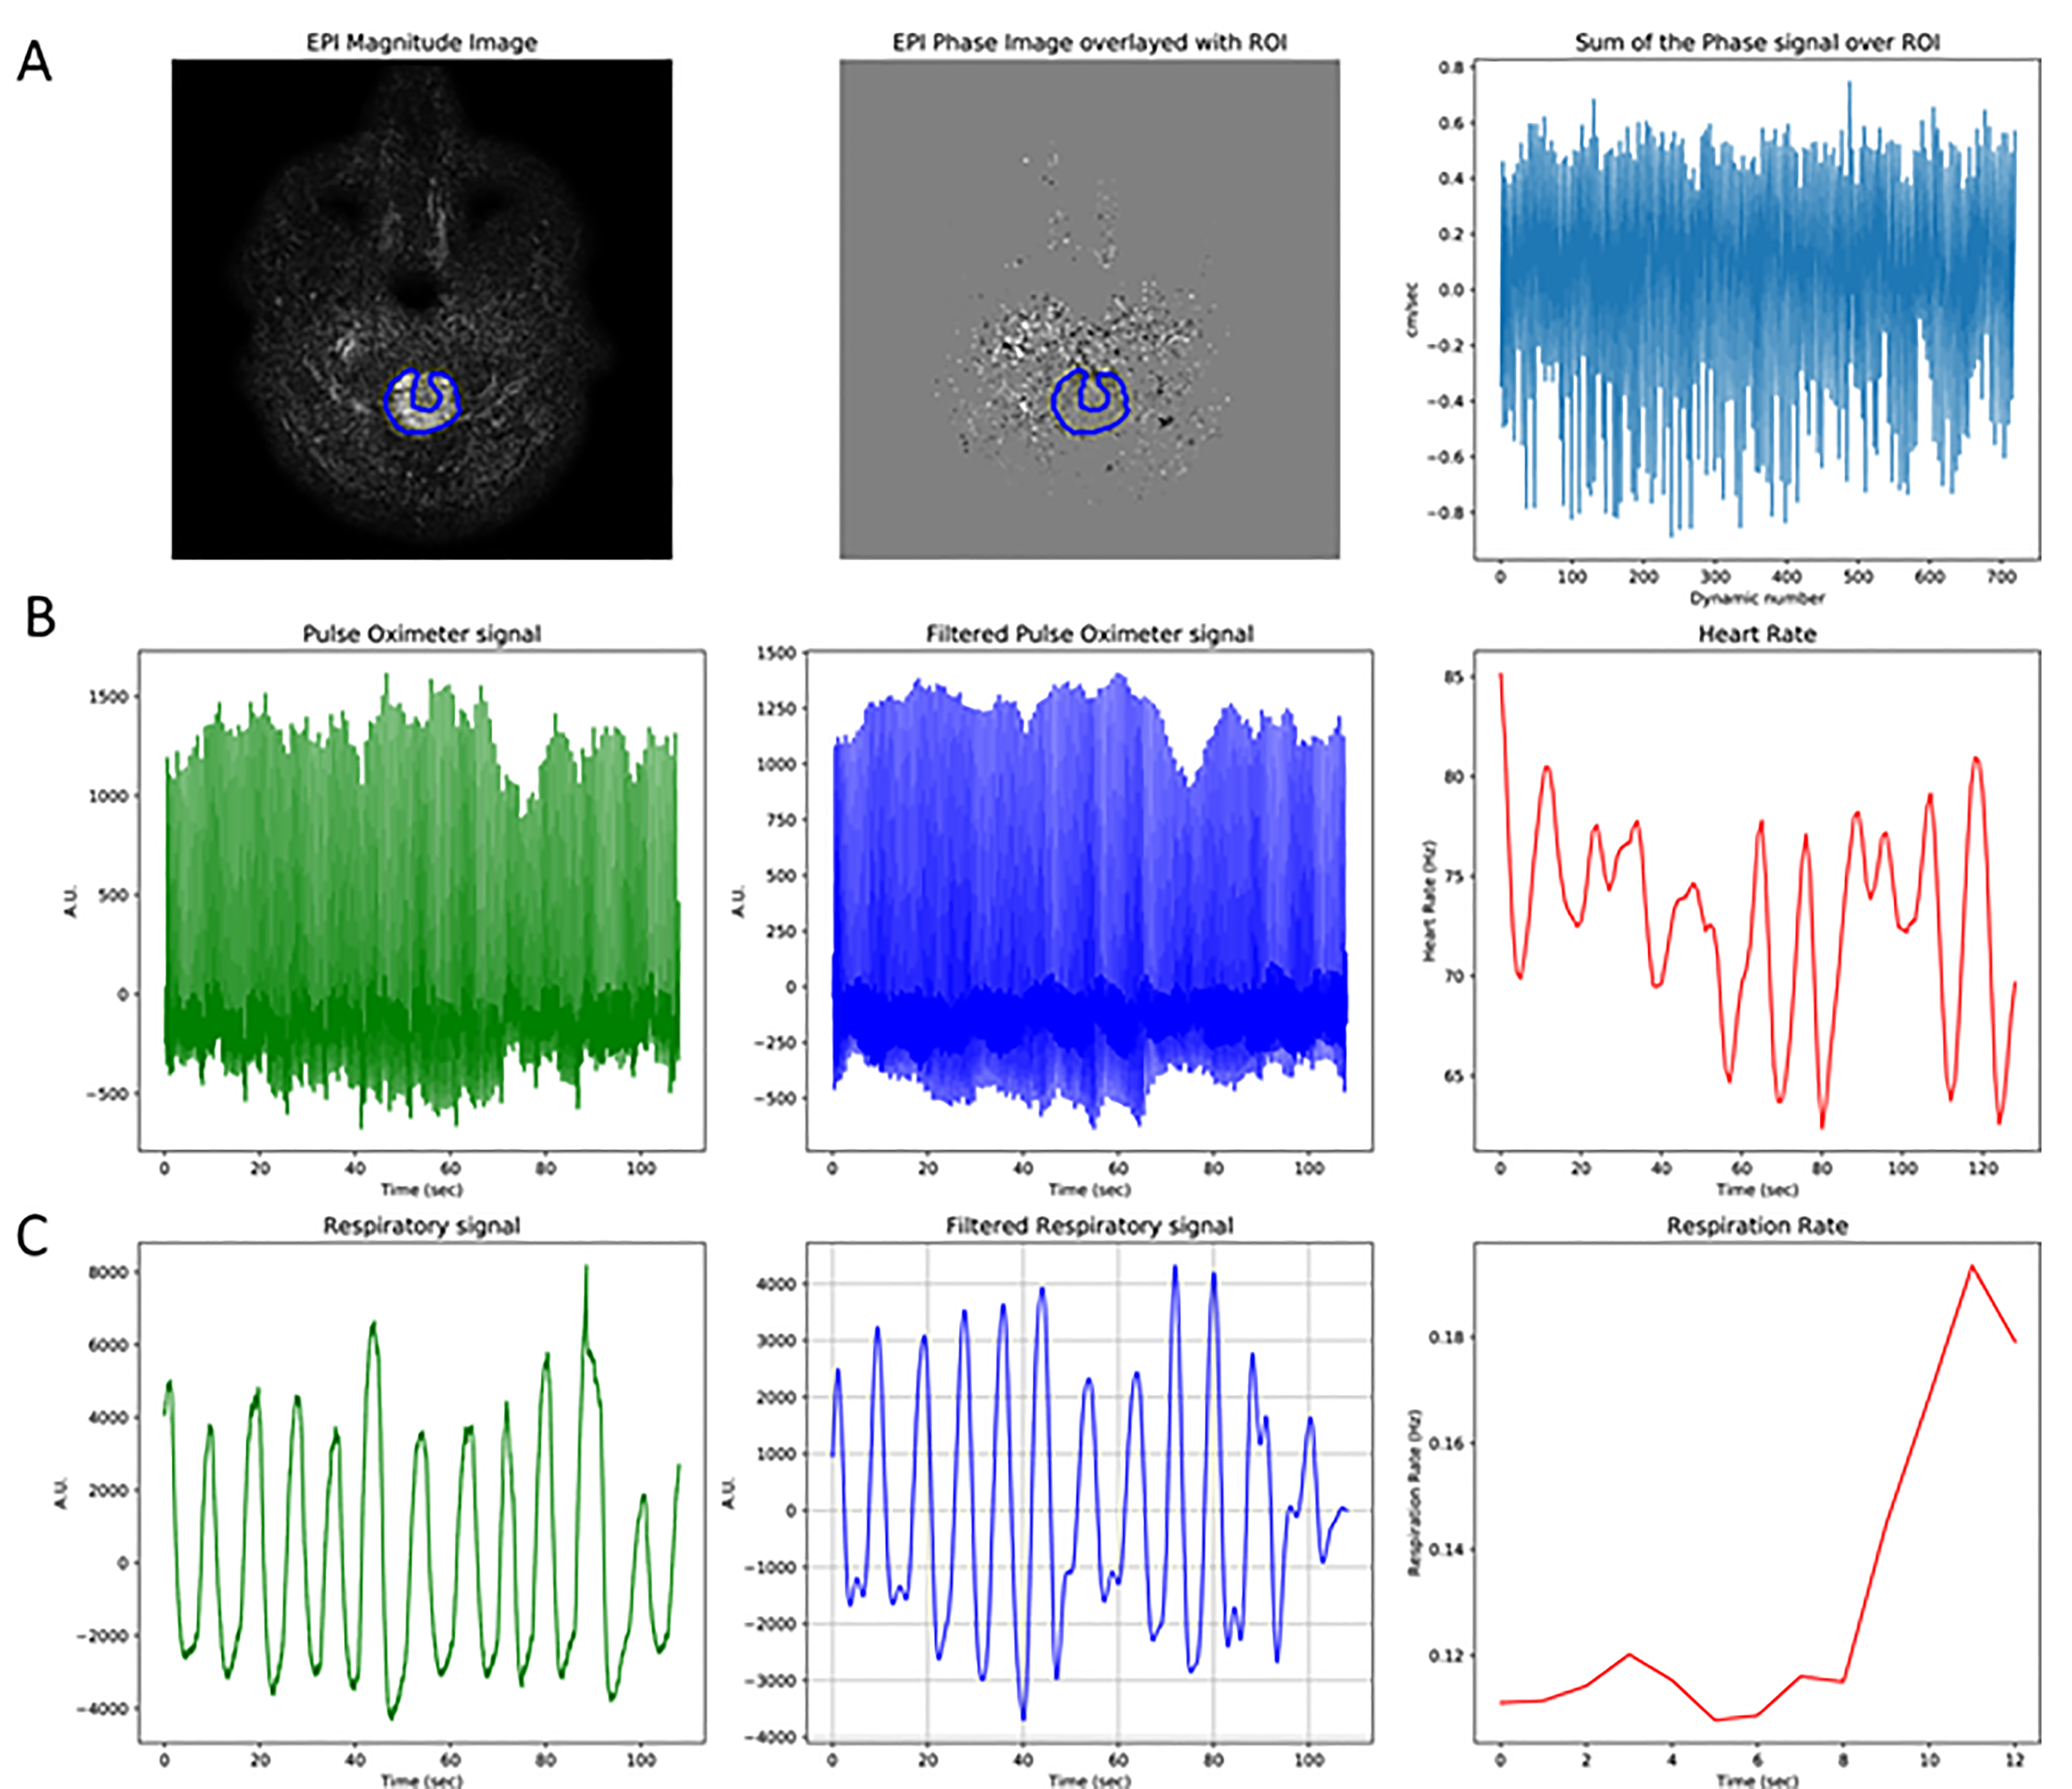
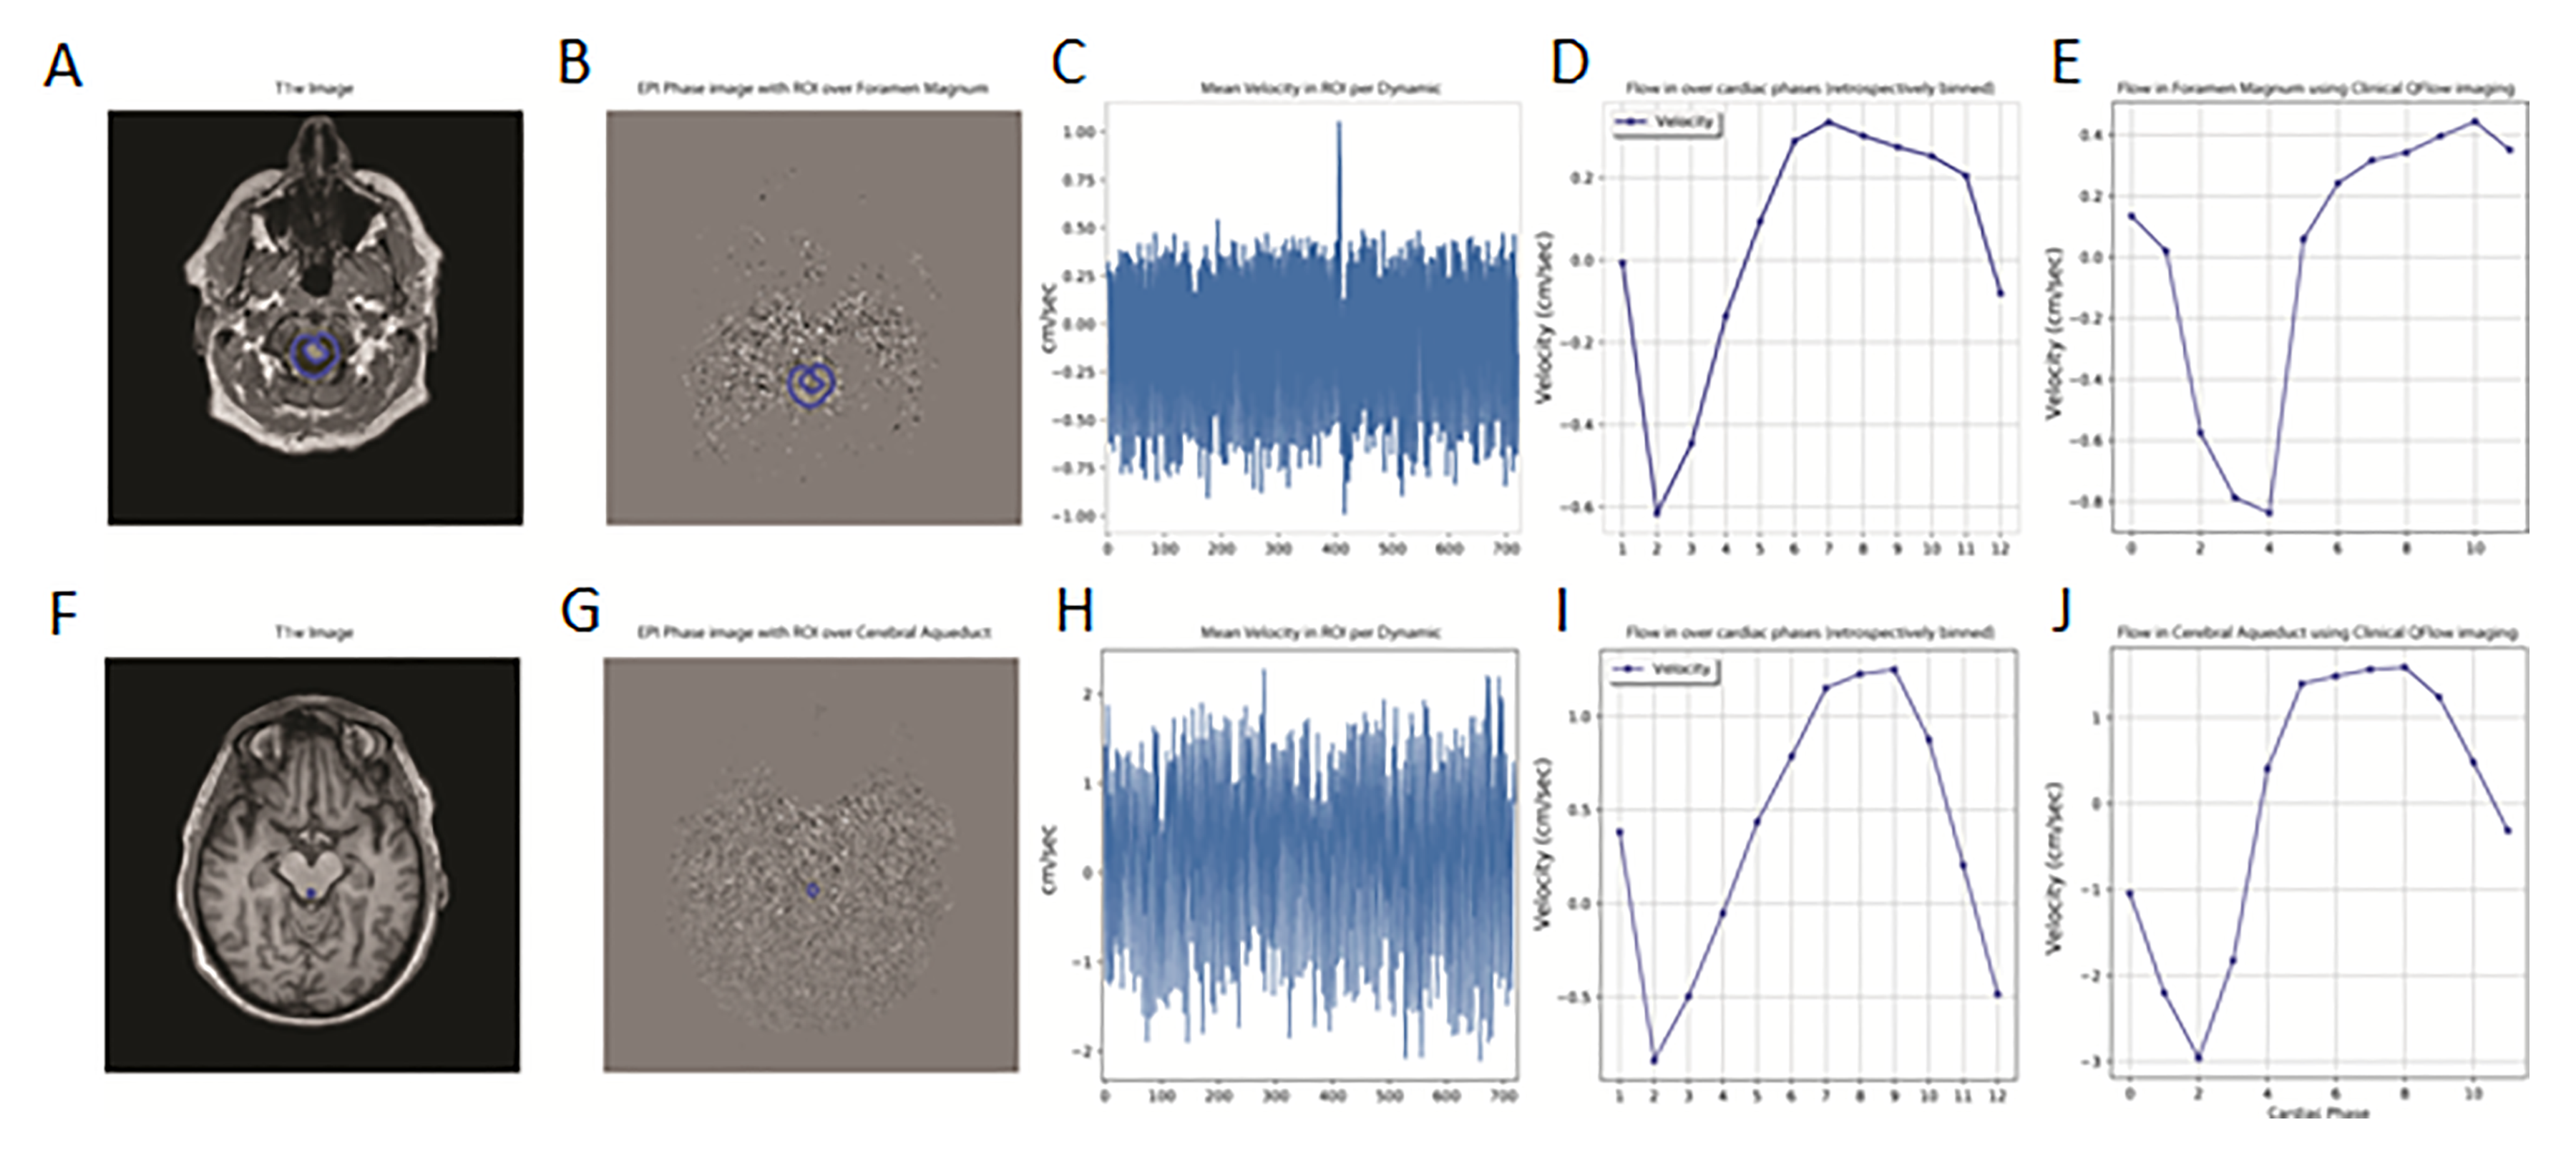
Four healthy participants were imaged (2 female, age 49±17 years mean±standard deviation, range 29-69 years). Imaging was performed at 3T (Philips Healthcare, Gainesville, Florida, USA) using a 16-channel head coil. First, 3D MPRAGE and highly T2-weighted imaging was performed and used for planning of the phase contrast acquisitions (Figure 1). CSF flow imaging was performed using a 2D EPI-based PC acquisition: TR/TE 81/39 ms, flip angle 15 degrees, FOV 217 x 217 mm2, matrix 172 x 169, spatial resolution 1.26 x 1.28 mm2, slice thickness 3 mm, temporal resolution 0.15 s, SENSE(Ry = 3), scan time 1:48 min:s. Flow encoding was performed in the craniocaudal direction, and the VENC was selected based on anticipated velocities specific to each imaging location: foramen magnum 5 cm/s, cerebral aqueduct 10 cm/s, fourth ventricle 5 cm/s, third ventricle 5 cm/s, lateral ventricles 5 cm/s, and sylvian fissures 1 cm/s. At each location, the slice was oriented perpendicular to the expected direction of craniocaudal flow. This experimental sequence was compared with a standard, clinically available, retrospectively gated phase contrast acquisition that was modified to have spatial resolution equivalent to that of the real-time EPI acquisition; the acquisition time for the gated sequence was 2:51 min:s for reconstruction of 12 cardiac phases. The EPI PC and standard PC acquisitions were performed at the foramen magnum and cerebral aqueduct in all participants and the EPI PC acquisition at the additional four locations in two of the participants. Pulse oximetry and respiratory belt information was recorded for each scan. The cardiac and respiratory data were filtered for analyses. ROI’s were manually drawn in the CSF space of interest, phase plotted versus time, and frequency spectra analysis performed. To validate our analyses, the real-time data was retrospectively binned into 12 phases of the cardiac cycle, and flow measures were compared with the vendor provided analysis of the standard gated sequence.Results
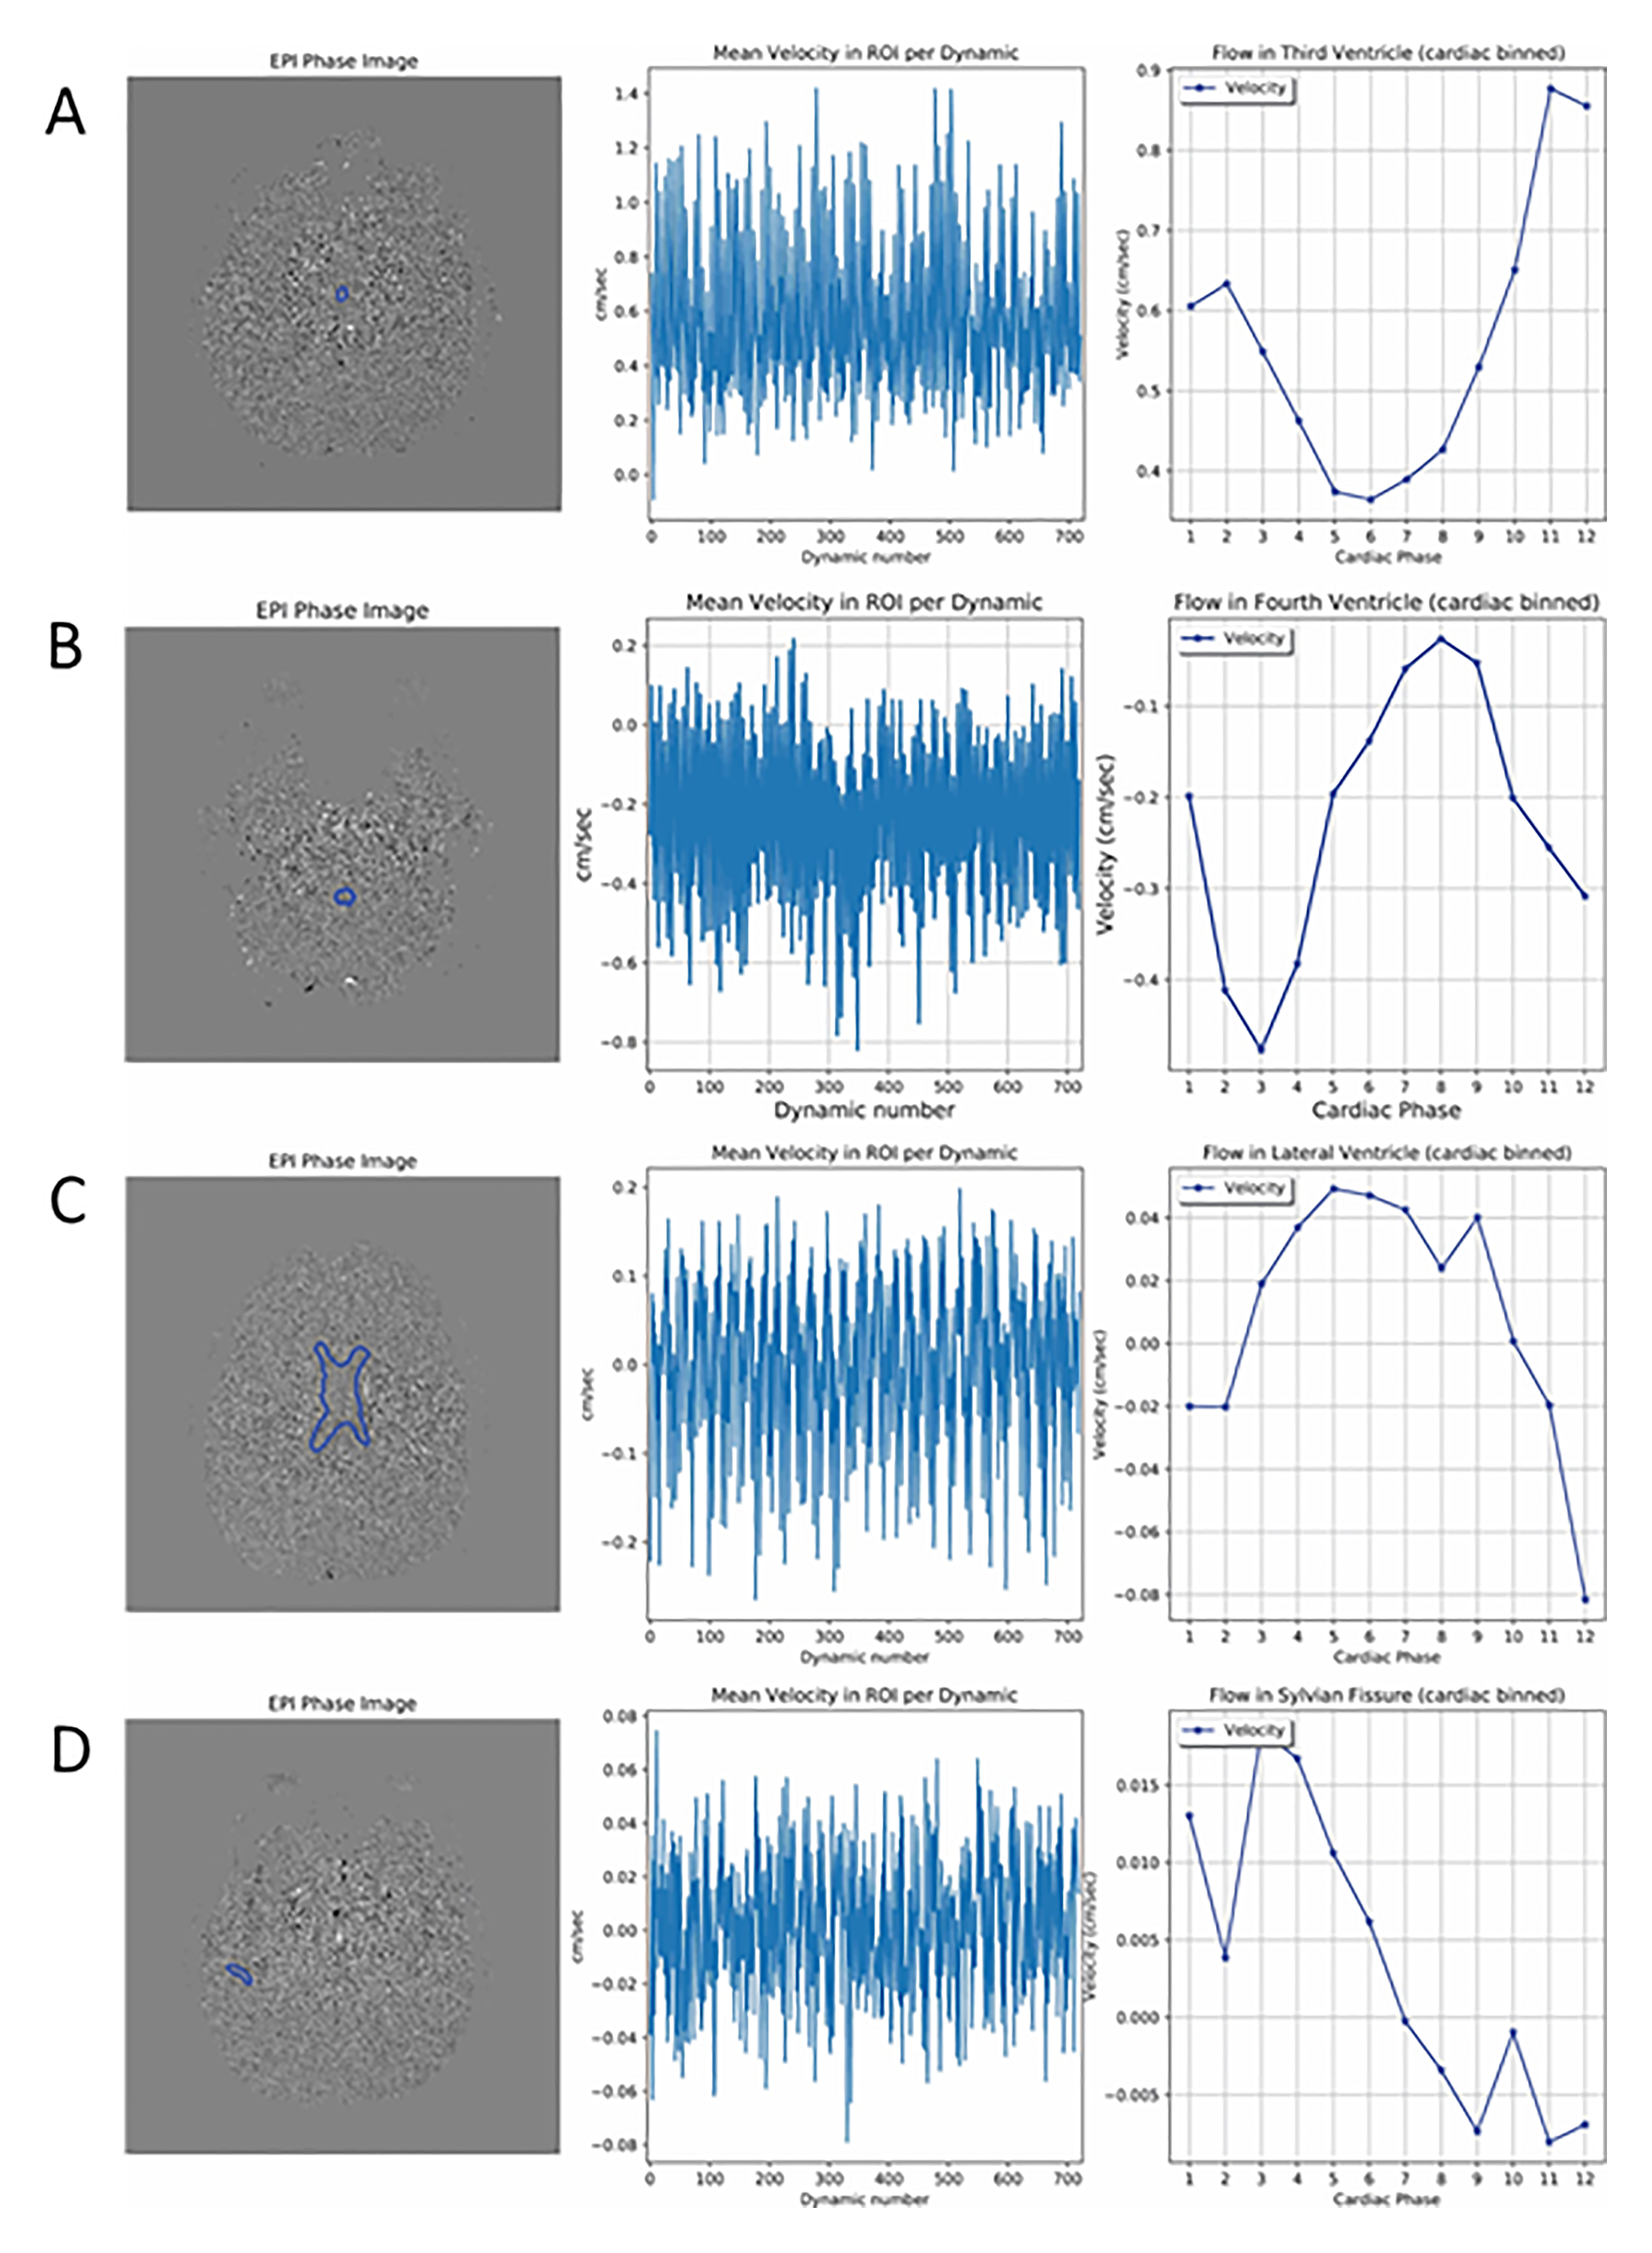
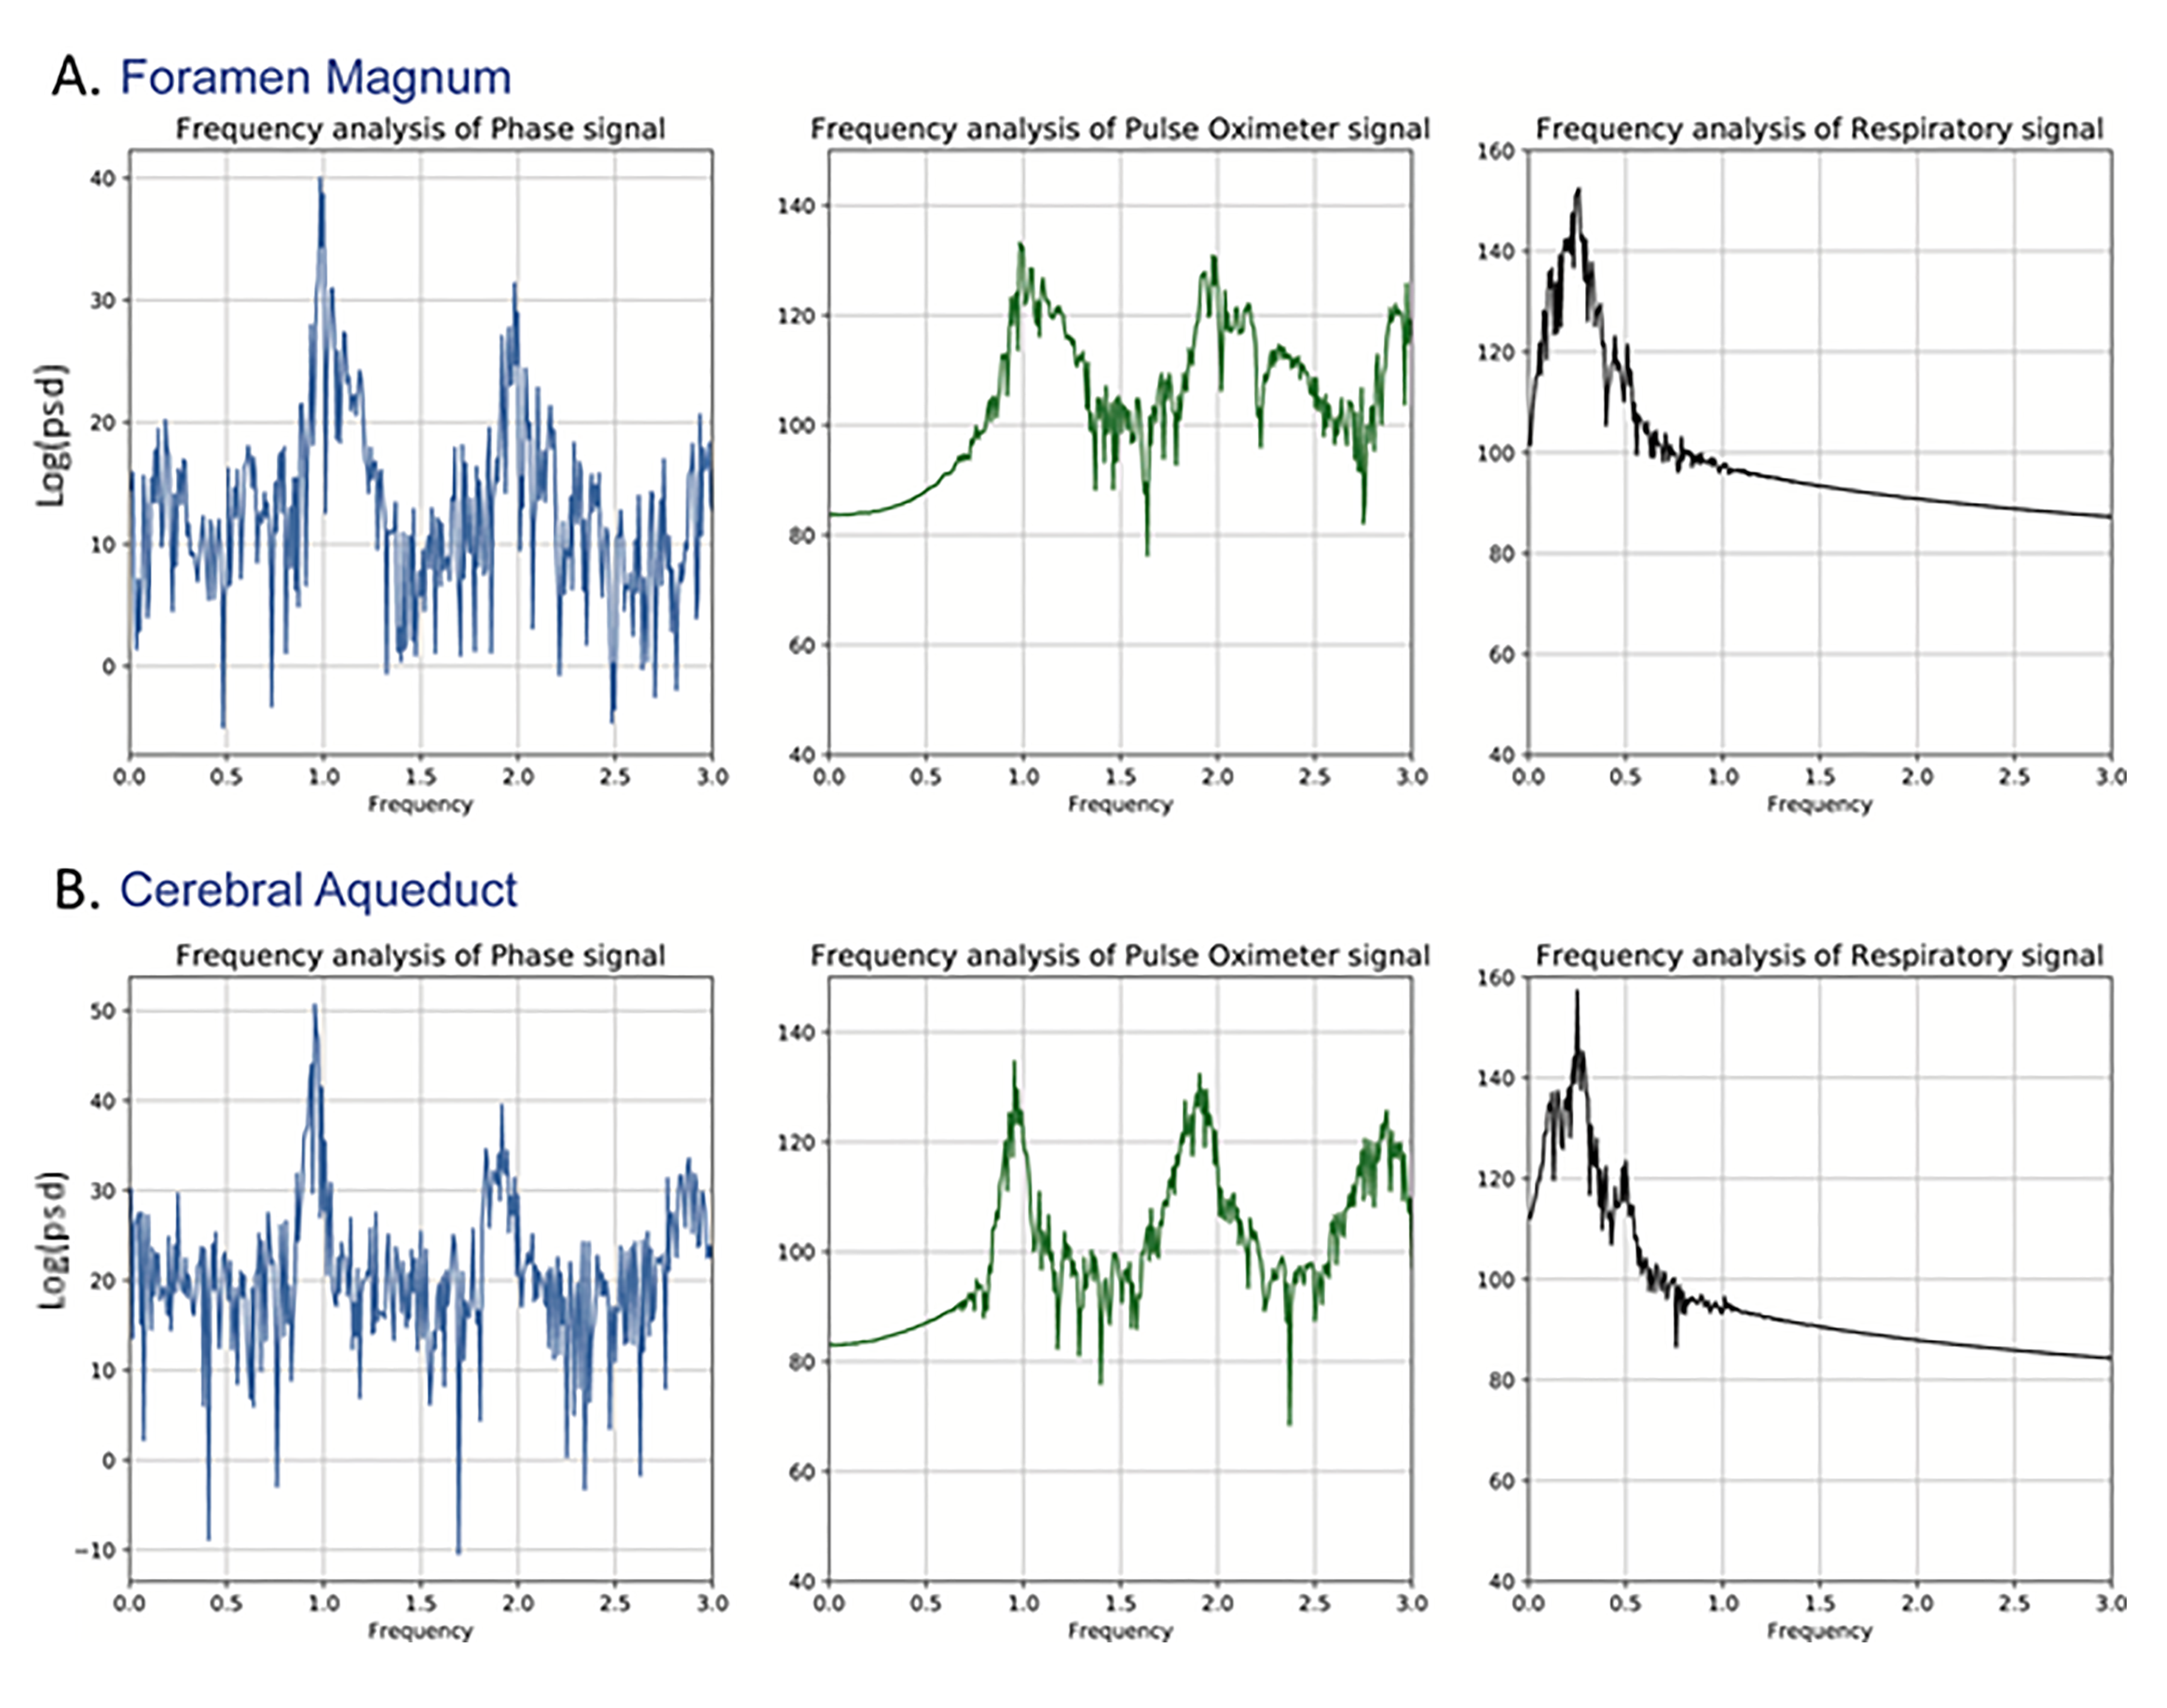
Physiologic traces of the heart and respiratory rates were obtained from the recorded pulse oximeter and respiratory belt signals (Figure 2). Steps in analyses of the CSF flow, including ROI selection as well as plots of ROI phase signal vs time and velocity vs cardiac phase are shown in Figure 3 for the foramen magnum and cerebral aqueduct. Sinusoidal flow with the cardiac cycle was observed at both of these locations, corresponding with results obtained via vendor analysis of the standard gated sequences. Sinusoidal flow with the cardiac cycle was similarly observed in the additional ROIs (Figure 4), though variable among participants in the lateral and third ventricles. Frequency spectra analysis of CSF phase at all locations showed high amplitude peaks corresponding with the frequencies of the cardiac cycle and generally a lower amplitude peak corresponding with the frequency of the respiratory cycle (Figure 5).Discussion and Conclusions
In this work we demonstrate application of a real-time 2D EPI PC acquisition for measurement of CSF flow at multiple intracranial locations and illustrate variations in CSF flow with the cardiac and respiratory cycles. CSF velocities and sinusoidal variation with the cardiac cycle obtained with the proposed real-time EPI PC acquisition were validated via comparison with a standard gated acquisition. The real-time acquisition allowed frequency spectra analyses, which demonstrated variations in CSF flow with the cardiac cycle and to a lesser extent the respiratory cycle in the foramen magnum and cerebral aqueduct, as observed in prior studies, with similar variations in CSF flow also observed at the additional studied intracranial locations. CSF velocity profiles and changes with the cardiac and respiratory cycle among intracranial locations will be better evaluated as we continue to image more participants. We propose that these techniques may be applied to evaluate intra- and extra-ventricular intracranial CSF flow in patients with possible CSF dynamics disorders and provide additional insight into disease patterns.Acknowledgements
This study was performed in collaboration with Philips Healthcare.References
1. Luetmer PH, Huston J, Friedman JA, et al. Measurement of cerebrospinal fluid flow at the cerebral aqueduct by use of phase-contrast magnetic resonance imaging: technique validation and utility in diagnosing idiopathic normal pressure hydrocephalus. Neurosurgery 2002;50:534-543; discussion 543-544.
2. Bradley WG, Scalzo D, Queralt J, et al. Normal-pressure hydrocephalus: evaluation with cerebrospinal fluid flow measurements at MR imaging. Radiology 1996;198:523–9.
3. Yamada S, Ishikawa M, Yamamoto K. Optimal Diagnostic Indices for Idiopathic Normal Pressure Hydrocephalus Based on the 3D Quantitative Volumetric Analysis for the Cerebral Ventricle and Subarachnoid Space. Am J Neuroradiol https://doi.org/10.3174/ajnr.A4440.
4. Tawfik AM, Elsorogy L, Abdelghaffar R, et al. Phase-Contrast MRI CSF Flow Measurements for the Diagnosis of Normal-Pressure Hydrocephalus: Observer Agreement of Velocity Versus Volume Parameters. AJR Am J Roentgenol 2017;208:838–43.
5. Chen L, Beckett A, Verma A, et al. Dynamics of respiratory and cardiac CSF motion revealed with real-time simultaneous multi-slice EPI velocity phase contrast imaging. NeuroImage 2015;122:281–7. 6. Yildiz S, Thyagaraj S, Jin N, et al. Quantifying the influence of respiration and cardiac pulsations on cerebrospinal fluid dynamics using real-time phase-contrast MRI. J Magn Reson Imaging JMRI 2017;46:431–9.
Figures