0539
Three-Dimensional Simultaneous Quantitative T1-T2-T2* Mapping of Whole Brain (SQUMA): Sequence Design and In-vivo Feasibility
Huiyu Qiao1, Shuo Chen1, Dandan Yang1, Hualu Han1, Zihan Ning1, and Xihai Zhao1
1Tsinghua University School of Medicine, Beijing, China
1Tsinghua University School of Medicine, Beijing, China
Synopsis
The feasibility of T1, T2 and T2* in brain imaging and lesion quantification has been proved. However, studies about quantitative imaging seldom quantify T1, T2 and T2* together. This study proposed a three-dimensional (3D) simultaneous quantitative T1-T2-T2* mapping (SQUMA) for the whole brain. SQUMA sequence was composed of five dynamic scans using variable flip angles, variable T2 preparation duration and multi-echo acquisitions. SQUMA sequence showed excellent agreement with reference imaging in measuring T1, T2 and T2* values (R2=0.98, 0.84 and 0.90, respectively) and good to excellent repeatability in in-vivo studies. It is feasible to use SQUMA in clinical applications.
Introduction
Quantitative magnetic resonance imaging (MRI) has become an important technique in segmentation and classification of abnormal tissue.1 Many multi-parametric quantitative MRI approaches such as DESPOT2, MR fingerprinting3 and STAGE4 have been developed for brain tissue quantitative mapping. However, these imaging methods usually generated T1 and T2 or T1 and T2* mapping due to the different requirement of gradient field between T2 and T2* mapping and seldom quantified T1, T2 and T2* mapping together. In this study, we proposed a three-dimensional (3D) simultaneous quantitative T1-T2-T2* mapping (SQUMA) for the whole brain and determined its feasibility in in-vivo imaging.Methods
MRI sequence design: The proposed 3D SQUMA sequence for whole brain was based on radiofrequency (RF)-spoiled 3D gradient echo acquisition (Figure 1). 3D SQUMA was composed of five dynamic scans with 5 seconds interval to ensure the recovery of magnetization. Compressed sensing and sensitivity encoding reconstruction (CS-SENSE) were used to accelerate the imaging. The SQUMA sequence was performed within 9 minutes on a 3.0 Tesla MR scanner (Ingenia, Philips Healthcare, Best, the Netherlands) with a 32-channel head coil. The imaging parameters were detailed in Table 1. T1-T2-T2* fitting: If the shot interval of RF-spoiled field echo was set as the shortest one, steady-state transverse magnetization would be obtained. The pseudo steady-state signal of the first four dynamic scans was given by: $$ Signal=M_{0}\frac{(1-E_{1})sin\alpha}{(1-E_{1}cos\alpha)}e^{-\frac{T2_{prep}}{T2}}, E_{1}=e^{-\frac{TR}{T1}} (1) $$ The signal of final dynamic scan could be presented as following according to Bloch equation: $$ Signal=M_{0}e^{-\frac{TE}{T2}}, TE=5,10,15,20 ms (2) $$ T2 and T2* could be estimated using nonlinear least square method for the exponential fitting. T1 mapping was acquired based on linear least square method.5 B1 correction: The T1 calculation of two variable flip angles depends on the local flip angle, which is related to the B1 field. To obtain the actual flip angle, an additional B1 mapping scan (Table 1) was performed and resampled with spline interpolation. The actual flip angle of each pixel would be used in the estimation of T1 mapping. Phantom experiments: Phantoms were constructed using previously described methods.6 The reference T1, T2 and T2* mapping were determined by inversion recovery (IR) spin echo sequence with different IR time (100:100:1000, 1500:500:30000 ms, TR/TE = 10000/9.3 ms), multi-echo spin echo sequence (TR/TE = 10000/9.5:9.5:76 ms) and gradient echo with 25 echoes (TR/TE = 10000/2.6:4.12:101.5 ms, flip angle = 90°), respectively. The proposed SQUMA sequence was also scanned in phantom. Volunteer experiments: The proposed SQUMA sequence was scanned on five health subjects and one patient. For the evaluation of repeatability of the sequence, two of health subjects were scanned twice within three days. Each subject signed the written informed consent. Data analysis: T1, T2 and T2* mapping of phantom and in-vivo subjects were fitted using Matlab 2019a (MathWorks, Inc. Natick, Massachusetts, USA). The grey matter (GM) and white matter (WM) of brain were extracted using SPM toolbox (Wellcome Trust, England) based on the T1-weighted images which were obtained by second dynamic scan. The T1 and T2 values of GM and WM for each health subjects were recorded. Statistical analysis: Linear correlation analysis was used to evaluate the agreement of quantitative mapping based on proposed 3D SQUMA sequence and reference methods. The repeatability of slice-averaged T1 and T2 estimation was evaluated using intraclass correlation coefficient (ICC).Results
Phantom measurements: In phantom imaging, excellent agreement was found in the values of T1 with B1 correction (R2 = 0.98), T2 (R2 = 0.84) and T2* (R2 = 0.90) between 3D SQUMA sequence and reference imaging (Figure 2-3). In-vivo measurements: In the whole brain imaging of five health subjects (mean age, 23.3 ± 1.1 years; 3 males), the T1 and T2 values of GM and WM were 1654.2 ± 43.7 ms and 1098.0 ± 17.8 ms, and 58.6 ± 0.9 ms and 53.9 ± 0.7 ms, respectively. All the values were obtained based on the first scan of five subjects. Altered T1, T2 and T2* values could be revealed by the patient data (Figure 4). Repeatability assessments: Good to excellent agreements were found between two scans of the two health subjects in measuring T1 values of GM (ICC: 0.96, 95% confidence interval (CI): 0.95-0.97) and WM (ICC: 0.87, 95% CI: 0.83-0.91), and T2 values of GM (ICC: 0.80, 95% CI: 0.73-0.85) and WM (ICC: 0.72, 95% CI: 0.63-0.79) based on slice-averaged measurements.Discussion
In the present study, the agreement of T2 estimation between SQUMA and reference imaging was slightly lower than that of T1 and T2* estimation. This might be caused by the lack of imaging with shorter T2 preparation duration (<25 ms). In the future, we will modify the shape of current T2 preparation pulse to reach a shorter shortest T2 preparation duration in the third dynamic scan. In addition, the calculation of T2* mapping revealed the possibility to generate quantitative susceptibility mapping (QSM) using SQUMA sequence in the future. SQUMA sequence could also be used to generate proton density mapping and B1 field map according to the previous study.1Conclusion
The proposed 3D simultaneous quantitative T1-T2-T2* mapping (SQUMA) of whole brain is feasible through using variable flip angles, variable T2 preparation duration and multi-echo acquisitions in single sequence.Acknowledgements
NoneReferences
- Wang Y, Chen Y, Wu D, et al. STrategically Acquired Gradient Echo (STAGE) imaging, part II: Correcting for RF inhomogeneities in estimating T1 and proton density. Magn Reson Imaging. 2018;46:140-150.
- SCL Deoni, Peters TM, Rutt BK. High-resolution T1 and T2 mapping of the brain in a clinically acceptable time with DESPOT1 and DESPOT2. Magn Reson Med. 2005;53:237-241.
- Ma D, Gulani V, Seiberlich N, et al. Magnetic resonance fingerprinting. Nature. 2013;495:187–192.
- Chen Y, Liu S, Wang Y, et al. STrategically Acquired Gradient Echo (STAGE) imaging, part I: Creating enhanced T1 contrast and standardized susceptibility weighted imaging and quantitative susceptibility mapping. Magn Reson Imaging. 2018;46:130-139.
- Coolen BF, Poot DH, Liem MI, et al. Three-dimensional quantitative T1 and T2 mapping of the carotid artery: Sequence design and in vivo feasibility. Magn Reson Med. 2016;75:1008-1017.
- Ikemoto Y, Takao W, Yoshitomi K, et al. Development of a human-tissue-like phantom for 3.0-T MRI. Med Phys. 2011;38:6336-6342.
Figures
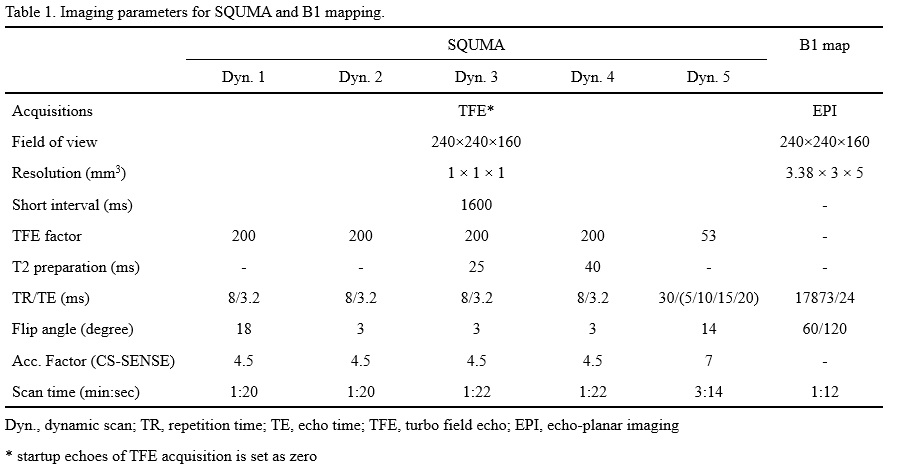
Table
1. Imaging parameters for SQUMA and B1 mapping.
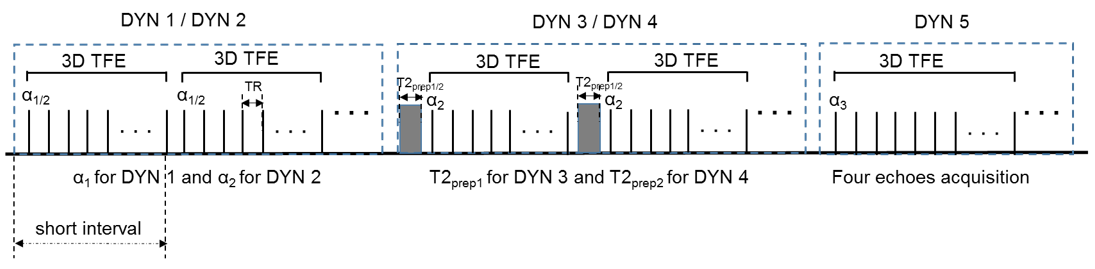
Figure 1. 3D
simultaneous quantitative T1-T2-T2* mapping (SQUMA) sequence. This sequence is
composed of five dynamic scans. Variable flip angles (α1 = 18◦,
α2 = 3◦) images from DYN 1 and DYN 2 can be used to
estimate T1 mapping. Variable T2 preparation duration (T2prep1 = 25 ms
and T2prep2 = 40 ms) images from DYN 2 (T2prep = 0 ms),
DYN 3 and DYN 4 can generate T2 mapping. The final dynamic scan provides T2*
mapping using multi-echo acquisition.
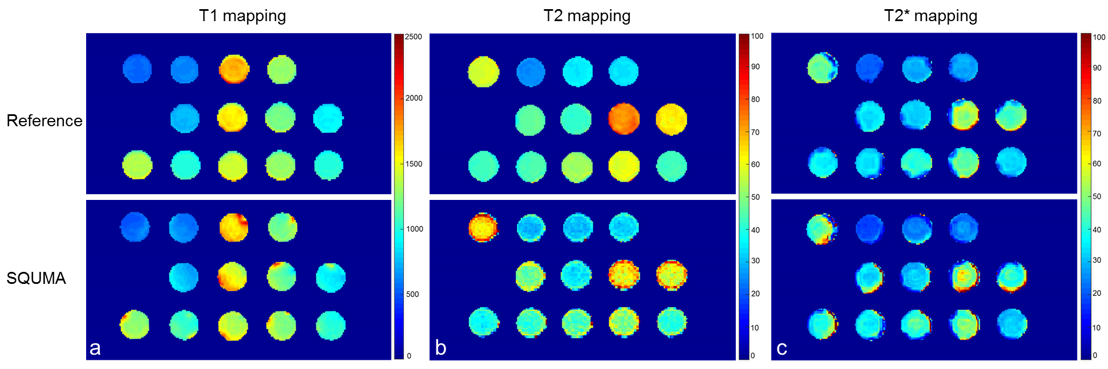
Figure 2. The
T1 mapping (a), T2 mapping (b) and T2* mapping (c) estimated by 2D reference
imaging (inversion recovery spin echo, multi-echo spin echo and multi-echo gradient
sequence) and 3D simultaneous quantitative T1-T2-T2* mapping (SQUMA) imaging.
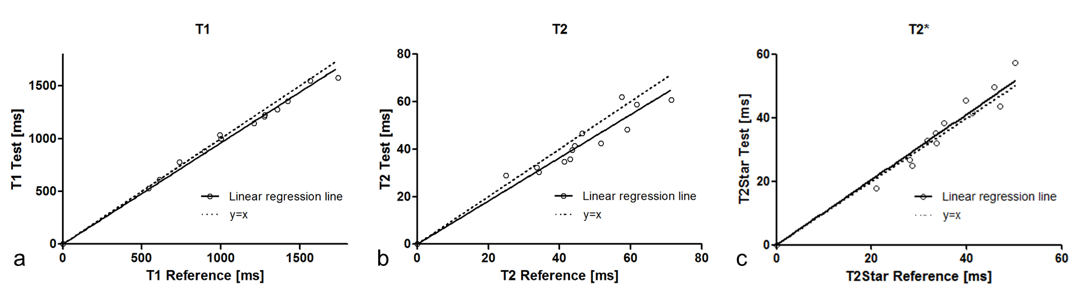
Figure 3. Correlation
of T1 (a), T2 (b) and T2* (c) measurements of phantoms between 2D reference
imaging (inversion recovery spin echo, multi-echo spin echo and multi-echo
gradient echo sequence) and 3D simultaneous quantitative T1-T2-T2* mapping
(SQUMA) imaging.
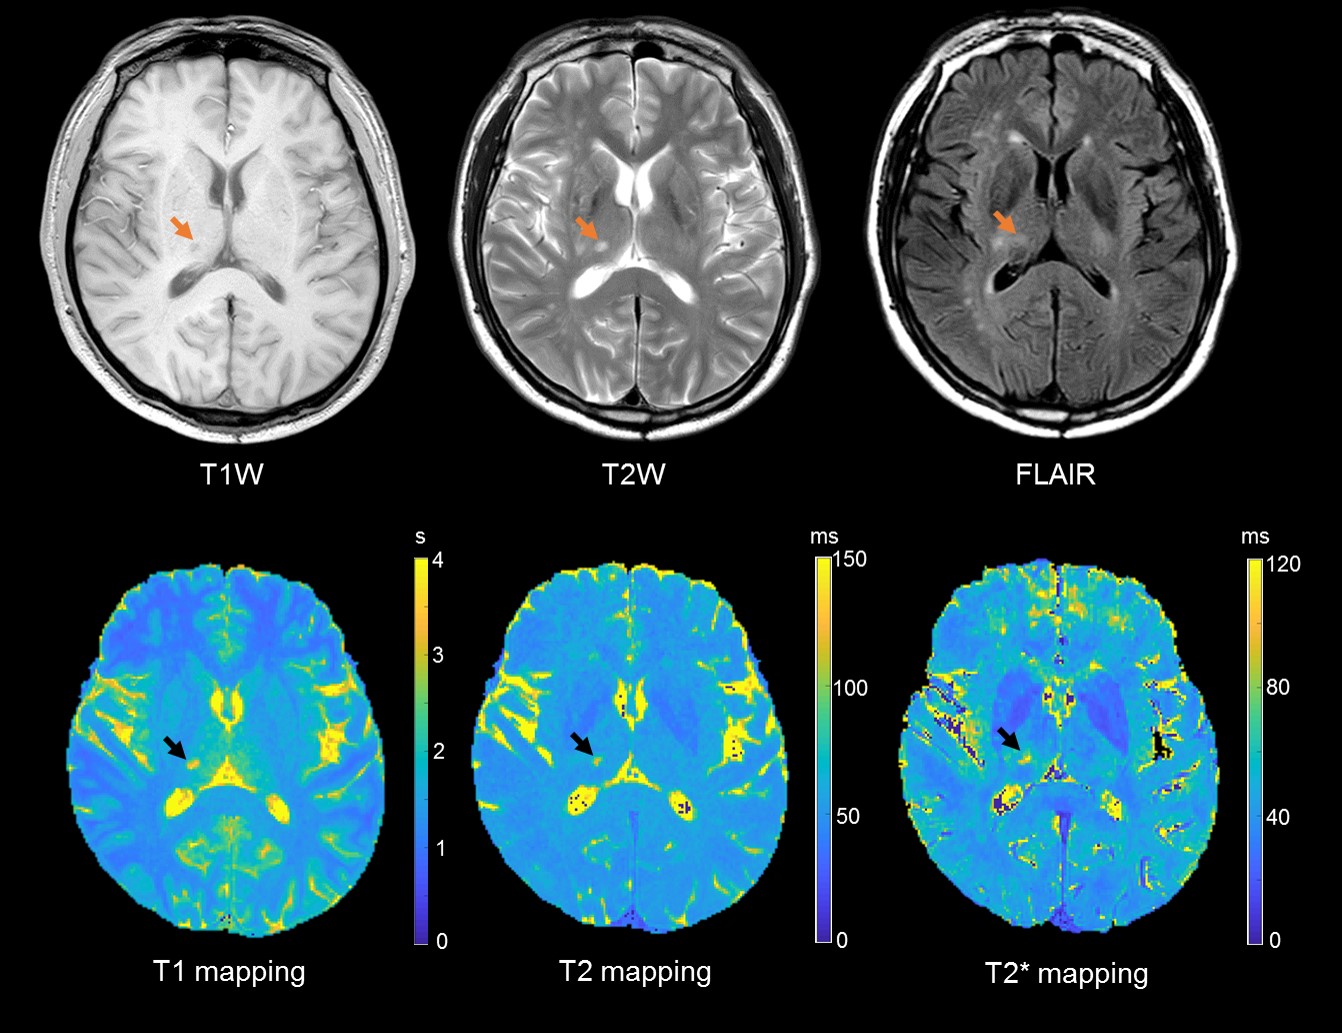
Figure 4. A
fifty-seven years old male patient with traditional and quantitative brain
imaging. The ischemic lesion (arrow) showed longer T1, T2 and T2* value.