0537
Multi b-value Diffusion weighted image Diphase Map (MbDDM) to evaluate cerebrospinal fluid dynamics.1Department of Innovative Biomedical Visualization, Nagoya University, Nagoya, Japan, 2Department of Radiology, Nagoya University, Nagoya, Japan
Synopsis
To visualize the dynamics of cerebrospinal fluid (CSF) motion within the cranium, we evaluated the distribution of the motion-related signal dephasing by CSF on a Multi b-value Diffusion-weighted image Diphase Map (MbDDM). The MbDDM indicated that CSF motion was prominent in areas that included the ventral portion of the posterior fossa, the suprasellar cistern and the Sylvian fissure. Whereas, CSF motion was less in the lateral ventricles and the parietal subarachnoid space, casting doubt on the classical model of CSF dynamics.
Purpose
Diffusion weighted imaging (DWI) visualizes the motion of water molecules as a signal decrease due to the phase shift caused by the motion. When the phase shift becomes larger than ±π or when several velocities exist in a single voxel, the signal decrease on DWI becomes prominent according to the b-values. Cerebrospinal fluid (CSF) motion causes a prominent signal decrease (signal drop) due to its large and/or non-uniform motion (Figure 1). We evaluated this motion-related signal dephasing caused by CSF on a Multi b-value Diffusion weighted image Diphase Map (MbDDM). The purpose of the current study was to visualize and evaluate the dynamics of CSF motion in the cranium using MbDDM.Subjects and Methods
The subjects of this study consisted of 20 cases aged from 15 to 87 years old. We acquired DWI on a 1.5T clinical scanner (MAGNETOM Avanto, Siemens) with the following parameters: TR=3500ms, TE=94ms, b-values = 0, 50, 100, 200, 300, 500, 700, 1000 s/mm2. We made color composite images in which the area of signal drop on the various b-value images was coded with colors (MbDDM: Figure 2). We evaluated the distribution of the CSF areas with decreased signal from motion dephasing (0: more than half of the area had signal drop on the b=50 s/mm2 image, 1: signal drop on the b=50 s/mm2 image was present, 2: same as above on the b=100 s/mm2 image, 3: on the b=200 s/mm2 image, 4: on the b=300 s/mm2 image, 5: on the b=500 s/mm2 image, 6: on the b=700 s/mm2 image, 7: on the b=1000 s/mm2 image, Figure 3). We used a Tukey test to compare the scores of the various areas statistically.Results
Figure 3 shows the score distribution over all areas evaluated by MbDDM, and Figure 4 shows the results of the statistical analysis (Tukey test) for the representative areas. These results indicate that the CSF in the ventral posterior fossa had greater movement (smaller scores) compared to other areas. The suprasellar cistern, ambient cistern and Sylvian vallecula also had greater CSF movement. However, the CSF within the lateral ventricle had less motion (larger scores). Also, the subarachnoid space of the parietal region had less motion. The scores in the third and fourth ventricles, and the interhemispheric cistern had a high degree of variability.Discussion
In diffusion imaging, moving water molecules have a phase shift according to the velocity and the length of the motion-probing gradient (1-3). However, when the phase shift becomes greater than ±π, the relationship between the phase and velocity is lost . In addition, when various velocities exist within a single voxel, the signal decrease becomes larger (the non-uniform flow effect). Thus, to map CSF dynamics by diffusion imaging at various b-values, we did not calculate the CSF velocity from the datasets of the signal intensity for different b-values, because the relationship between the velocity and the signal intensity may not be uniform. However, we mapped the areas with significant signal decrease due to motion-related signal dephasing for each b-value as shown above in the MbDDM.The purpose of the current study is to evaluate CSF dynamics using diffusion imaging. According to the classical theory of CSF dynamics, which was established in the early 20th century, CSF was thought to be produced by the choroid plexus in the ventricle. The CSF flows outside of the ventricular system into the subarachnoid space on the surface of the brain, and then subsequently is absorbed by the arachnoid granules. More recently, studies have cast doubt on this classical model of river-like CSF flow.
The results of the current study may contribute to the growing evidence against this classical model of CSF dynamics. The CSF motion in the trigone of the lateral ventricle, which is thought to be the location of CSF production by the classical model, had very little CSF motion. For the absorption, there was very little CSF motion in the subarachnoid space in the parietal or frontal areas, which are close to the arachnoid granules.
Conclusion
The MbDDM indicated that CSF motion was prominent in areas that included the ventral portion of the posterior fossa, suprasellar cistern and Sylvian fissure. Whereas, CSF motion was less in the lateral ventricles and the parietal subarachnoid space, casting doubt on the classical model of CSF dynamics.Acknowledgements
No acknowledgement found.References
1. Le Bihan D, Breton E, Lallemand D, Grenier P, Cabanis E, Laval-Jeantet M. MR imaging of intravoxel incoherent motions: application to diffusion and perfusion in neurologic disorders. Radiology 1986;161(2):401-407.
2. Le Bihan D, Breton E, Lallemand D, Aubin ML, Vignaud J, Laval-Jeantet M. Separation of diffusion and perfusion in intravoxel incoherent motion MR imaging. Radiology 1988;168(2):497-505.
3. Taoka T, Naganawa S, Kawai H, Nakane T, Murata K. Can low b value diffusion weighted imaging evaluate the character of cerebrospinal fluid dynamics? Jpn J Radiol 2019;37(2):135-144.
Figures
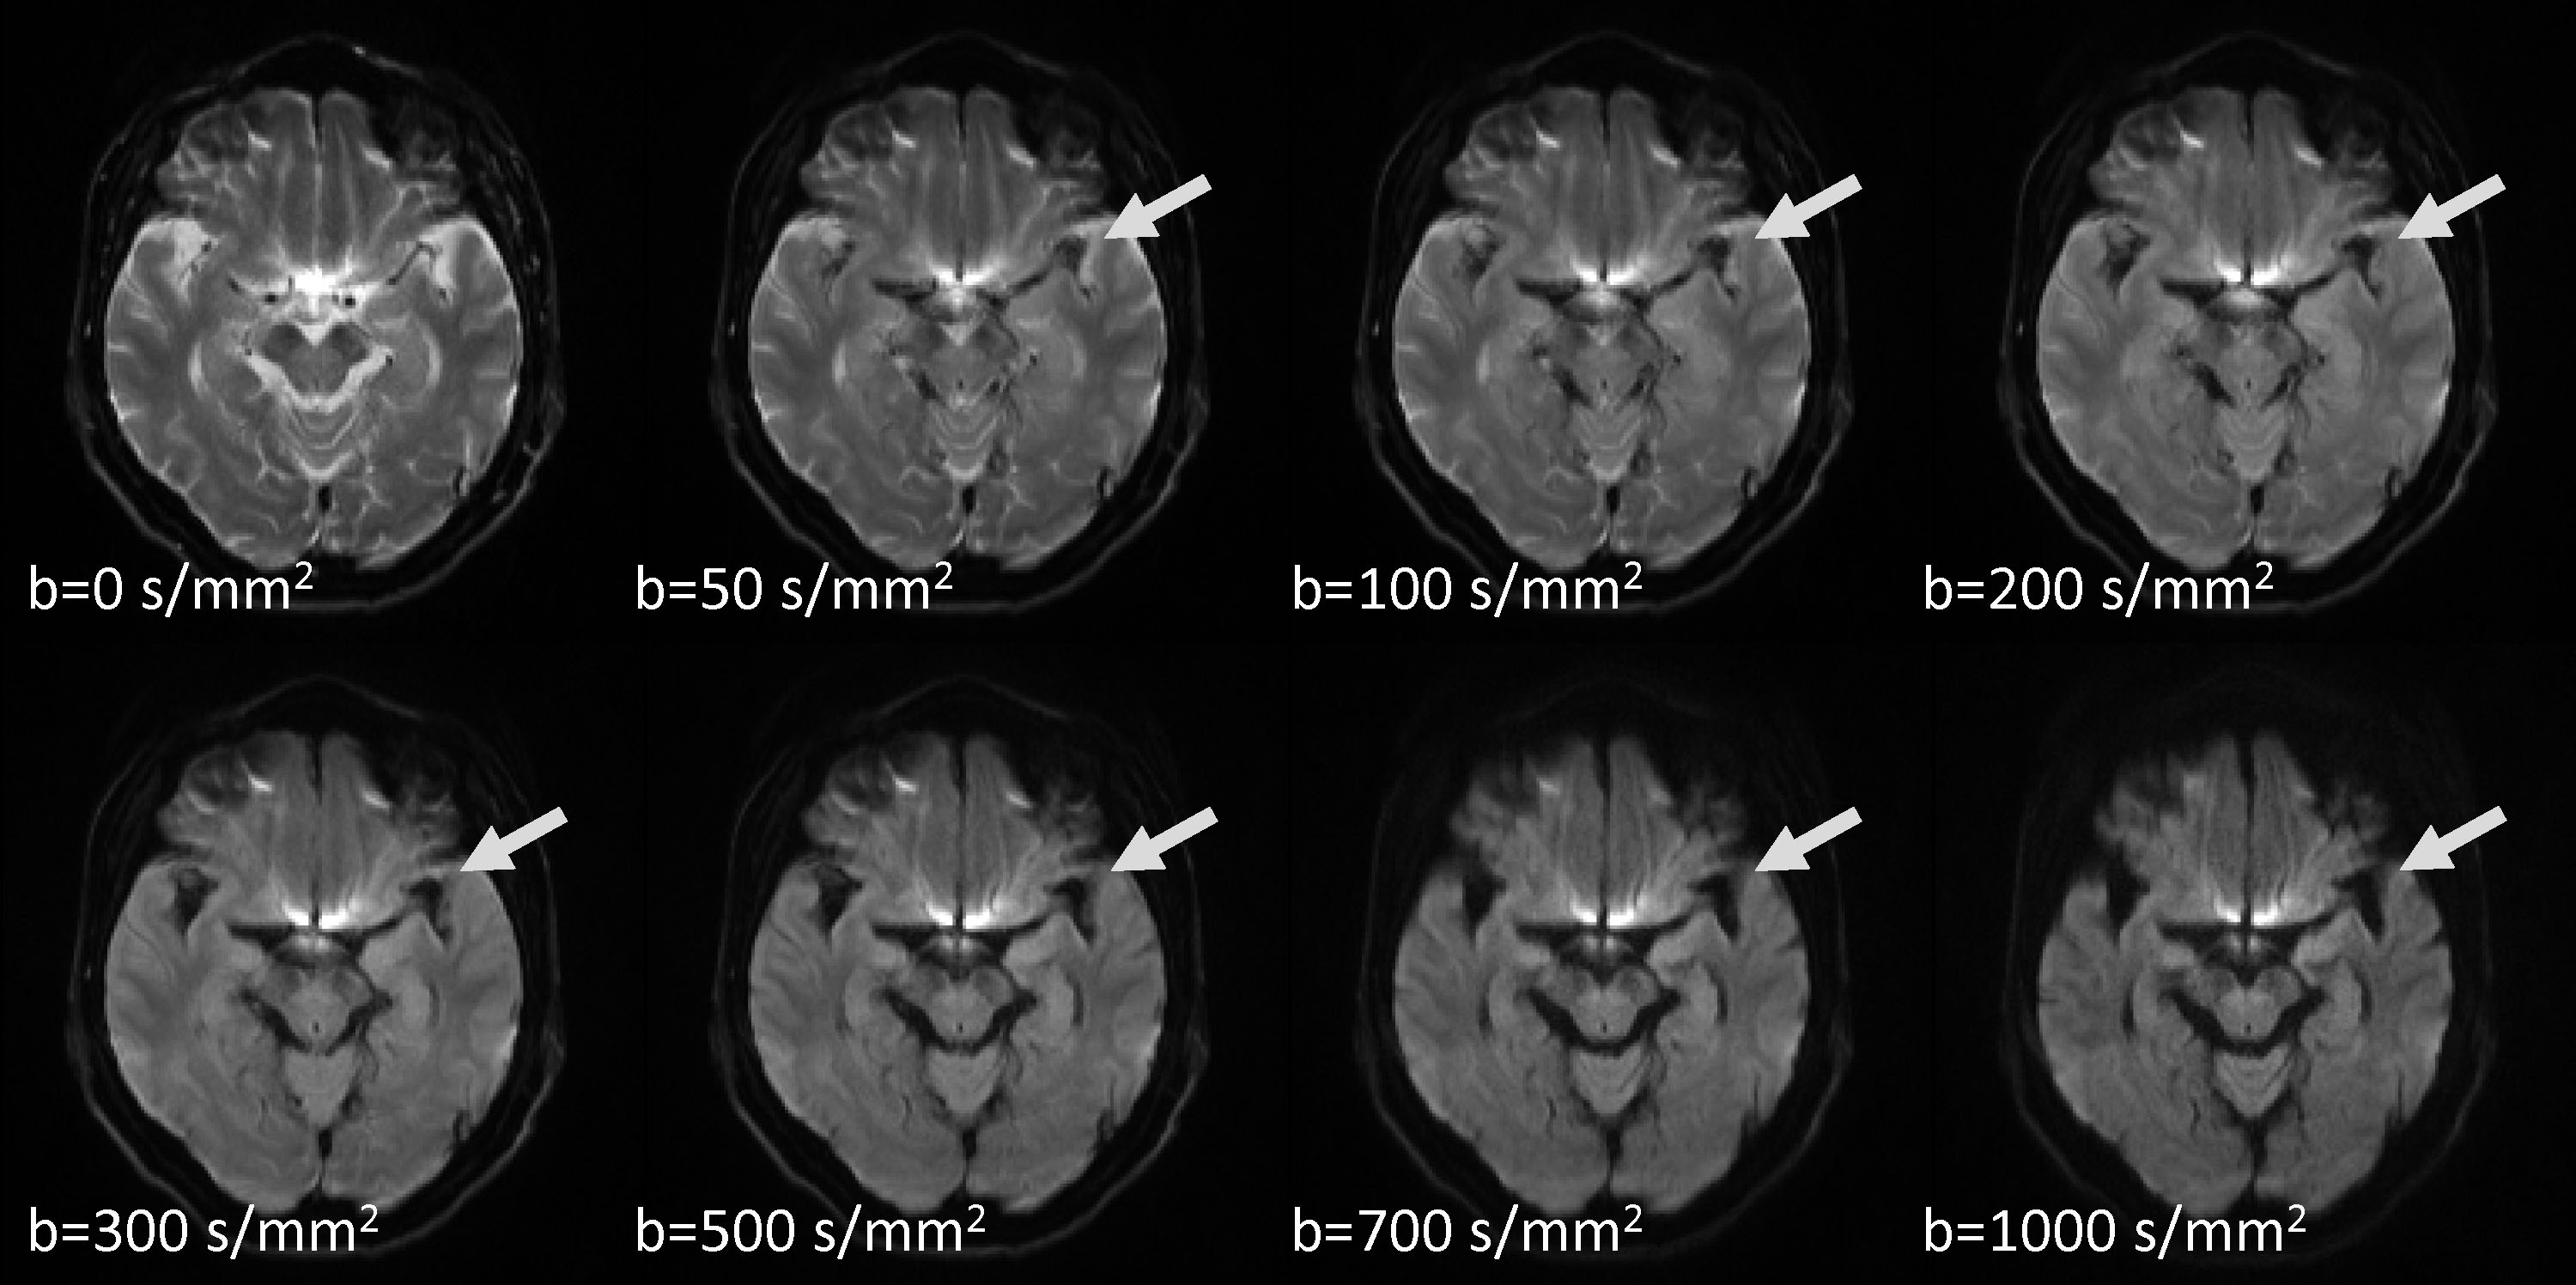
Figure 1: Diffusion weighted imaging (DWI) with various b-values
As the motion-probing gradient with higher b-values was applied, the prominent signal decrease (signal drop) from motion-related signal dephase occurred in CSF areas, particularly in regions with high CSF motion. Note that the region of signal drop within the Sylvian vallecula (arrows) become wider as the b-value increases.
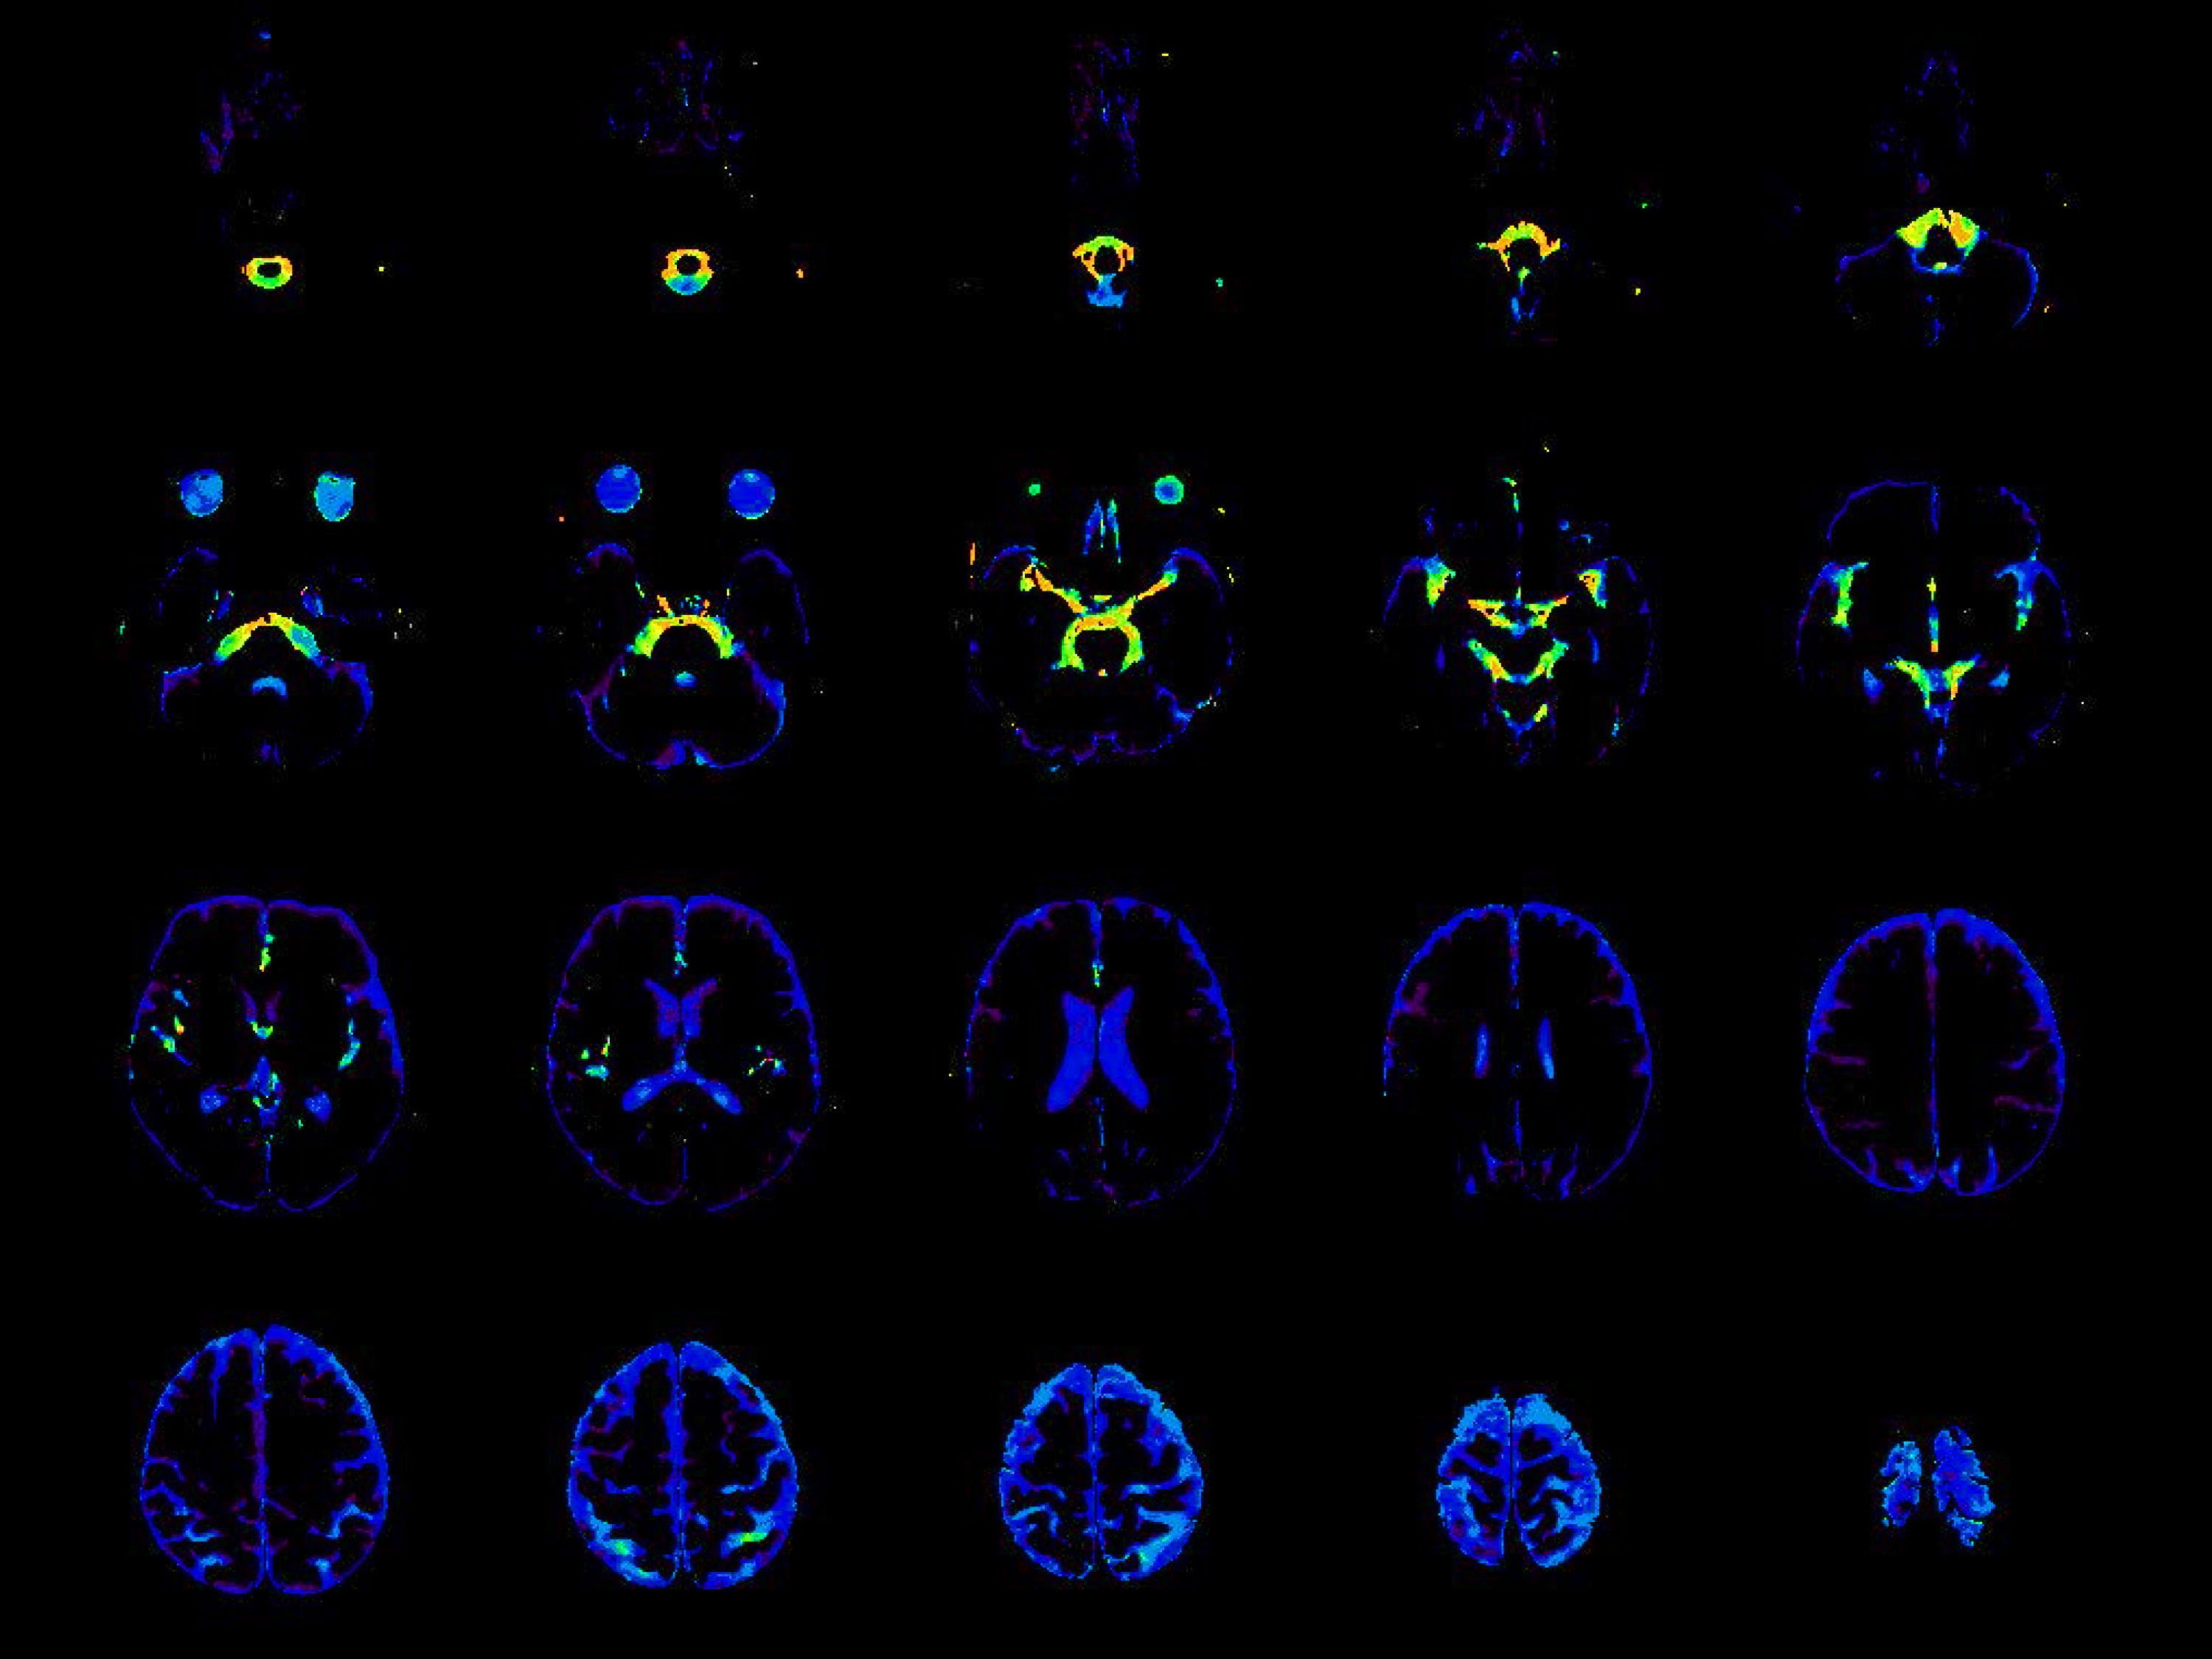
Figure 2: Multi b-value diffusion weighted image diphase map (MbDDM)
Color composite images in which the area of signal drop were color-coded as follows:
Orange: b=50, Yellow: b=100, Light green: b=200, Green: b=300, Blue: b=500, Indigo: b=700, Purple: b=1000 s/mm2
Note that the signal drop with lower b-values occur in regions including the ventral posterior fossa and the Sylvian fissure, indicating greater CSF motion. In contrast, the signal drop in the lateral ventricle or the parietal subarachnoid space only occurred with higher b-values, indicating less CSF motion.
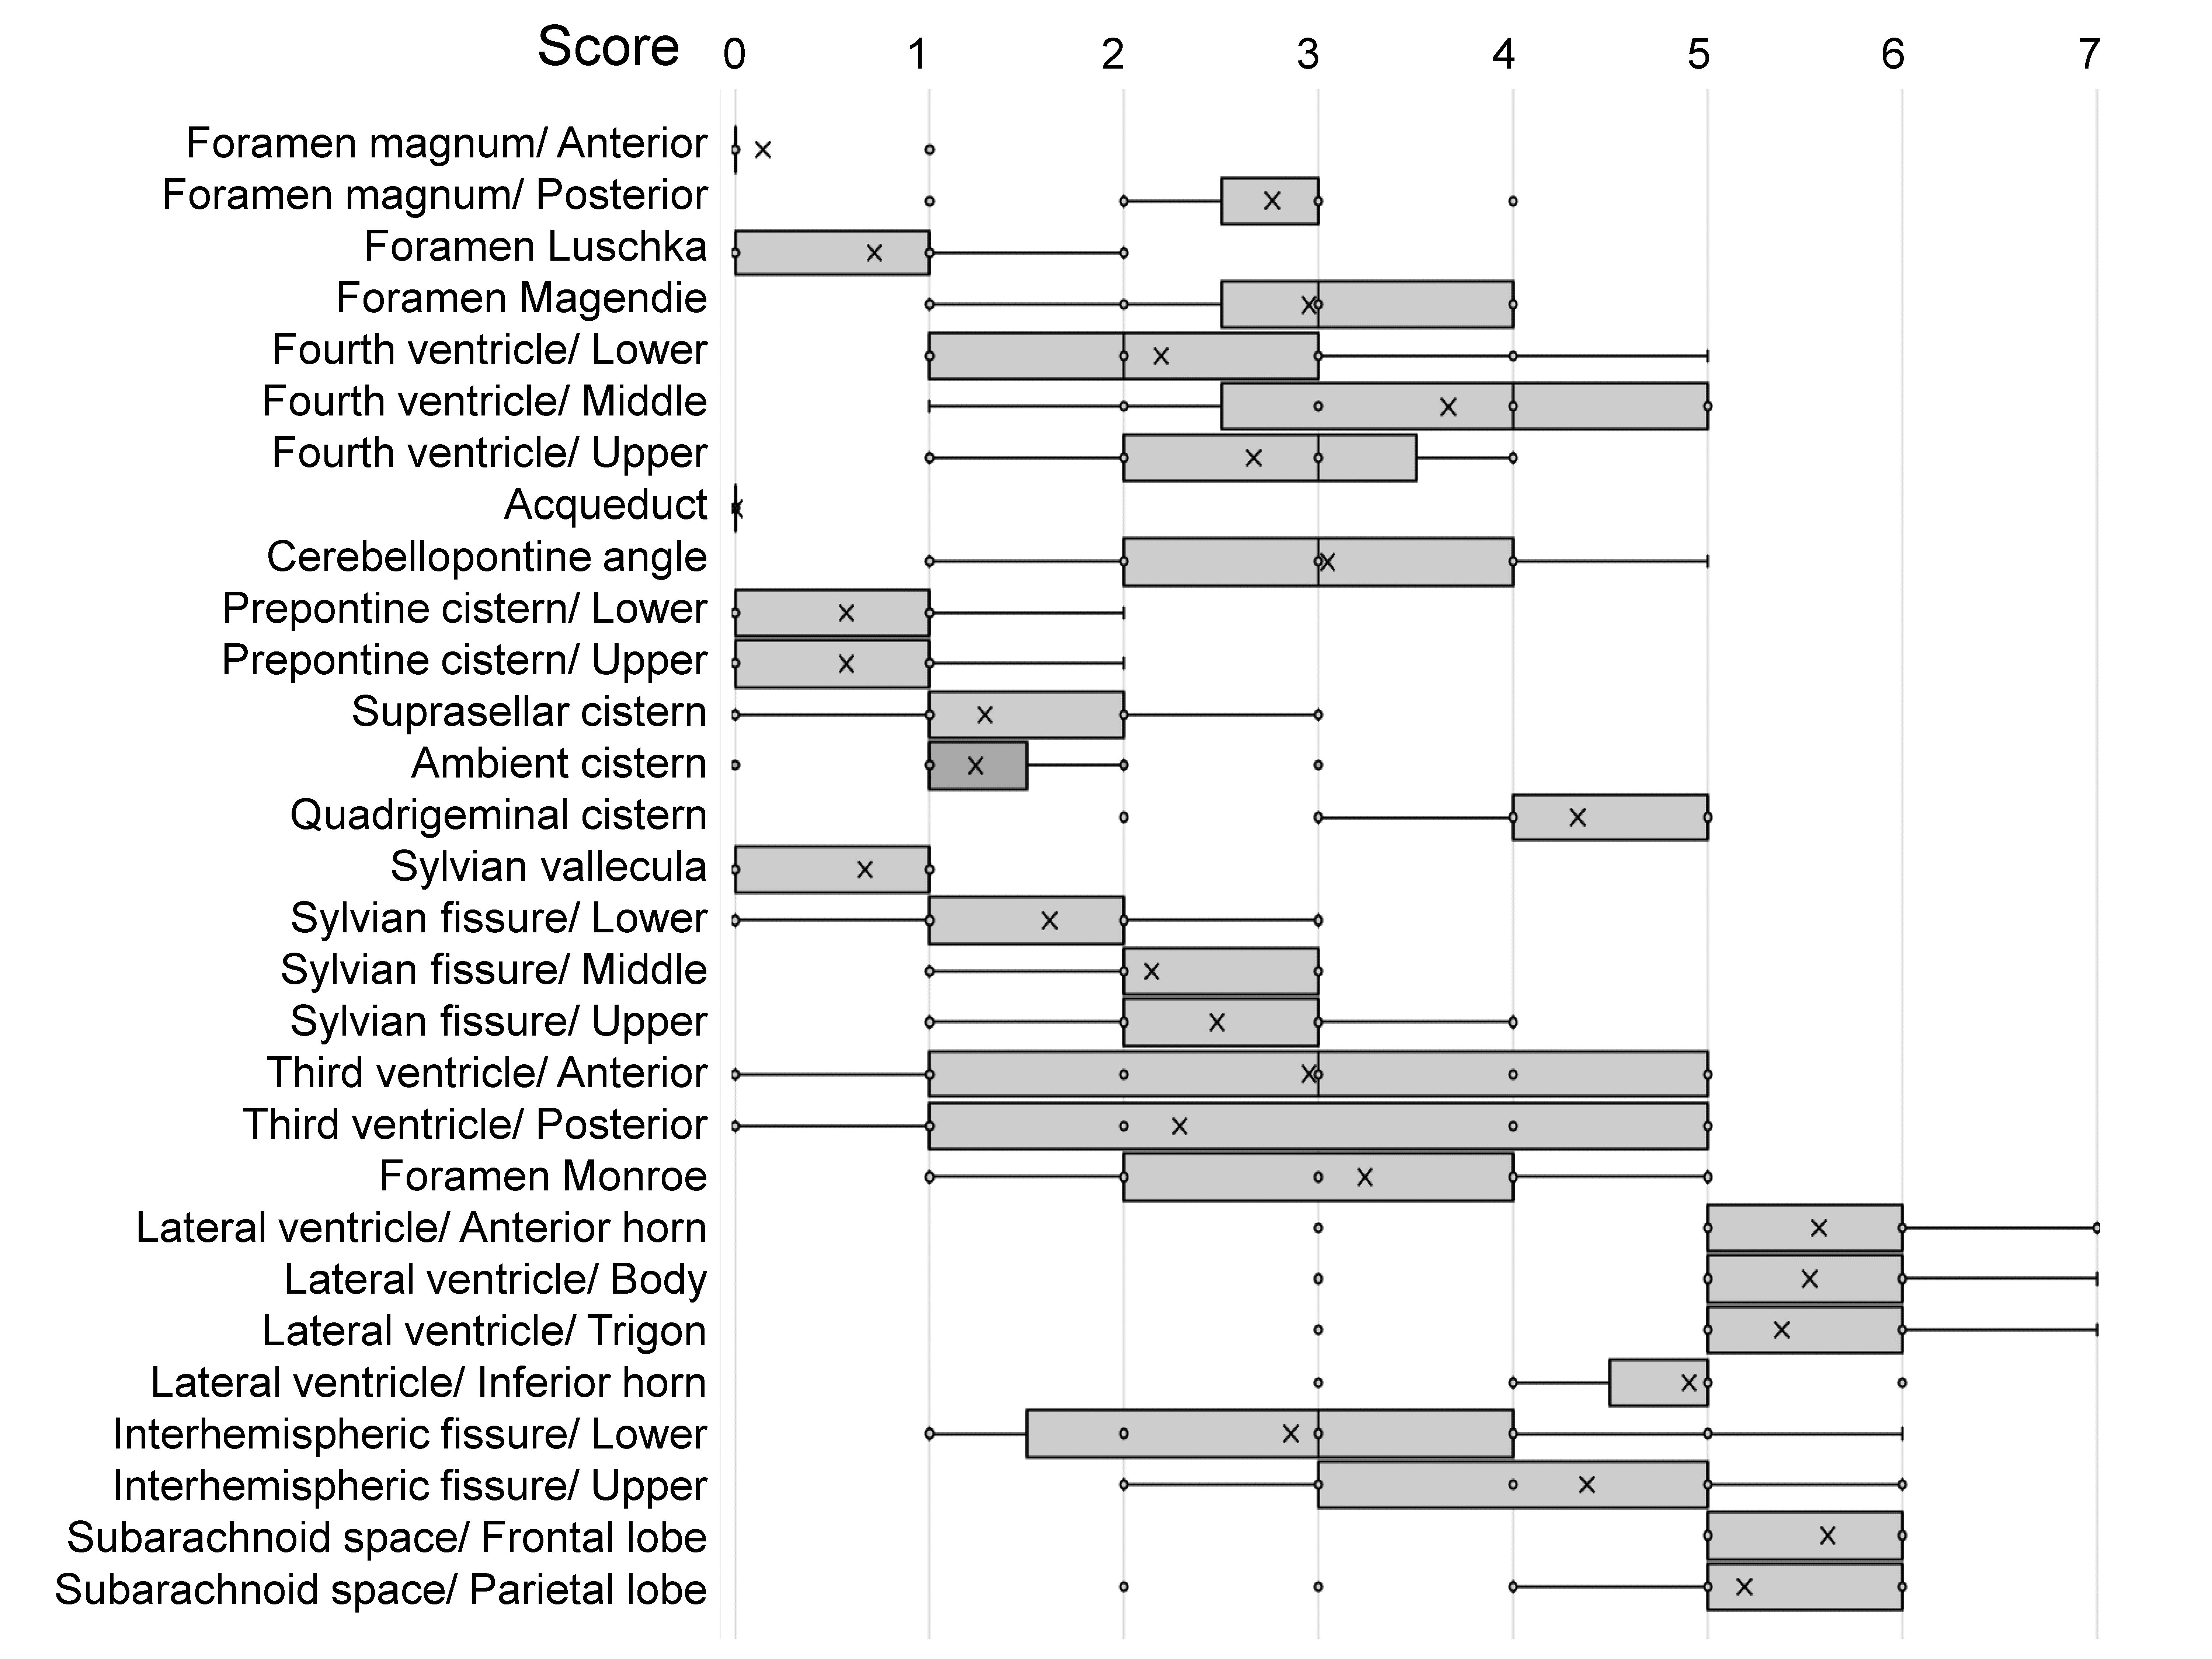
Figure 3: Distribution of the scores on the MbDDM
A lower score means that the signal drop occurred at lower b-values, which indicates that the CSF motion was greater. The CSF motion was prominent in regions including the ventral portion of the posterior fossa, the suprasellar cistern and the Sylvian fissure. Whereas, the CSF motion was less in the lateral ventricles and parietal subarachnoid space.
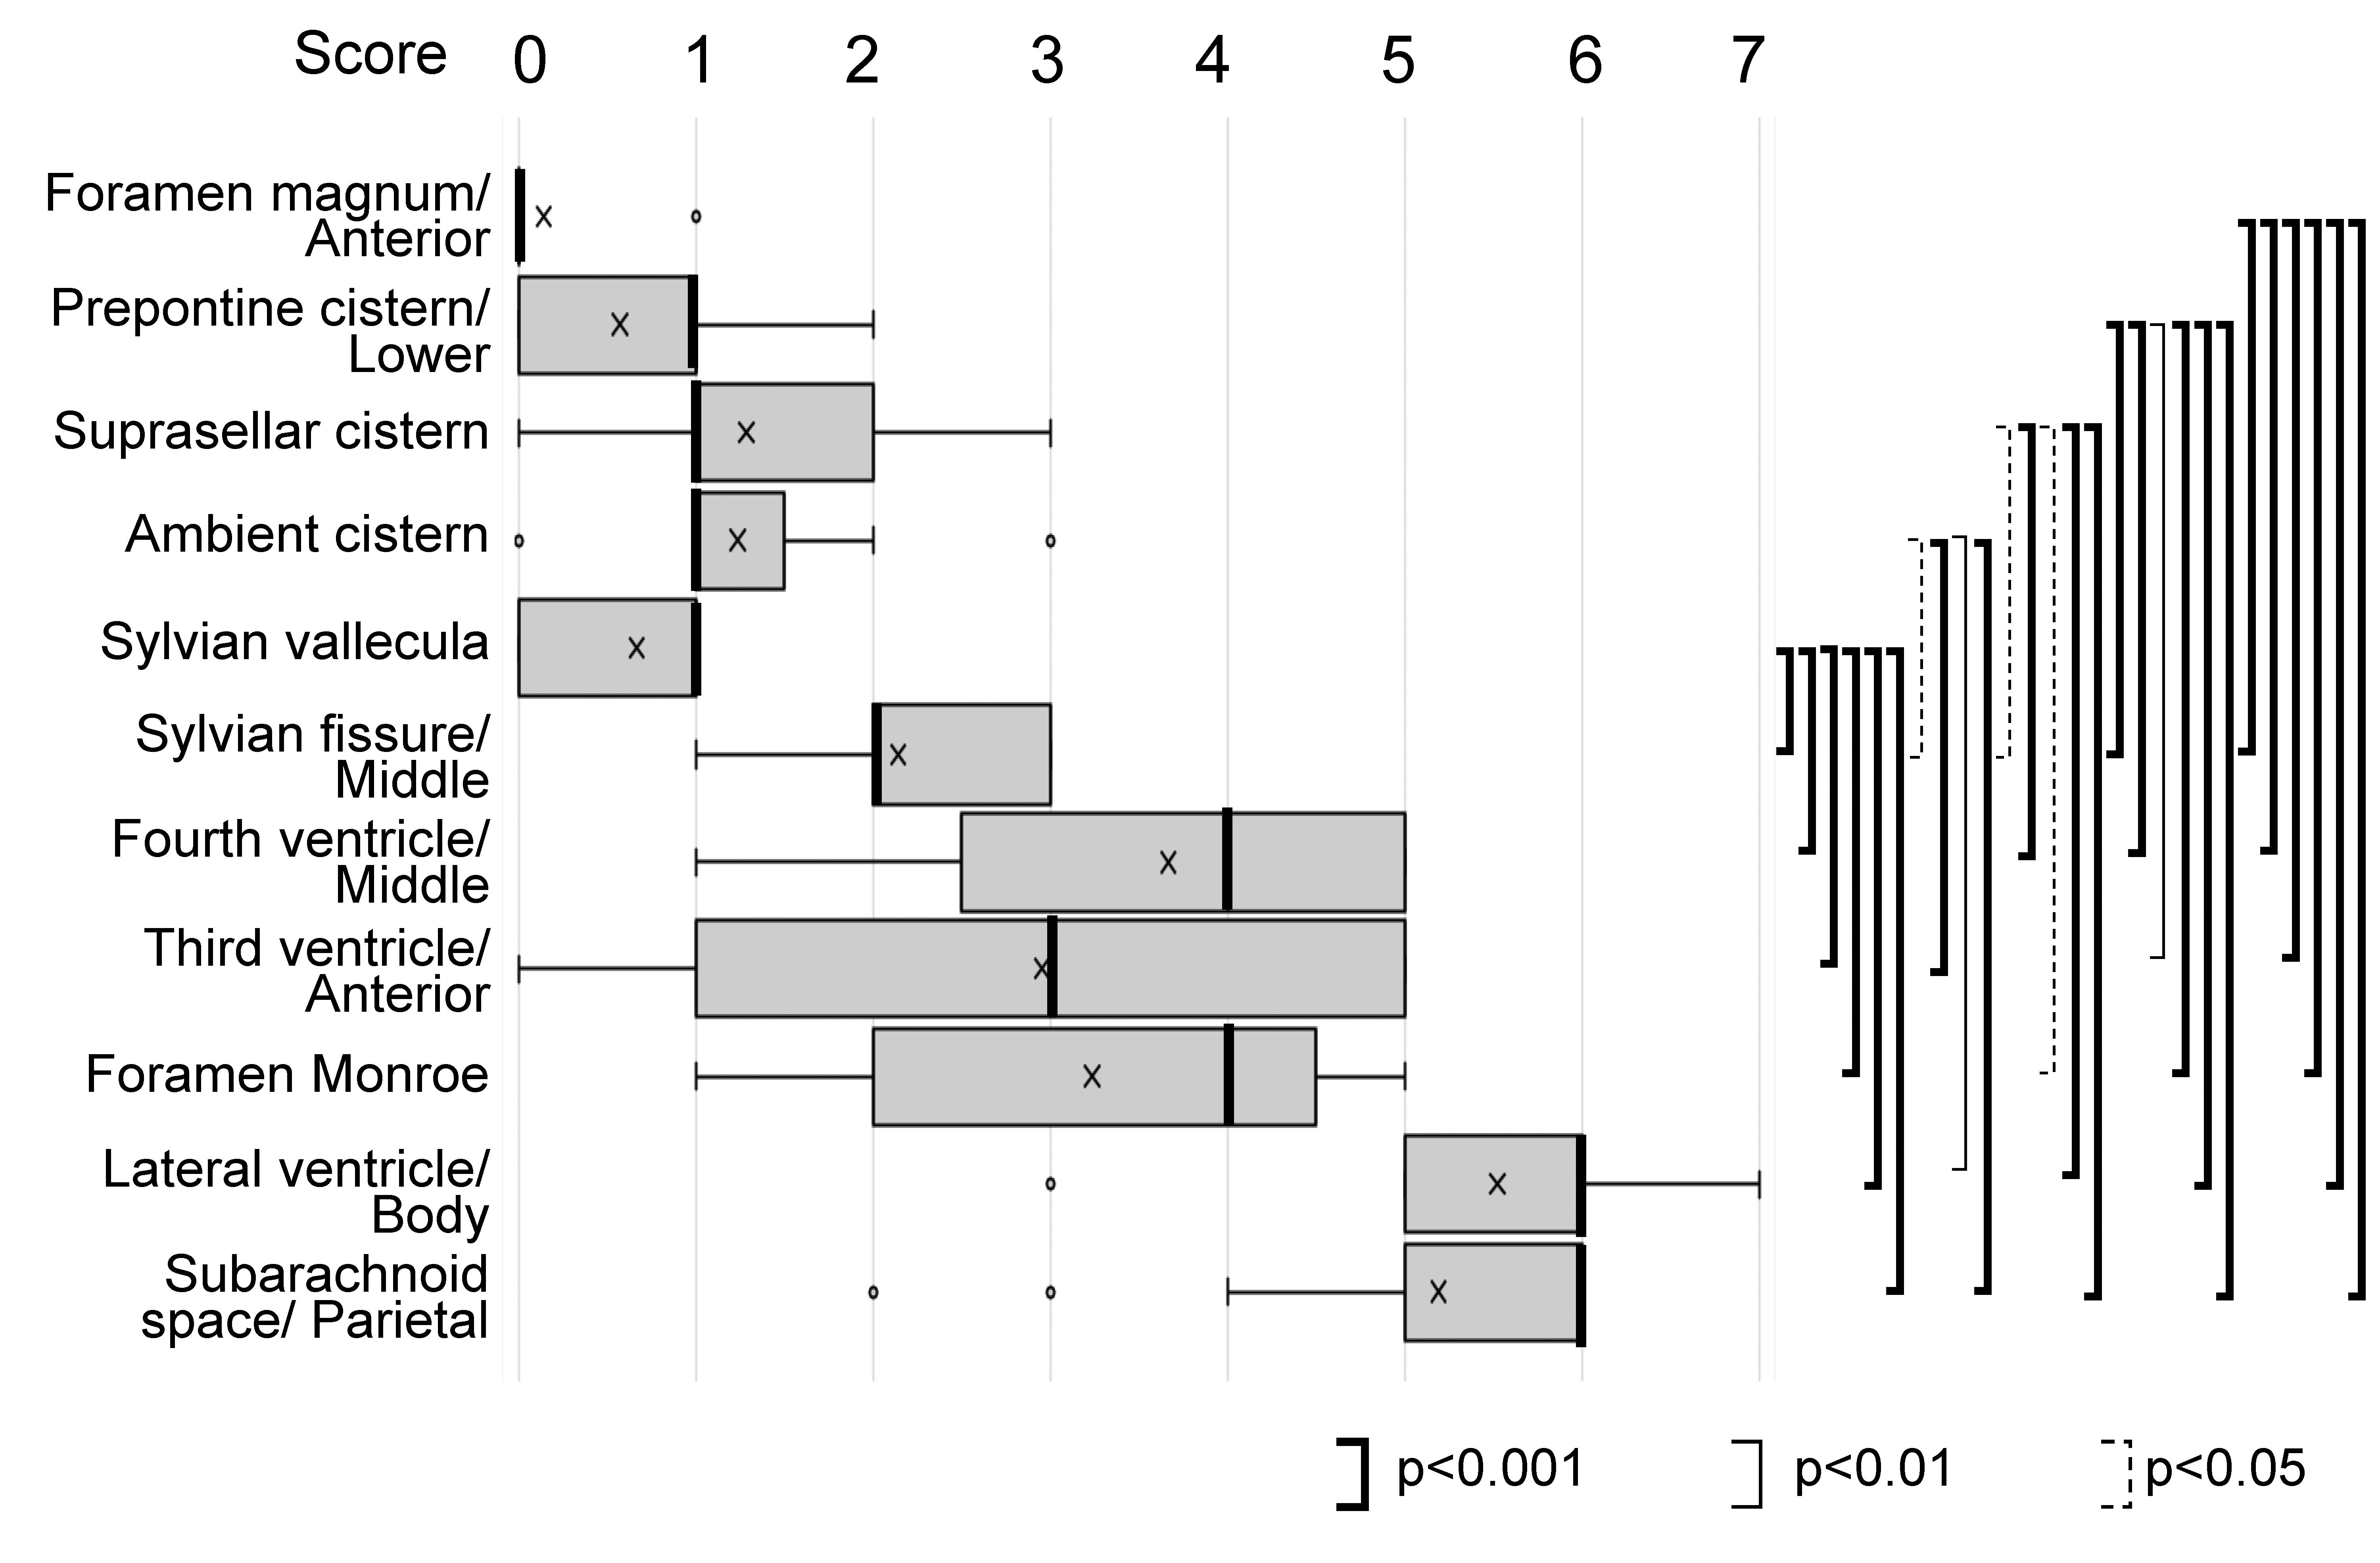
Figure 4: Results of the statistical analysis for representative areas
Statistical analysis (Tukey test) was performed for the representative areas. The ventral portion of the posterior fossa shows a statistically significant lower score compared to the ventricles or parietal subarachnoid space.