0536
Strain Tensor Imaging (STI): Voxelwise assessment of cardiac-induced brain tissue strain at 7T MRI.1Radiology, University Medical Center Utrecht, Utrecht, Netherlands, 2Neurology, University Medical Center Utrecht, Utrecht, Netherlands
Synopsis
The heartbeat induces microvascular blood volume pulsations and subsequent tissue deformations in the brain. Although subtle (typically <1%), these deformations are highly relevant as they accelerate clearance of brain waste products. Moreover, they enable non-invasive assessment of mechanical tissue properties. We developed a sensitive MRI technique with full brain coverage for voxelwise quantification of the cardiac-induced brain tissue strain tensor with 3mm isotropic resolution, based on displacement encoding with stimulated echoes (DENSE). We visualize the strain tensor similar to diffusion tensor imaging. Strain tensor imaging opens a window on brain tissue mechanics and physiological blood volume dynamics in the brain.
Introduction
Brain tissue deformation is mainly induced by the cardiac cycle and is potentially a valuable source of information on the brain tissue’s mechanical properties1,2. Moreover, this deformation contributes to driving the waste clearance system3,4. The overall phenomenon of brain tissue motion is subtle, involving submillimeter displacements. Displacement encoding with stimulated echoes (DENSE)5 allows for acquisition of the motion field maps6,7, from which the tissue strain can be computed. However, even at 7T MRI, the current 3D strain measurements lack a factor 10 of SNR to perform a voxelwise analysis of the tissue strain7. In this work, we present a sensitive single-shot multi-slice acquisition approach of the DENSE sequence, that provides sufficient SNR to perform a voxelwise analysis of the tissue strain tensor with whole brain coverage.Methods
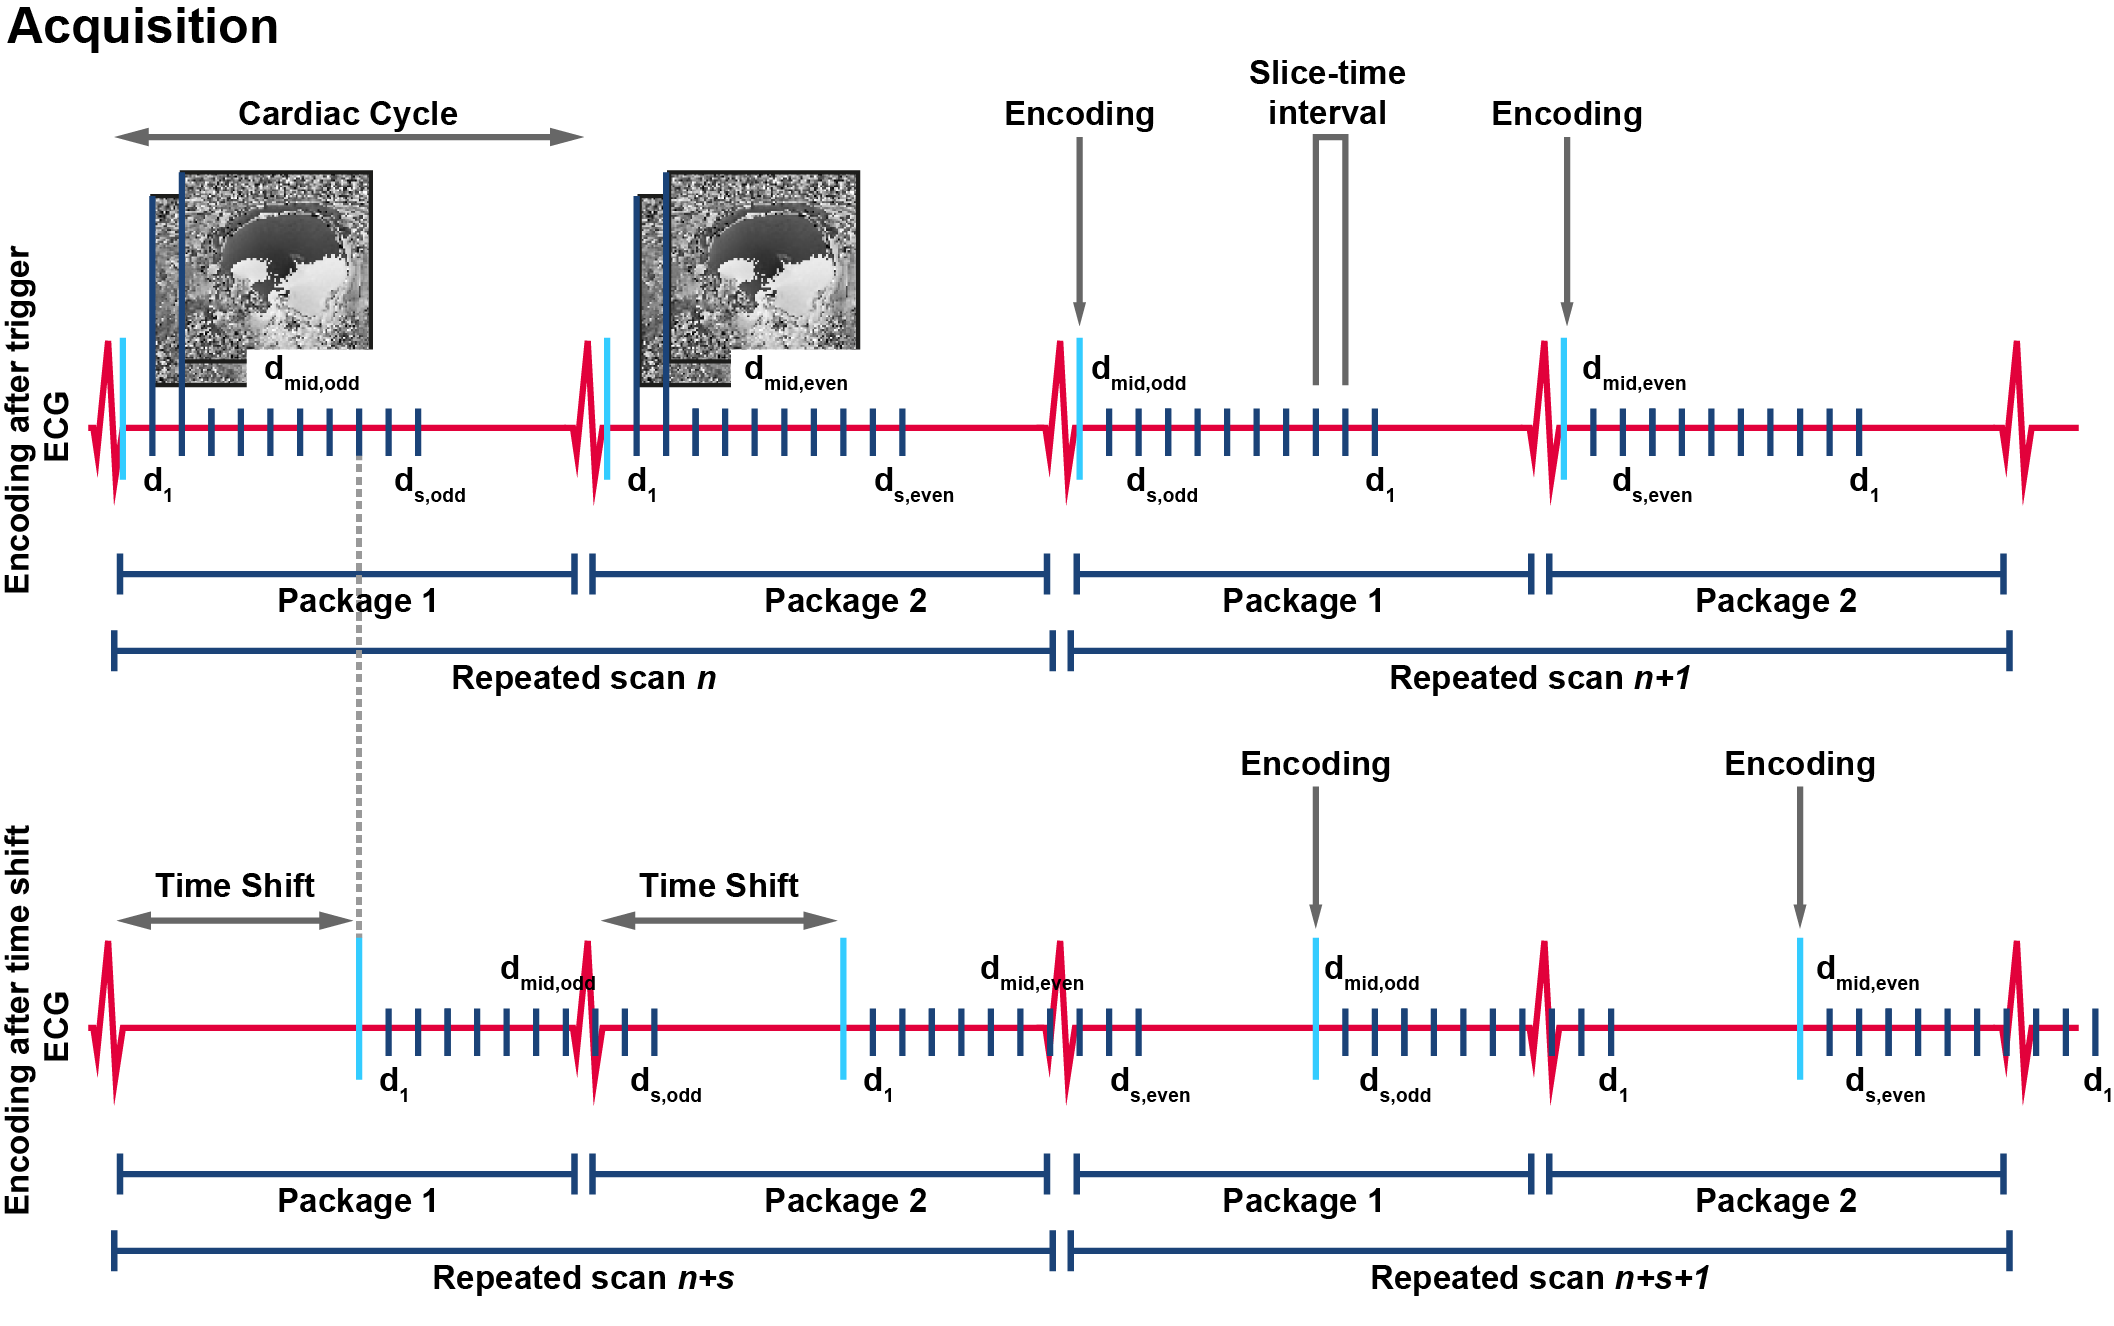
To obtain SNR-efficient whole brain DENSE acquisitions, we modified our previous developed cardiac triggered, single-shot sequence8 to be compatible with a multi-slice (MS) multi-band (MB)9 acquisition approach. Odd and even numbered slices were acquired in two separate packages, one package at each cardiac interval (Figure 1). The slice acquisition order was permuted for every successive repeated scan and a time-shift was implemented so that each slice was acquired at 18 post-trigger delays covering the cardiac cycle.Written informed consent was obtained from all volunteers in accordance with the Ethical Review Board of our institution. Four healthy subjects (2 females, age 28±3 years) were included and scanned at 7T (Philips Healthcare) using an 8-channel transmit and 32-channel receive head coil (Nova Medical). DENSE measurements (60 slices, resolution: 3x3x3mm3, SENSE: 2.5 AP, multi-band factor: 3) were repeated 80 times: 10 slice order permutations $$$\times$$$ 2 motion encoding strengths (75 μm/π, 100μm/π) $$$\times$$$ 2 time shifts after triggering (one time shift of 0ms; one time shift of 8 times slice-time-interval) $$$\times$$$ 2 opposite encoding directions (to distinguish between motion induced phase and phase confounders). Acquisition of one DENSE series took 80$$$\cdot$$$2 (2 is the number of slice packages) heartbeats (2:40min for 60bpm heartrate). Physiological data was simultaneously recorded, using a vector cardiogram (VCG) for triggering and a respiration belt to trace abdominal breathing. For structural reference, DTI maps were acquired as well (1.5mm isotropic resolution, bmax=800s/mm2, 16 directions).
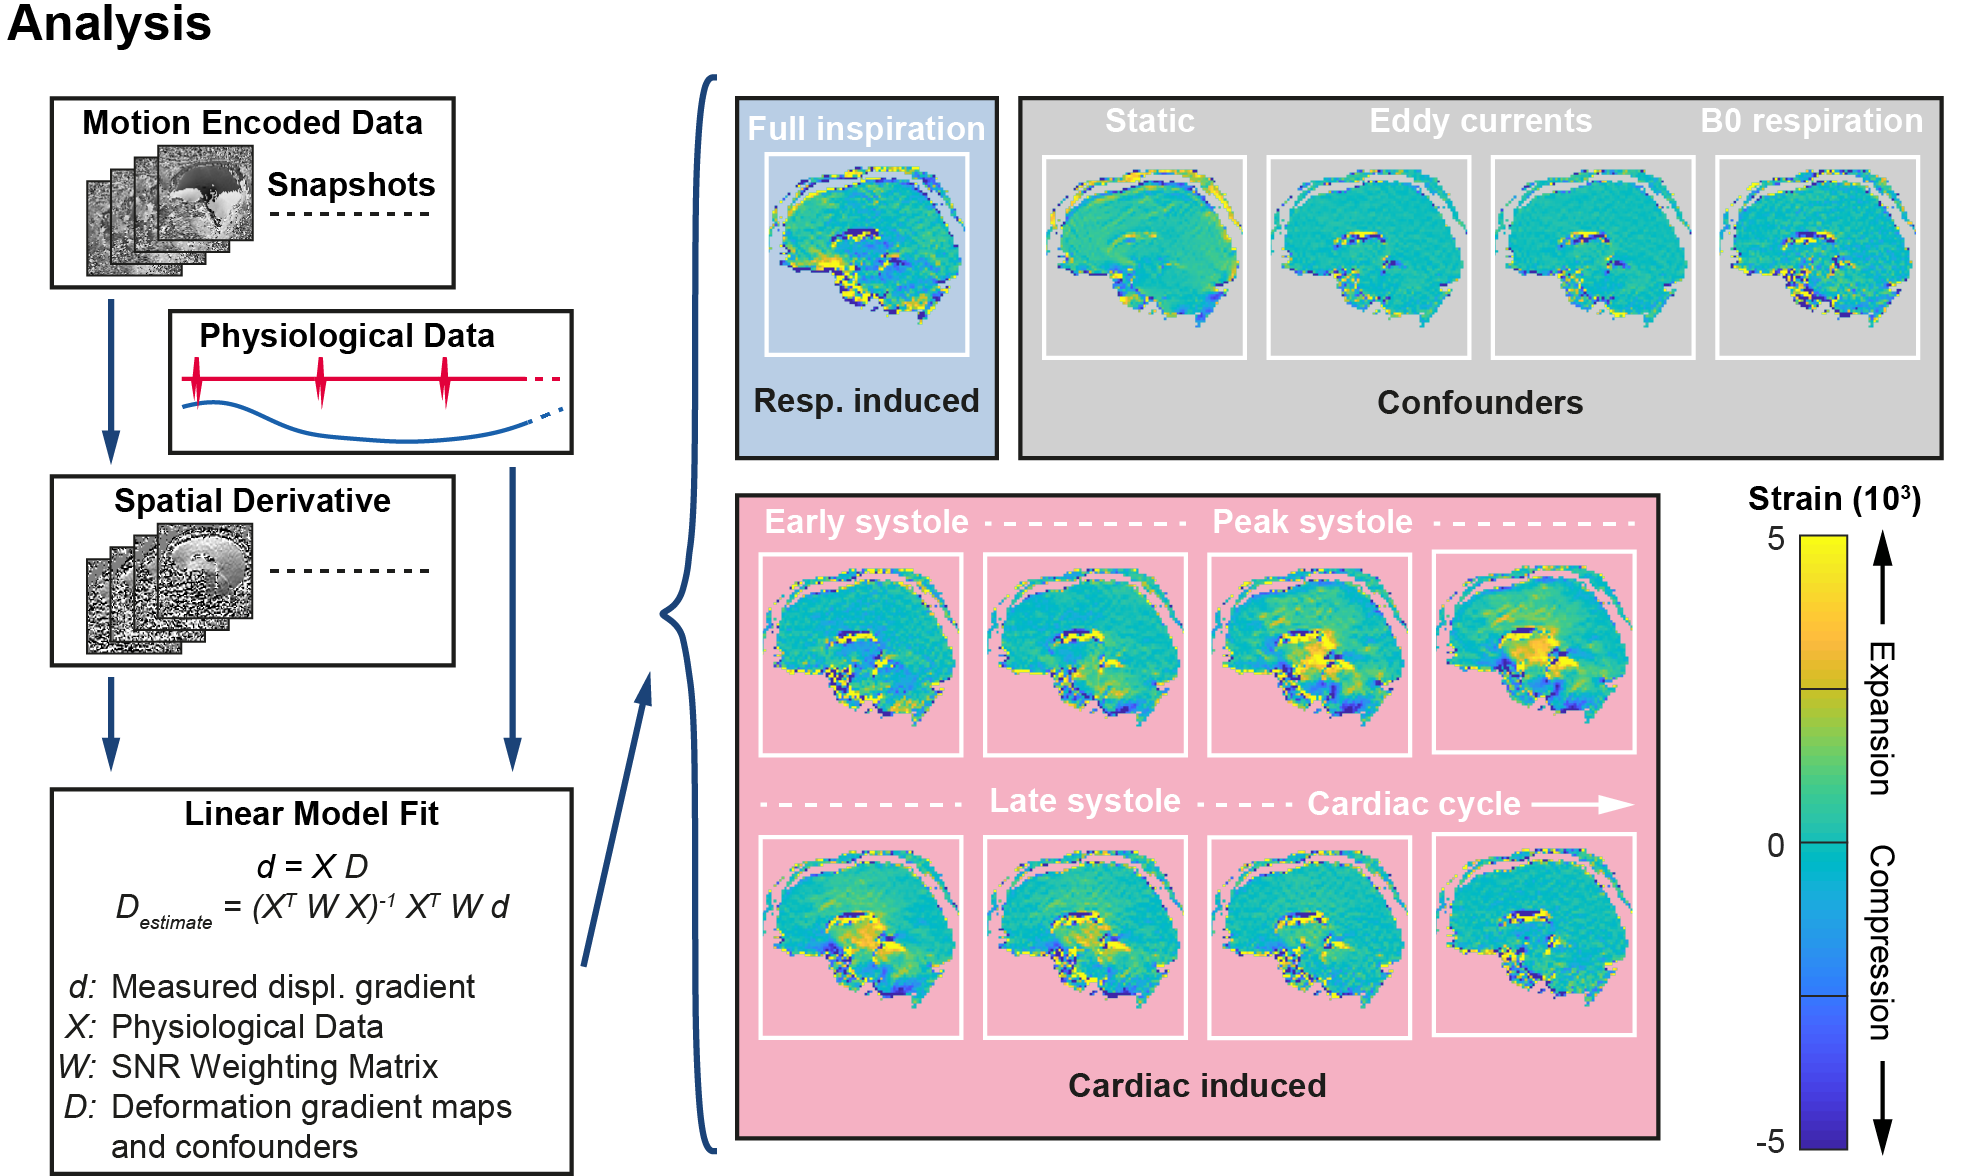
Motion encoding was performed in three orthogonal directions with different acquisition orientations. For each acquisition orientation, in-plane motion encoded datasets were obtained, resulting in 6 datasets per subject. Tissue deformation was obtained by computing the in-plane spatial derivatives. The data was fitted voxelwise to the physiological data in a linear model10, thereby isolating the confounders, respiration and interpolating to 8 heart phases distributed over the cardiac cycle (see Figure 2).
Analysis
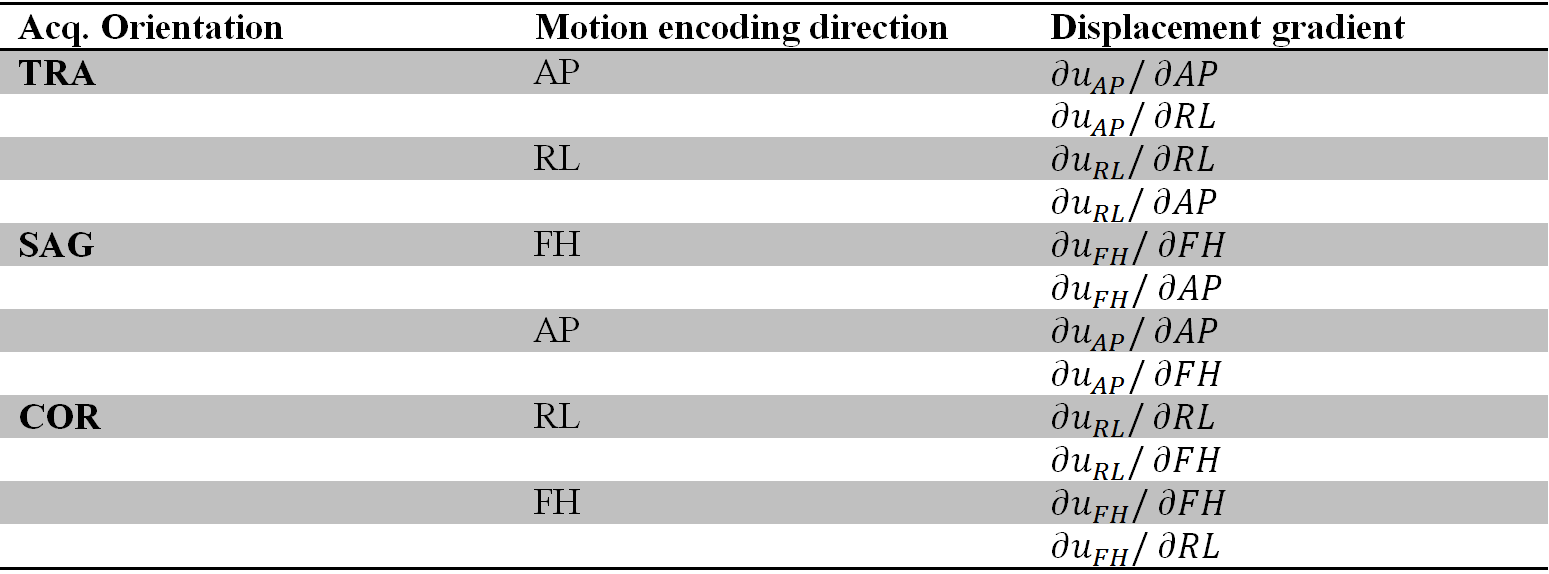
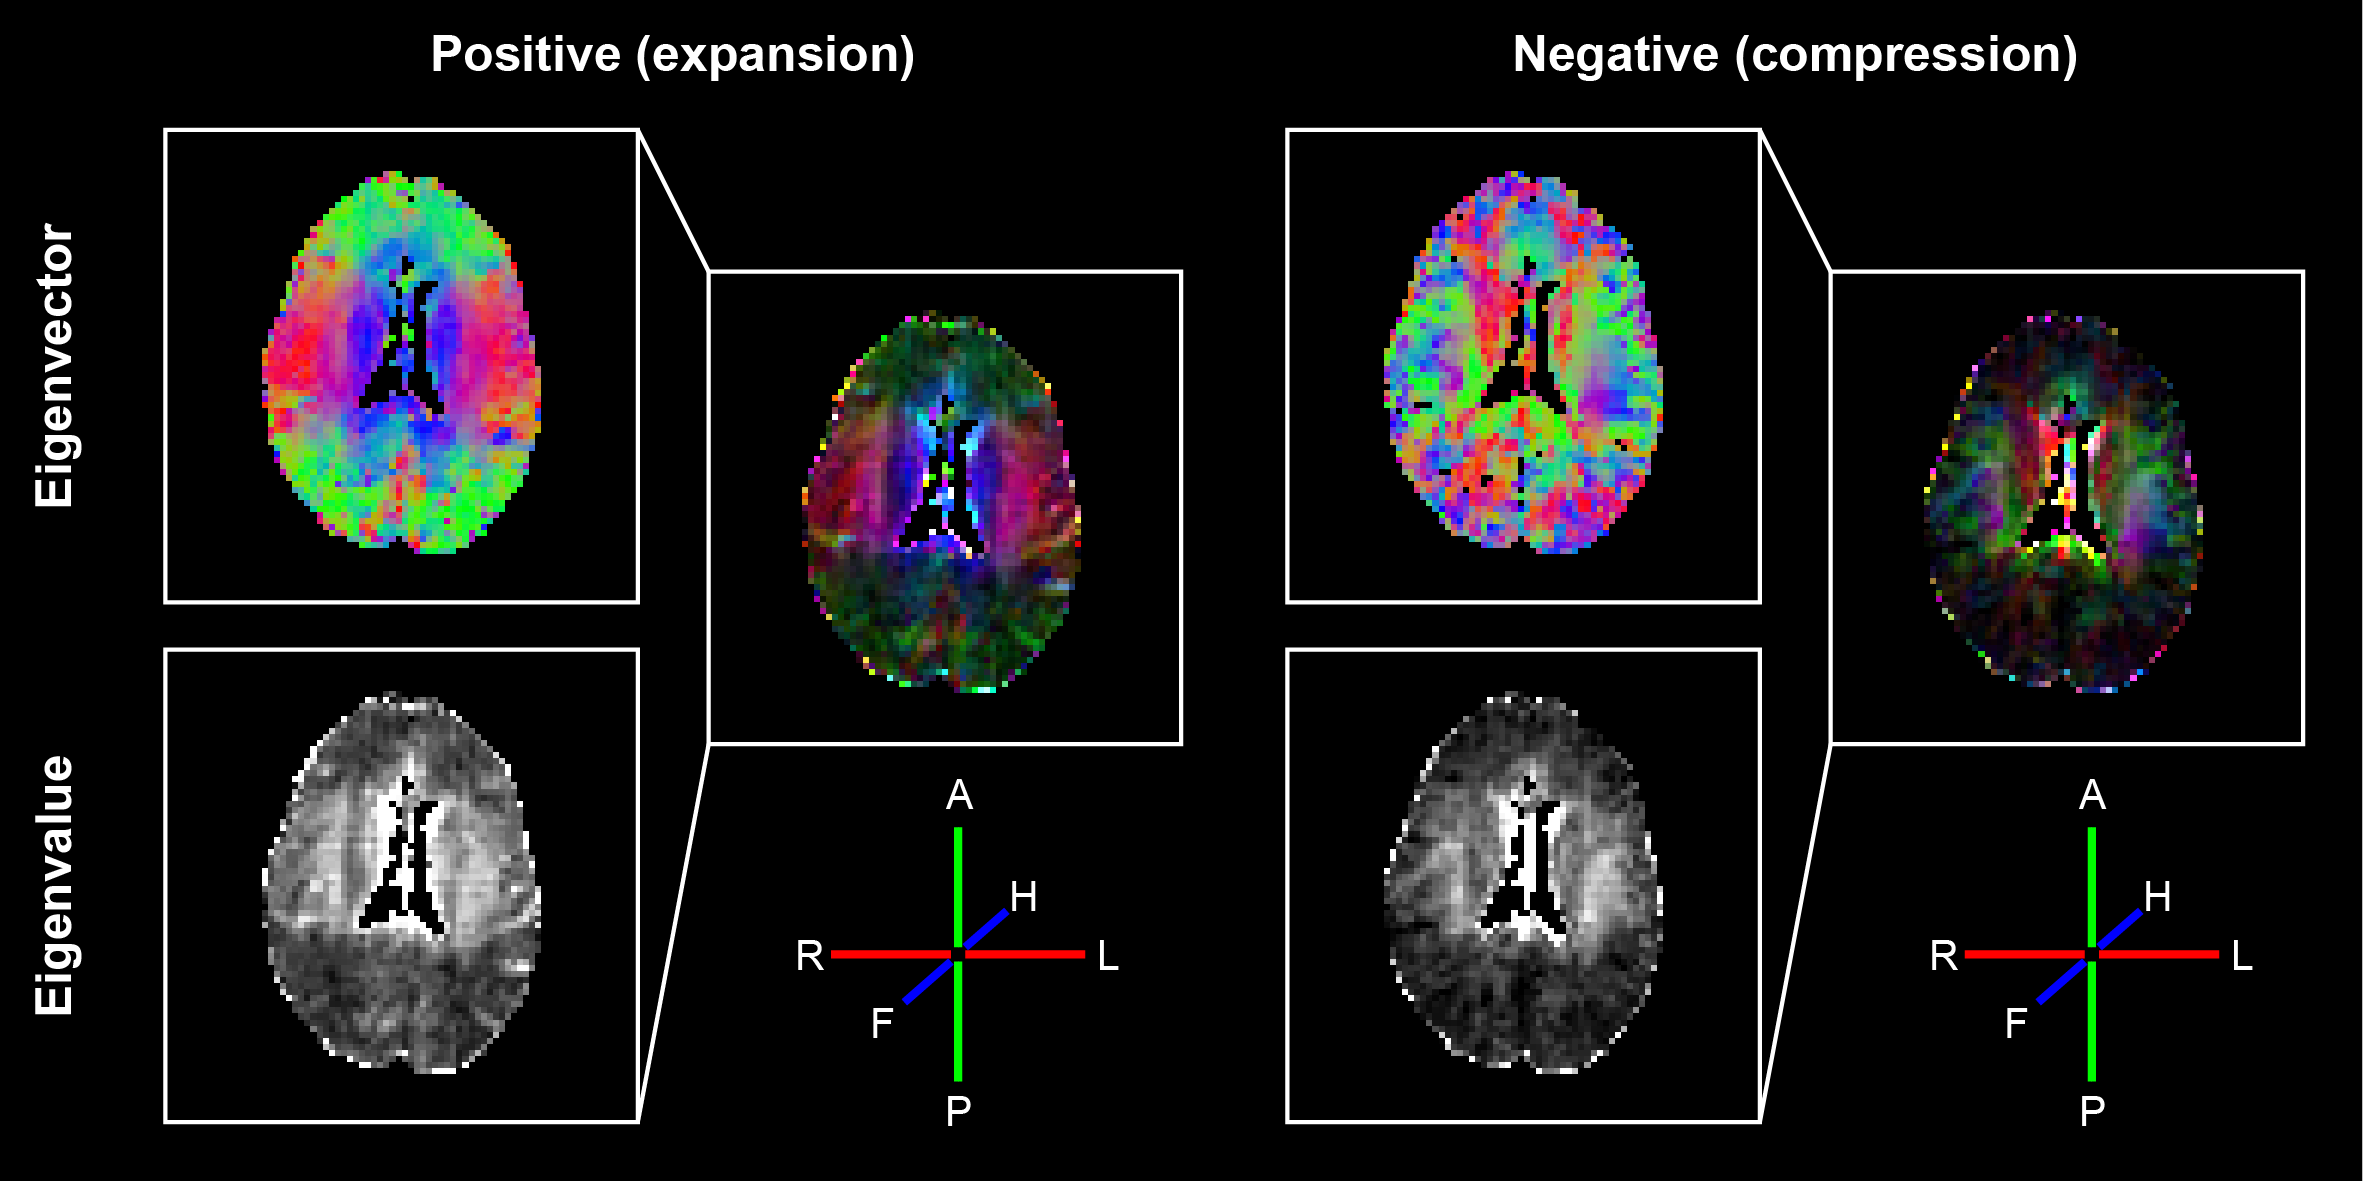
Each of the 6 motion-encoded datasets for each subject provided 2 components to fill the displacement gradient tensor for each voxel (see Figure 3).$$\mathbf{F}=\begin{bmatrix}\frac{{\partial}u_{RL}}{{\partial}RL}&\frac{{\partial}u_{RL}}{{\partial}AP}&\frac{{\partial}u_{RL}}{{\partial}FH}\\\frac{{\partial}u_{AP}}{{\partial}RL}&\frac{{\partial}u_{AP}}{{\partial}AP}&\frac{{\partial}u_{AP}}{{\partial}FH}\\\frac{{\partial}u_{FH}}{{\partial}RL}&\frac{{\partial}u_{FH}}{{\partial}AP}&\frac{{\partial}u_{FH}}{{\partial}FH}\end{bmatrix}-\begin{bmatrix}1&0&0\\0&1&0\\0&0&1\end{bmatrix}$$where $$$u_{RL,AP,FH}$$$ are the measured displacements in Right-to-Left, Anterior-to-Posterior and Feet-to-Head, respectively. $$$\mathbf{F}$$$ is the gradient deformation tensor from which the Lagrangian strain tensor $$$\mathbf{E}$$$ can be computed as11$$\mathbf{E}=\frac{1}{2}\left(\mathbf{F^TF}-\mathbf{I}\right)$$with $$$\mathbf{I}$$$ the identity matrix. $$$\mathbf{E}$$$ is independent of rigid body motion or orientation. Similar to DTI analysis and visualization12, an eigenvalue decomposition was performed on $$$\mathbf{E}$$$ which resulted in three eigenvectors with associated eigenvalues. The eigenvector with the largest positive value is associated with the direction of largest expansion of the tissue (first principal strain), whereas the eigenvector with the largest negative value is associated with the direction of largest compression (third principal strain) (see Figure 4).Results and Discussion
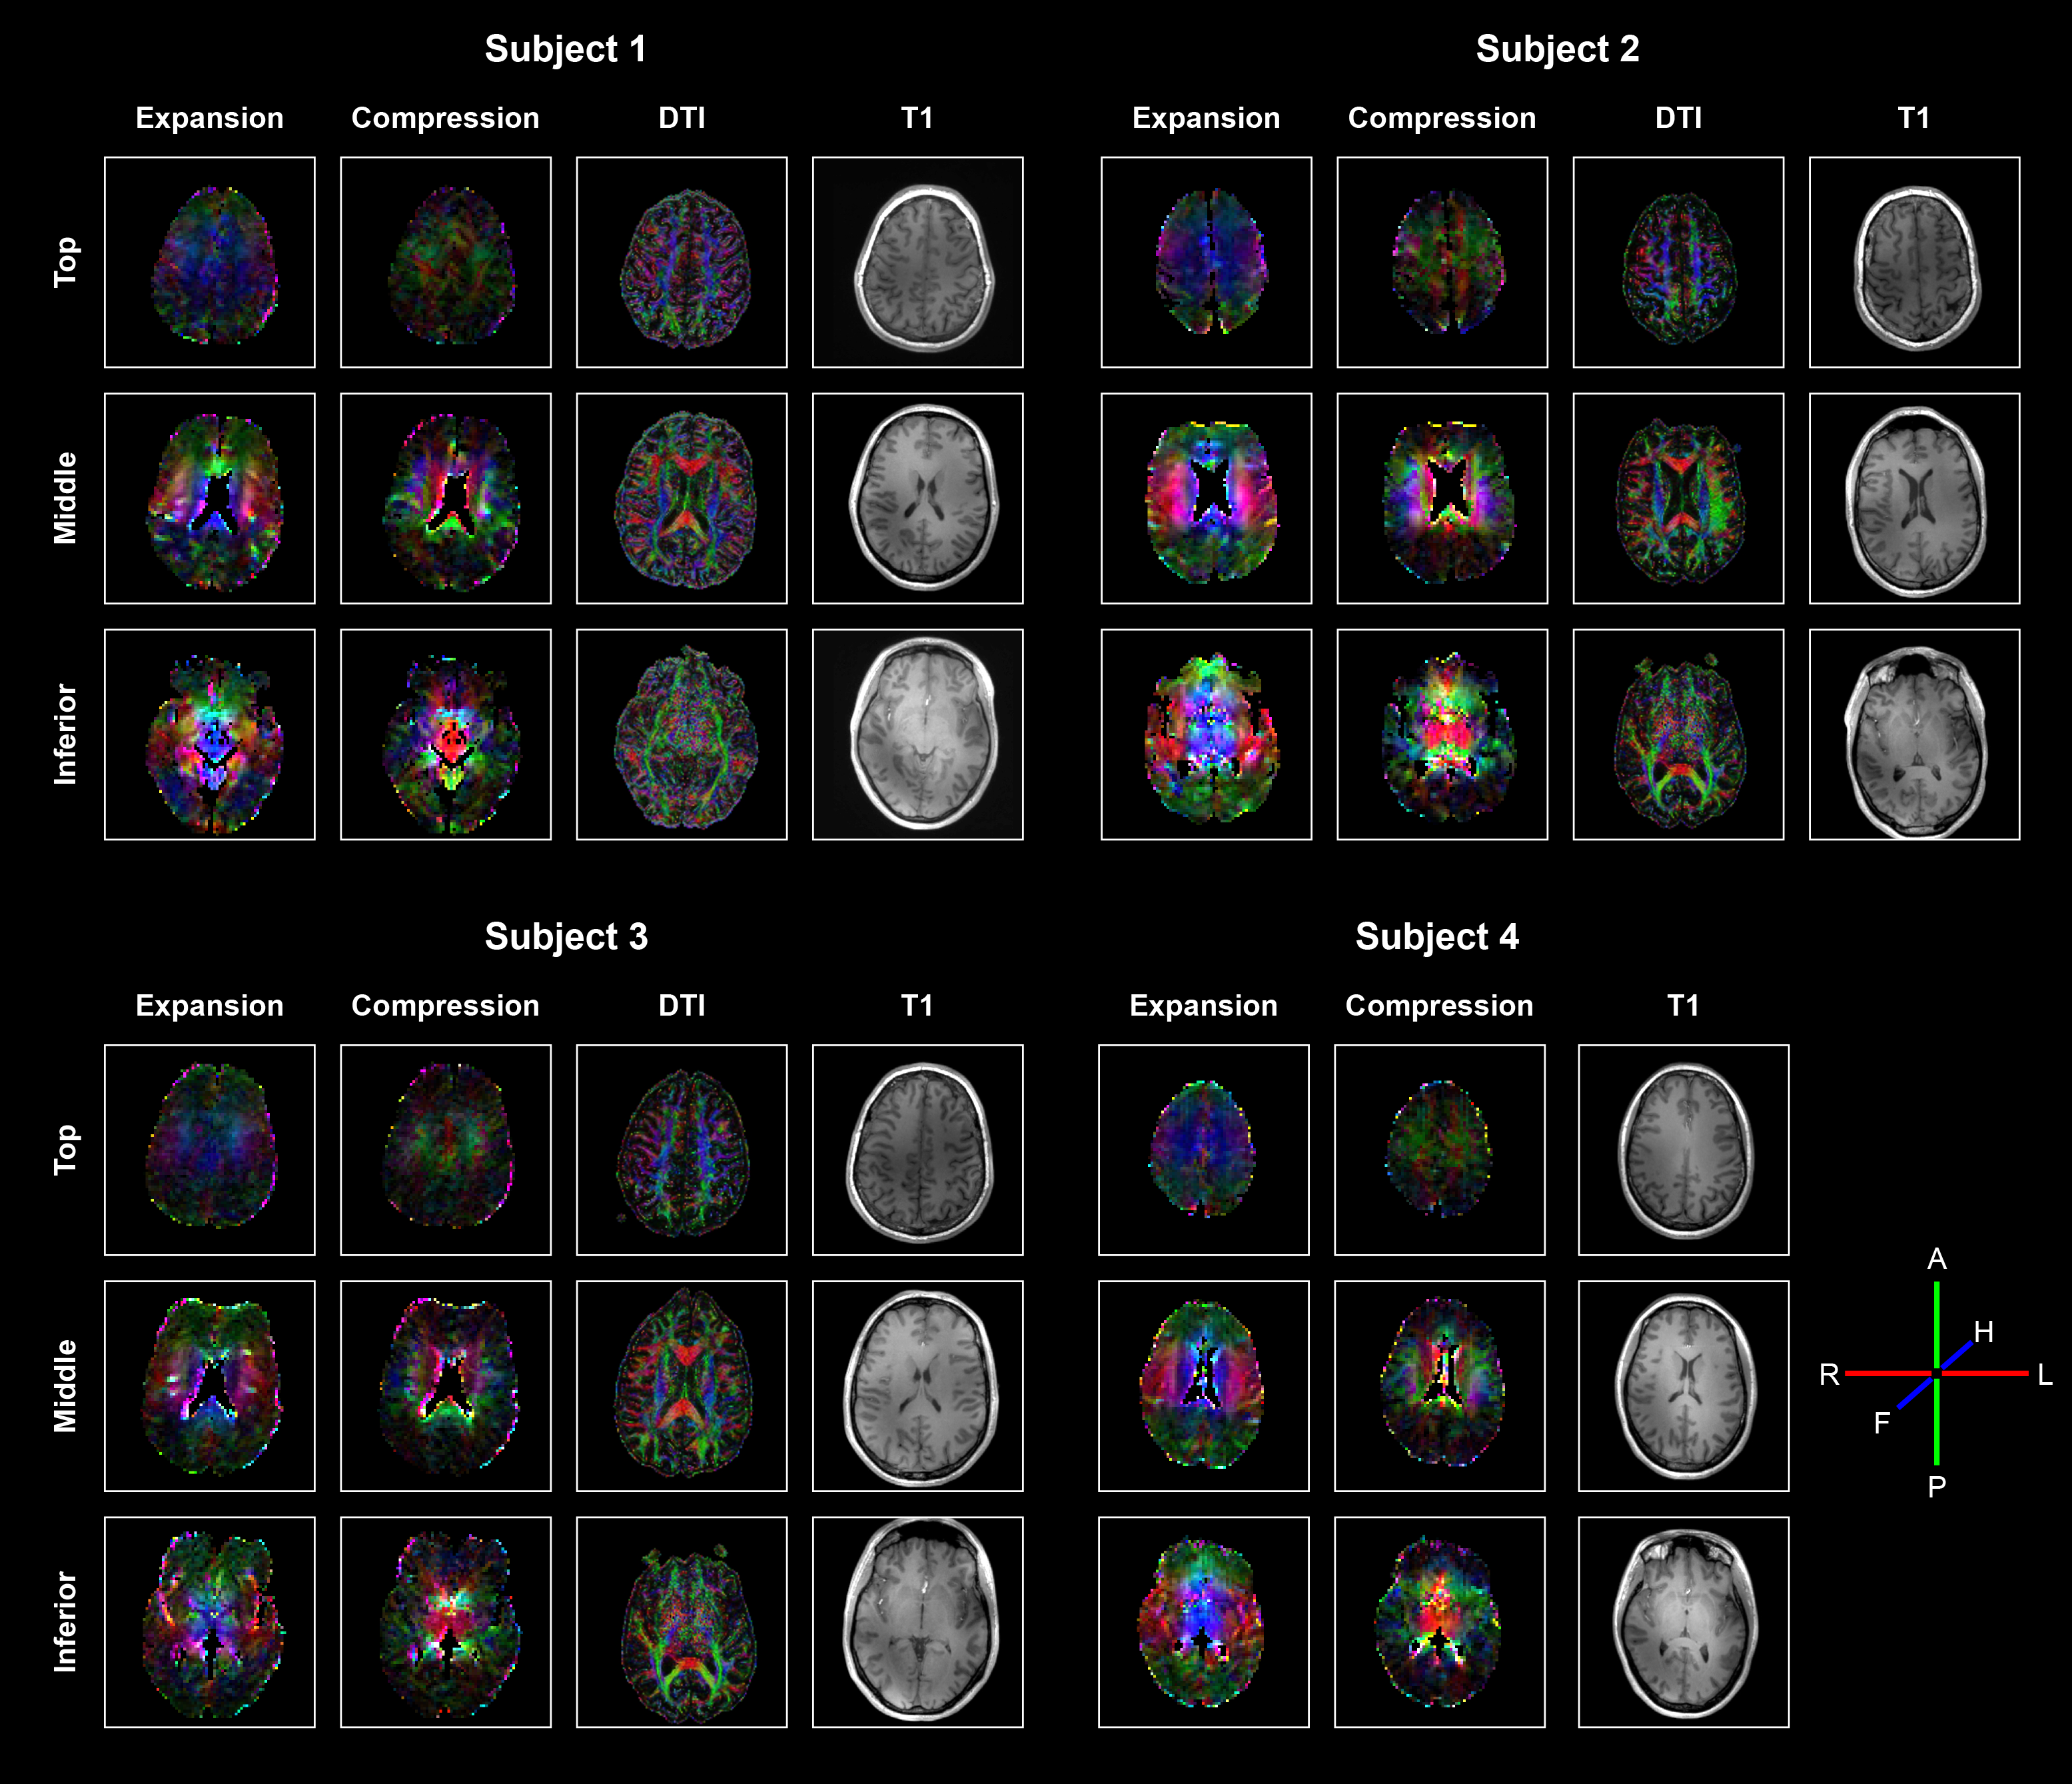
Fitting the data to the physiological information resulted in smooth displacement gradient maps over the complete brain. Combining the 3D volumes with different components of the displacement gradient tensor was done without registration and resulted in smooth Strain Tensor Imaging (STI) maps (see Figure 5). Although the mathematics of STI and DTI are very similar, their physical interpretation differs substantially. DTI represents microstructural tissue organization, whereas STI describes mechanical strain induced in the tissue by heartbeat-related blood volume pulsations. STI yields both positive and negative eigenvalues, whereas DTI only has positive eigenvalues. We therefore showed both the positive principal strains (maximum expansion) and negative principal strains (maximum compression reflecting the Poisson effect), respectively. The STI maps showed similar trends for all subjects. The positive principal strain direction not only follows the known brain motion pattern (funnel shaped, pointing towards the foramen magnum13), but also largely follows the direction of the fiber bundles represented in the DTI maps. The corpus callosum fiber bundles (running from left to right, see middle slice), however, do not expand along their orientation but perpendicular to it. Future work needs to incorporate registration and EPI distortion correction, together with a more rigorous comparison between the diffusion and strain tensors throughout the brain.Discussion
Strain tensor imaging can be performed by using a single-shot multi-slice DENSE sequence. Together with high-sensitive motion encoding, this yields sufficient SNR in the displacement maps to compose the gradient displacement tensor from which the 3D strain tensor can be computed. First results in four subjects show similar maps of the strain tensor. This novel approach may serve as a physiological marker to study the brain tissue mechanics and physiological blood volume dynamics in the brain.Acknowledgements
The research leading to these results was supported by Vici Grant 918.16.616 from the Netherlands Organization for Scientific Research (NWO); the European Research Council under the European Union's Seventh Framework Programme (FP7/2007-2013) / ERC grant agreement n°337333 and the European Union’s Horizon 2020 research an innovation programme under grant agreement no. 666881.References
1. Hirsch, S. et al. In vivo measurement of volumetric strain in the human brain induced by arterial pulsation and harmonic waves. Magn. Reson. Med. 70, 671–682 (2013).
2. Weaver, J. B. et al. Brain mechanical property measurement using MRE with intrinsic activation. Phys. Med. Biol. 57, 7275–7287 (2012).
3. Mestre, H., Kostrikov, S., Mehta, R. I. & Nedergaard, M. Perivascular spaces, glymphatic dysfunction, and small vessel disease. Clin. Sci. 131, 2257–2274 (2017).
4. Bakker, E. N. T. P. et al. Lymphatic Clearance of the Brain: Perivascular, Paravascular and Significance for Neurodegenerative Diseases. Cell. Mol. Neurobiol. 36, 181–194 (2016).
5. Aletras, A. H., Ding, S., Balaban, R. S. & Wen, H. DENSE: Displacement Encoding with Stimulated Echoes in Cardiac Functional MRI. J. Magn. Reson. 137, 247–252 (1999).
6. Soellinger, M., Rutz, A. K., Kozerke, S. & Boesiger, P. 3D cine displacement-encoded MRI of pulsatile brain motion. Magn. Reson. Med. 61, 153–162 (2009).
7. Adams, A. L., Kuijf, H. J., Viergever, M. A., Luijten, P. R. & Zwanenburg, J. J. M. Quantifying cardiac-induced brain tissue expansion using DENSE. NMR Biomed. 32, e4050 (2019).
8. Sloots, J. J., Luijten, P. R., Biessels, G. J. & Zwanenburg, J. J. M. Cardiac and Respiratory induced 3D Brain Tissue Strain as Marker of Physiological Blood Volume Dynamics at 7T MRI . ISMRM Proc. 2799 (2019).
9. Barth, M., Breuer, F., Koopmans, P. J., Norris, D. G. & Poser, B. A. Simultaneous multislice (SMS) imaging techniques. Magn. Reson. Med. 75, 63–81 (2016).
10. Sloots, J. J., Adams, A. L., Luijten, P. R., Biessels, G. J. & Zwanenburg, J. J. M. Unraveling cardiac and respiratory contributions to brain tissue motion using single shot 2D DENSE at 7T MRI. ISMRM Proc. 2, 368 (2018).
11. Fung, Y. C. (Yuan-cheng). A first course in continuum mechanics : for physical and biological engineers and scientists. (Prentice Hall, 1994).
12. Basser, P. J., Mattiello, J. & LeBihan, D. MR diffusion tensor spectroscopy and imaging. Biophys. J. 66, 259–267 (1994).
13. Greitz, D. et al.
Pulsatile brain movement and associated hydrodynamics studied by magnetic
resonance phase imaging. The Monro-Kellie doctrine revisited. Neuroradiology
34, 370–80 (1992).
Figures