0534
Low b-value DTI for Analyzing Pseudo-random Flow of CSF1Healthcare Business Unit, Hitachi, Ltd., Tokyo, Japan, 2Research and Development Group, Hitachi, Ltd., Tokyo, Japan, 3Department of Diagnostic Imaging, Hokkaido University Graduate School of Medicine, Sapporo, Japan
Synopsis
Cerebrospinal fluid (CSF) plays an important role in the clearance system of the brain. Low b-value DTI is reported to be useful for observing the CSF flow; however, the precise flow property observed by low b-value DTI has not been fully investigated. We proposed a mathematical framework of low b-value DTI for analyzing a pseudo-random flow and applied this framework to investigation into CSF. Measured DTI shows high and anisotropic diffusivity, representing large variance of flow velocity, in some segments of CSF. It demonstrates that low b-value DTI can be used for analyzing pseudo-random flow of CSF.
Introduction
Neurofluids, including cerebrospinal fluid (CSF) and interstitial fluid (ISF), have been attracting a lot of attention because they deeply relate to the clearance of waste products in the brain, and thus, to several neuronal diseases including Alzheimer’s1. Recently, low b-value diffusion tensor imaging (DTI) has been used for measuring the CSF flow in the perivascular space around the middle cerebral artery (MCA) of rats2 and a human3, and was reported to be useful for observing “stirred” (i.e. pseudo-random flow of) CSF of a human4. However, the precise flow property observed by the low b-value DTI has not been fully investigated. The purpose of this study was to propose a mathematical framework of the low b-value DTI for analyzing pseudo-random flow, and to apply the framework to investigation of CSF physiology.Theory
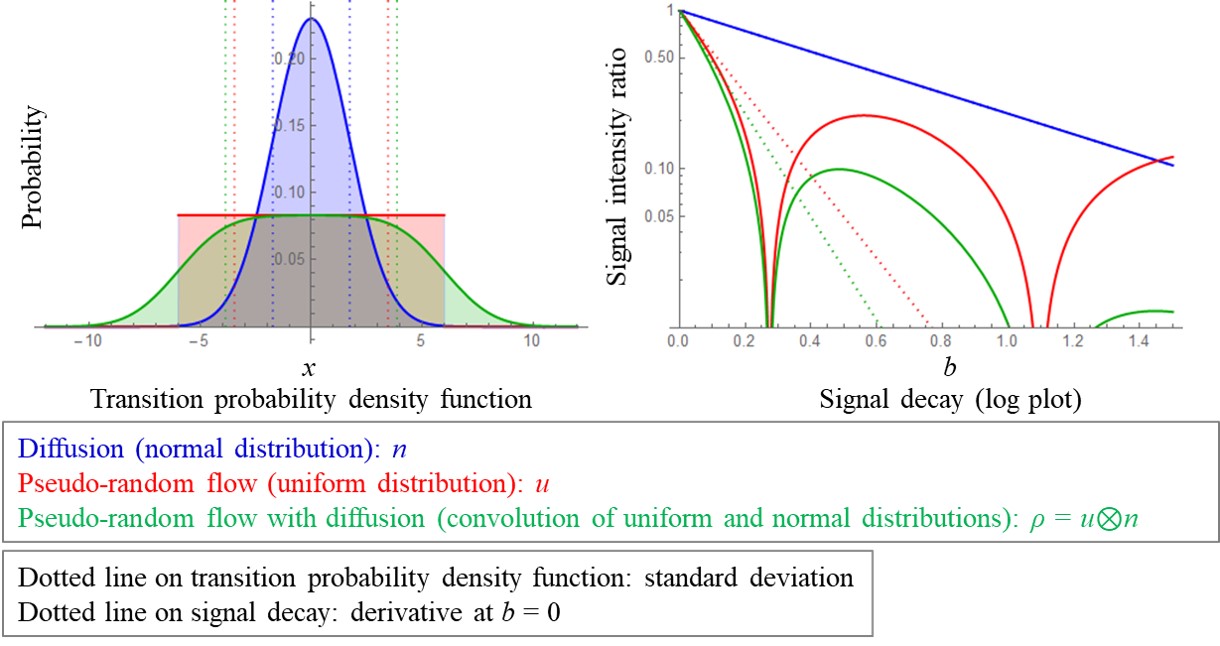
Pseudo-random flow can be approximated as linearly moving molecules if the moving time and voxel sizes are small enough. Diffusion-weighted signal intensity Sb of the pseudo-random flow can be described as the following equation:$$\begin{eqnarray}S_{b}&=&S_{0}\int_{-\infty}^{\infty}e^{-i\gamma G\delta\Delta x}\rho\left(x\right)dx\\&=&S_{0}\int_{-\infty}^{\infty}\left[1+\frac{-i\left(\gamma G\delta\Delta\right)x}{1!}-\frac{\left(\gamma G\delta\Delta\right)^{2}x^{2}}{2!}+O\left(3\right)\right]\rho\left(x\right)dx\\&=&S_{0}\int_{-\infty}^{\infty}\left[1-\frac{\Delta bx^{2}}{2}+O\left(3\right)\right]\rho\left(x\right)dx,\quad [1]\end{eqnarray}$$
where G, δ, and Δ are amplitude, duration, and separation of diffusion gradient, respectively; b = γ2G2δ2Δ, x is a spatial position, and ρ is a transition probability density function of the pseudo-random flow at the unit time. The mean of ρ can be assumed to be zero because it only changes the signal phase. The limit of apparent diffusion coefficient (ADC) as b decreasing to zero can be calculated using the following equation:
$$ \lim_{b\rightarrow 0}\left[\frac{1-\log\left(S_{b}/S_{0}\right)}{b}\right]=\lim_{b\rightarrow 0}\left[\frac{1}{b}\int_{-\infty}^{\infty}\left(\frac{\Delta bx^{2}}{2}+O\left(3\right)\right)\rho\left(x\right)dx\right]=\frac{\Delta}{2}Var\left(\rho\right).\quad [2]$$
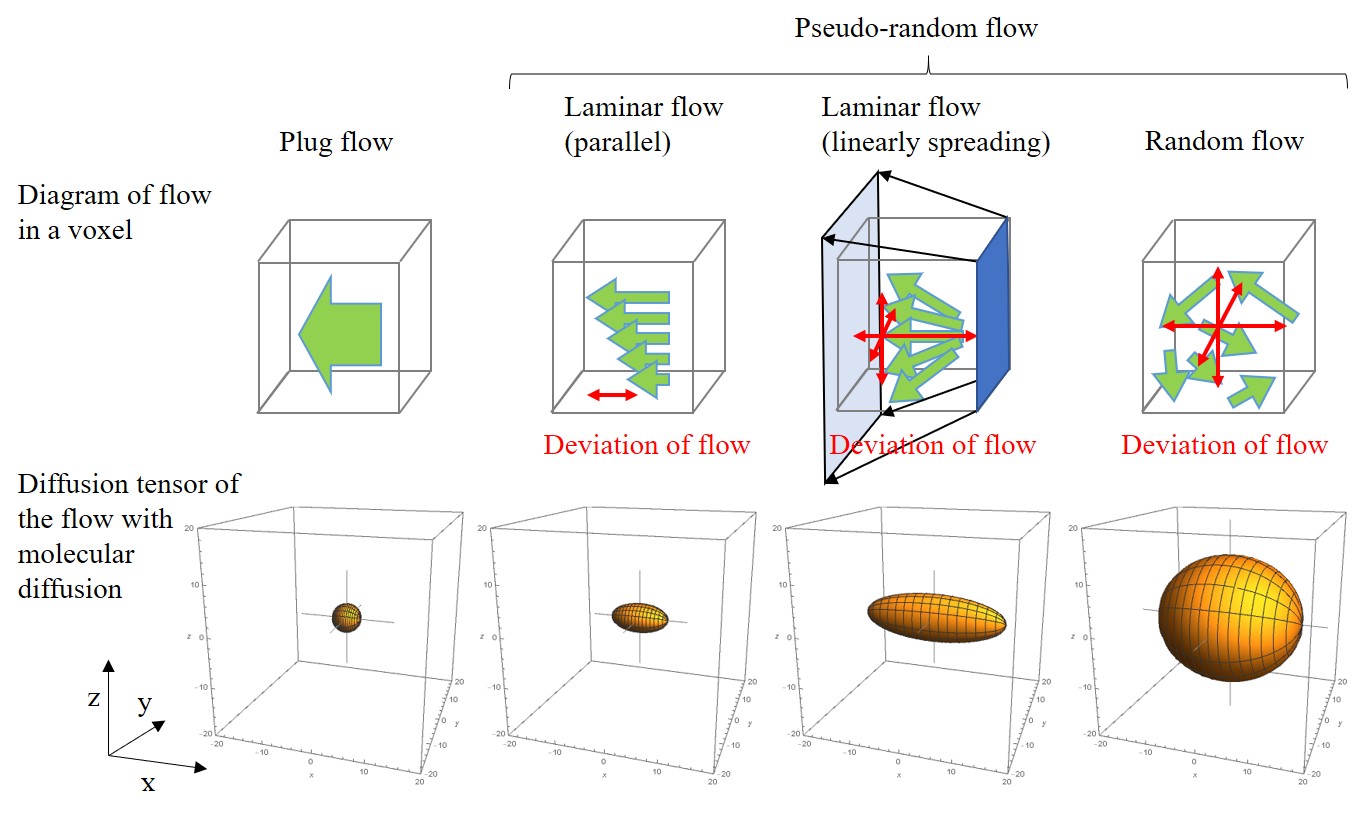
This equation means that the low b-value DTI can estimate the variance/2 of the transition distribution of the pseudo-random flow when b is small enough. Equations [1] and [2] are validated using typical one-dimensional pseudo-random flow, represented as a combination of uniform distribution and free water diffusion (Fig. 1). Diffusion tensors of typical three-dimensional pseudo-random flows, i.e. plug, parallel laminar, linearly spreading laminar, and random flows, are calculated using Eq. [2] (Fig. 2). These calculations show that the low b-value DTI can provide covariance of flow velocity with molecular diffusion, which indicates how intensively the fluid is stirred locally.
Methods
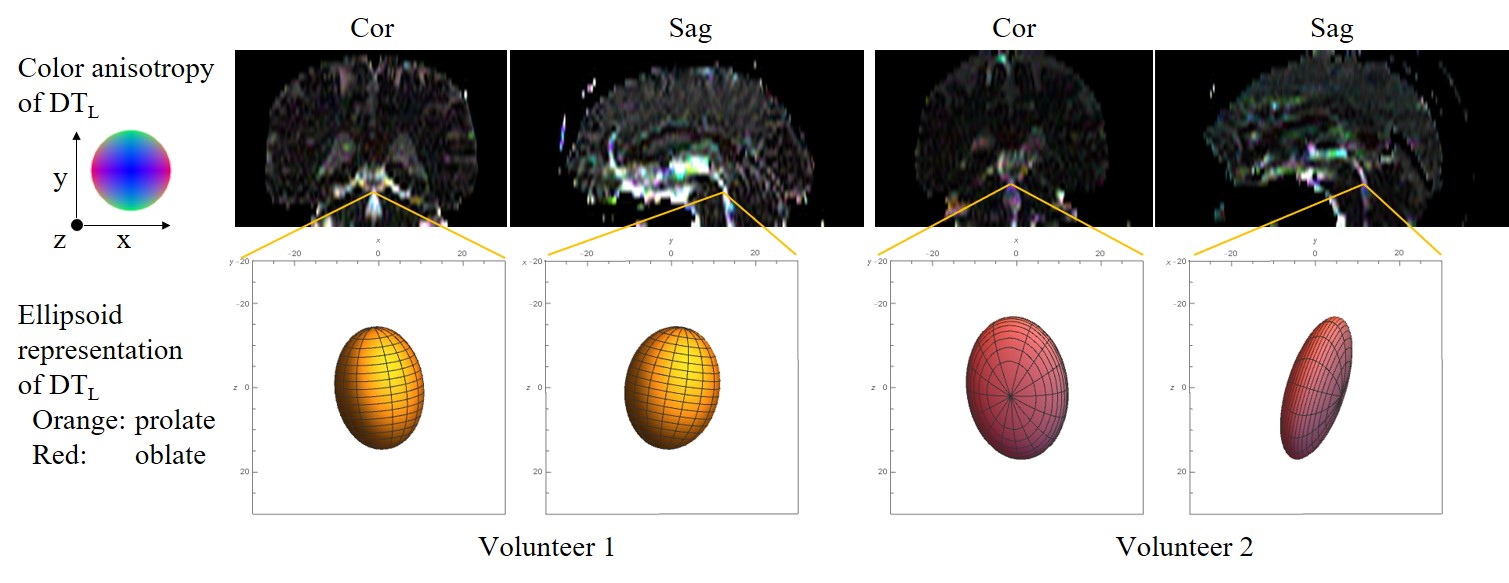
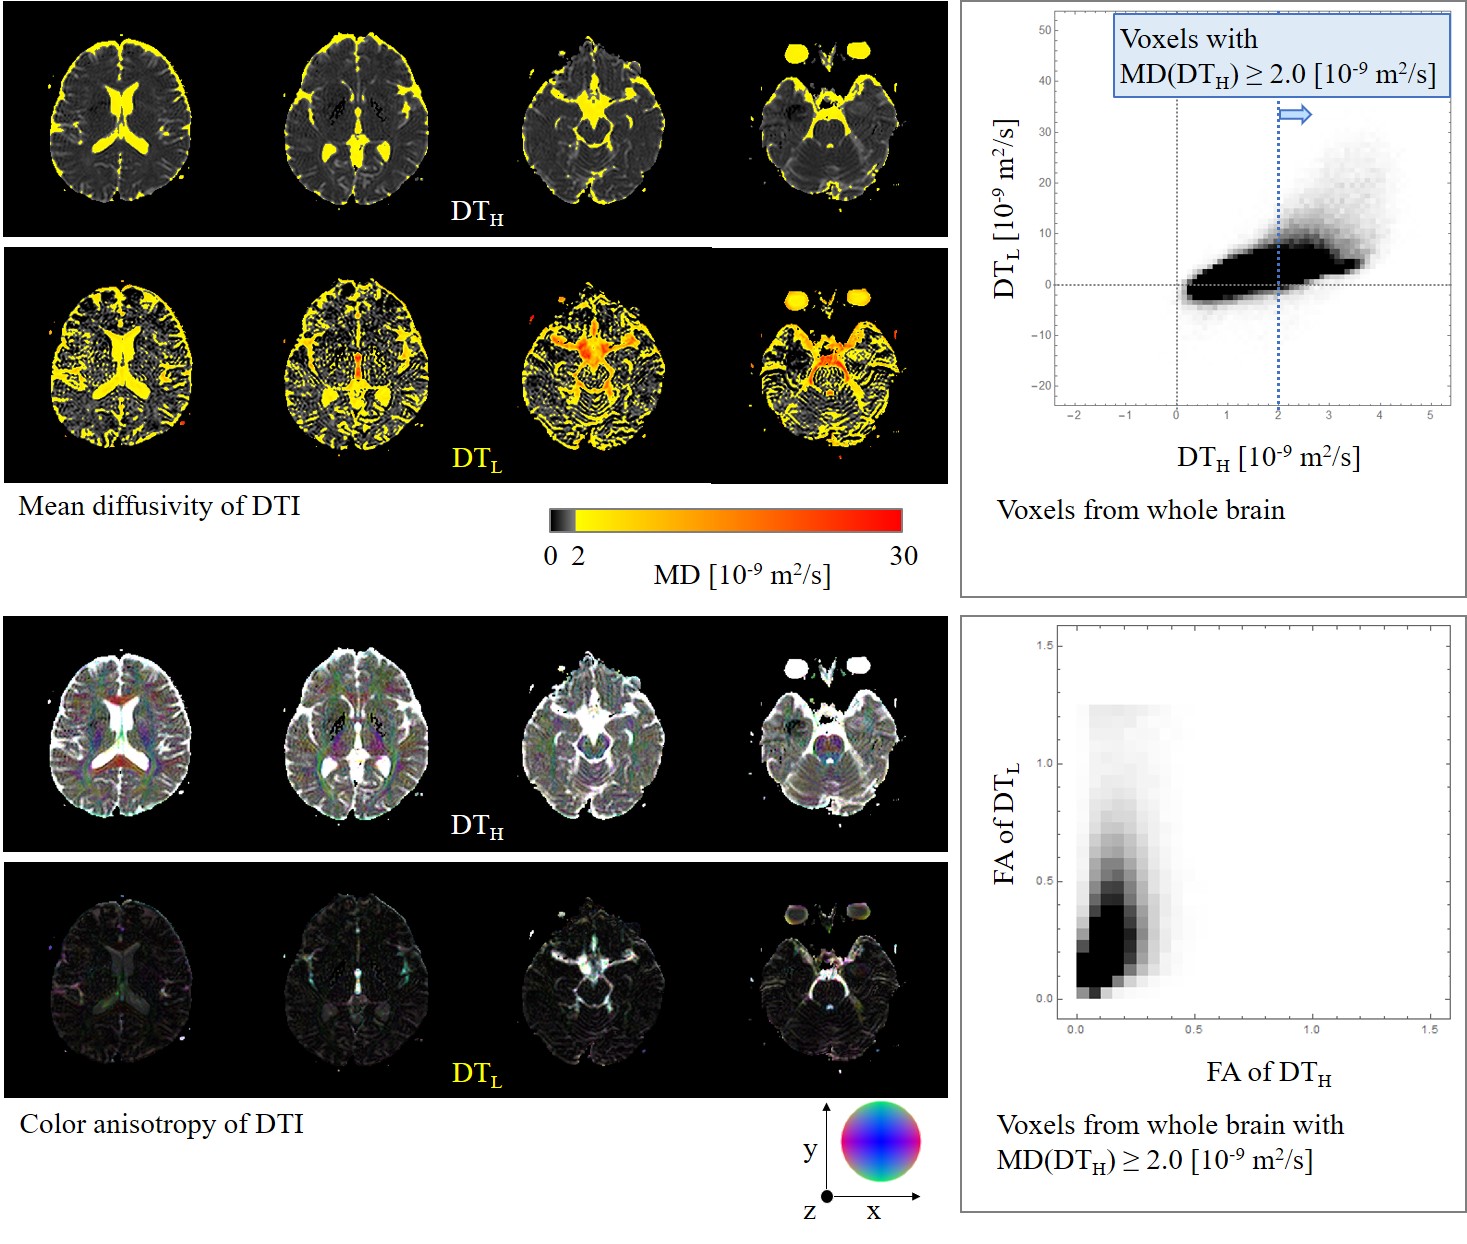
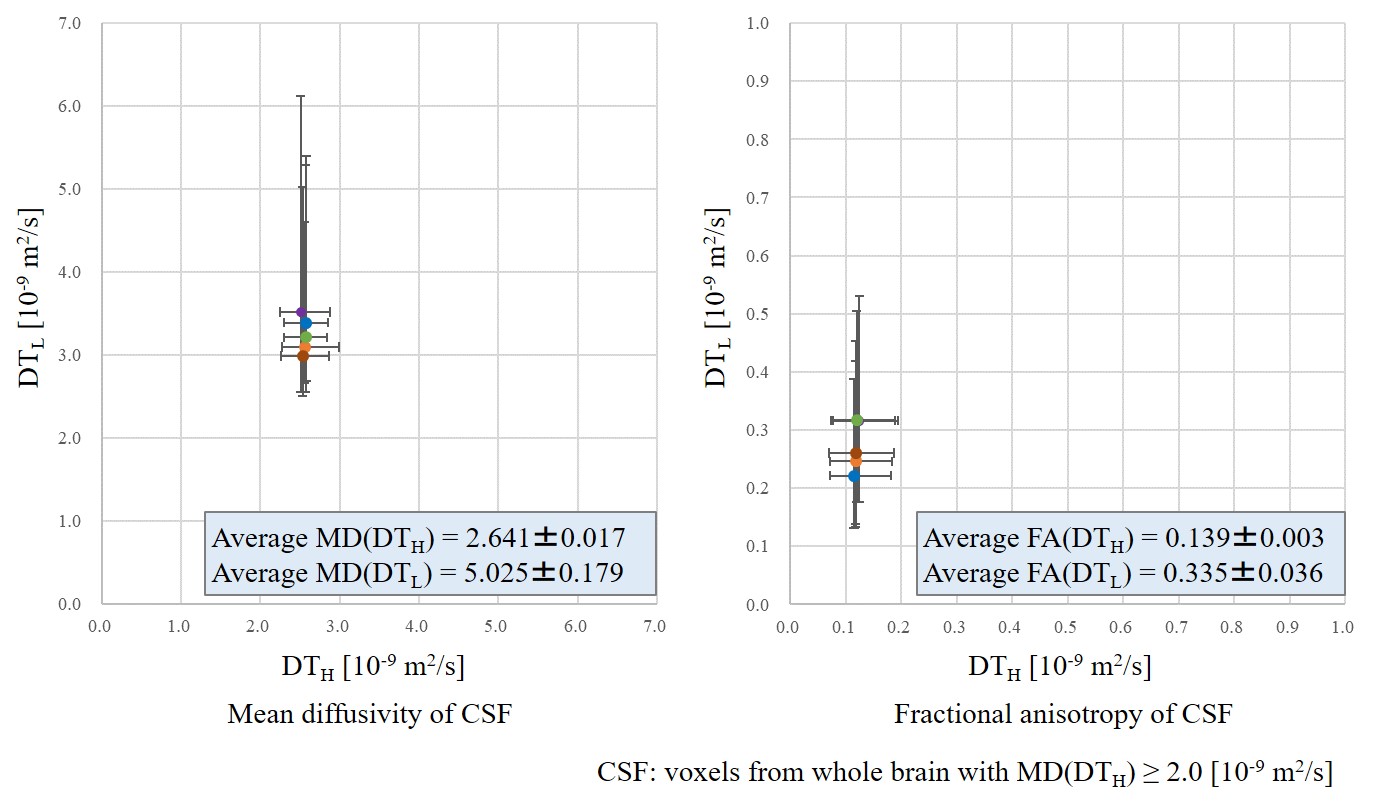
This study was approved by the ethics committee of Hitachi Group. Five healthy volunteers were scanned using a 3-T MRI (Hitachi, Ltd., Tokyo, Japan). Diffusion-weighted echo-planar imaging was performed with TR = 10 s, TE = 90 ms, FOV = 240 mm, matrix = 256 × 256, slice thickness = 4 mm, number of slice = 30, and b = 0/100/1000 ×106 s/m2 with 15 directions. Two diffusion tensors (DTs) were calculated: low b-value DT (DTL) using b: 0-100 and high b-value DT (DTH) using b: 0-1000. To analyze a typical pseudo-random flow of CSF, eigenvalues of DTL were calculated and shown as ellipsoids at the entering regions of the fourth ventricle from the aqueduct. To analyze the pseudo-random flow and diffusion properties of the entire CSF in the brain, mean diffusivity (MD) and fractional anisotropy (FA) were calculated and compared between DTL and DTH.Results and Discussion
Measured DTL at the entering region of the fourth ventricle from the aqueduct shows good agreement with the theoretical diffusion tensor of pseudo-random flows (Fig. 3). Obtained ellipsoidal shapes are thought to involve a linearly spreading flow and a parallel laminar flow, whereas the difference in ellipticity between volunteers 1 and 2 could be reflecting the different spreading directions in the fourth ventricle. These results demonstrate that the proposed mathematical framework can be applied to the analysis of CSF in vivo.DTL shows much higher MD and FA compared to DTH in CSF around the foramen of Monro, the MCA, the prepontine cistern, and the aqueduct (Fig. 4). Density scatter plots of MD and FA clearly show a portion of CSF having high and anisotropic DTL. Quartiles of MD and FA of CSF for each DTL and DTH were calculated for five volunteers (Fig. 5). DTL shows higher and more diverse MD and FA compared to DTH. The high and anisotropic DTL representing intensive pseudo-random flow in CSF might be caused by (1) the bulk flow in complex channels of CSF and (2) the beating artery and parenchyma driven by pulsation.
The proposed mathematical framework does not explicitly deal with a turbulent flow; but treats it as a random flow or as a part of laminar flow. The turbulent flow should be considered if the flow velocity of CSF and the voxel size increase. The low b-value should be optimized to sufficiently approximate the variance of the transition distribution while maintaining a precision of measured ADC. Although further improvement is needed in both mathematical framework and measurement technique, the low b-value DTI can be useful in investigating the clearance system of the brain by analyzing the pseudo-random flow of CSF.
Conclusion
A mathematical framework of low b-value DTI was presented and applied to analysis on pseudo-random flow of CSF. The low b-value DTI shows extremely high and anisotropic diffusivity, representing large covariance of velocity, in some segments of CSF. The low b-value DTI will shed a light on the clearance system in the brain from locally “stirred” CSF.Acknowledgements
No acknowledgement found.References
1. Iliff JJ, et al. A paravascular pathway facilitates CSF flow through brain parenchyma and the clearance of interstitial solutes, including amyloid β. Sci Transl Med 2012; 4: 147ra111.
2. Harrison IF, et al. Non-invasive imaging of CSF-mediated brain clearance pathways via assessment of perivascular fluid movement with diffusion tensor MRI. eLIFE 2018; 7: e34028.
3. Hirschler L, et al. High resolution T2-prepared MRI enables non-invasive assessment of CSF flow in perivascular spaces of the human brain. ISMRM 2019; 746.
4. Bito Y, et al. Stirred CSF measured by low b-value DTI. ISMRM 2019; 1045.
Figures