0532
Subvoxel Vascular Imaging of the Midbrain Using USPIO-Enhanced MRI1Department of Radiology, Wayne State University, Detroit, MI, United States, 2Magnetic Resonance Innovations, Inc., Detroit, MI, United States, 3Department of Neurology, Pusan National University School of Medicine, Yangsan, Korea, Republic of, 4Department of Neurology, Wayne State University, Detroit, MI, United States, 5Department of Radiology, New York University School of Medicine, New York, NY, United States
Synopsis
We demonstrate the utility of low dose Ferumoxytol in microvasculature imaging of the midbrain using susceptibility weighted imaging (SWI). Mapping the brain’s vasculature has implications for understanding the etiology of many neurovascular and neurodegenerative diseases such as Parkinson’s disease. By administering this strongly paramagnetic agent, SWI was able to visualize both arteries and veins; and its sensitivity to detect sub-voxel vessels increased tremendously. However, the use of Ferumoxytol exacerbates the signal loss of large vessels, confounding the ability to visualize nearby smaller vessels. Hence, we propose the use of multiple time point SWI to effectively see through the blooming artifacts.
Introduction
The substantia nigra (SN) plays a pivotal role in enabling the coordination of smooth movements in humans.1 It is not surprising that an ample amount of blood supply is required to meet such an energy demand.2-4 It can be inferred that insufficient blood supply could cause dopaminergic neuron dysfunction in the SN. The increase of microvascular change such as string vessels in SN and decrease of cerebral blood flow observed in patients with Parkinson’s disease (PD) could be an indication that vascular dysfunction may be an underlying pathophysiology leading to neurodegeneration in PD.5-7 However, it is unclear if and when vascular changes precede development of neurodegeneration. Therefore, it is quintessential to trace back the changes in cerebral microvasculature that manifest early in preclinical/prodromal phases and follow the individual longitudinally in the clinical phase of PD.8 In this work, ultra-small superparamagnetic iron oxides (USPIO) were used to induce a susceptibility in the arteries (as well as increase the susceptibility in the veins over and above that caused by deoxyhemoglobin).9 With this increase in susceptibility comes the potential to make small sub-voxel vessels visible. In order to overcome the strong signal loss for large vessels, we acquired susceptibility weighted imaging (SWI) data at different time points during the gradual administration of the USPIO agent, Ferumoxytol.Methods
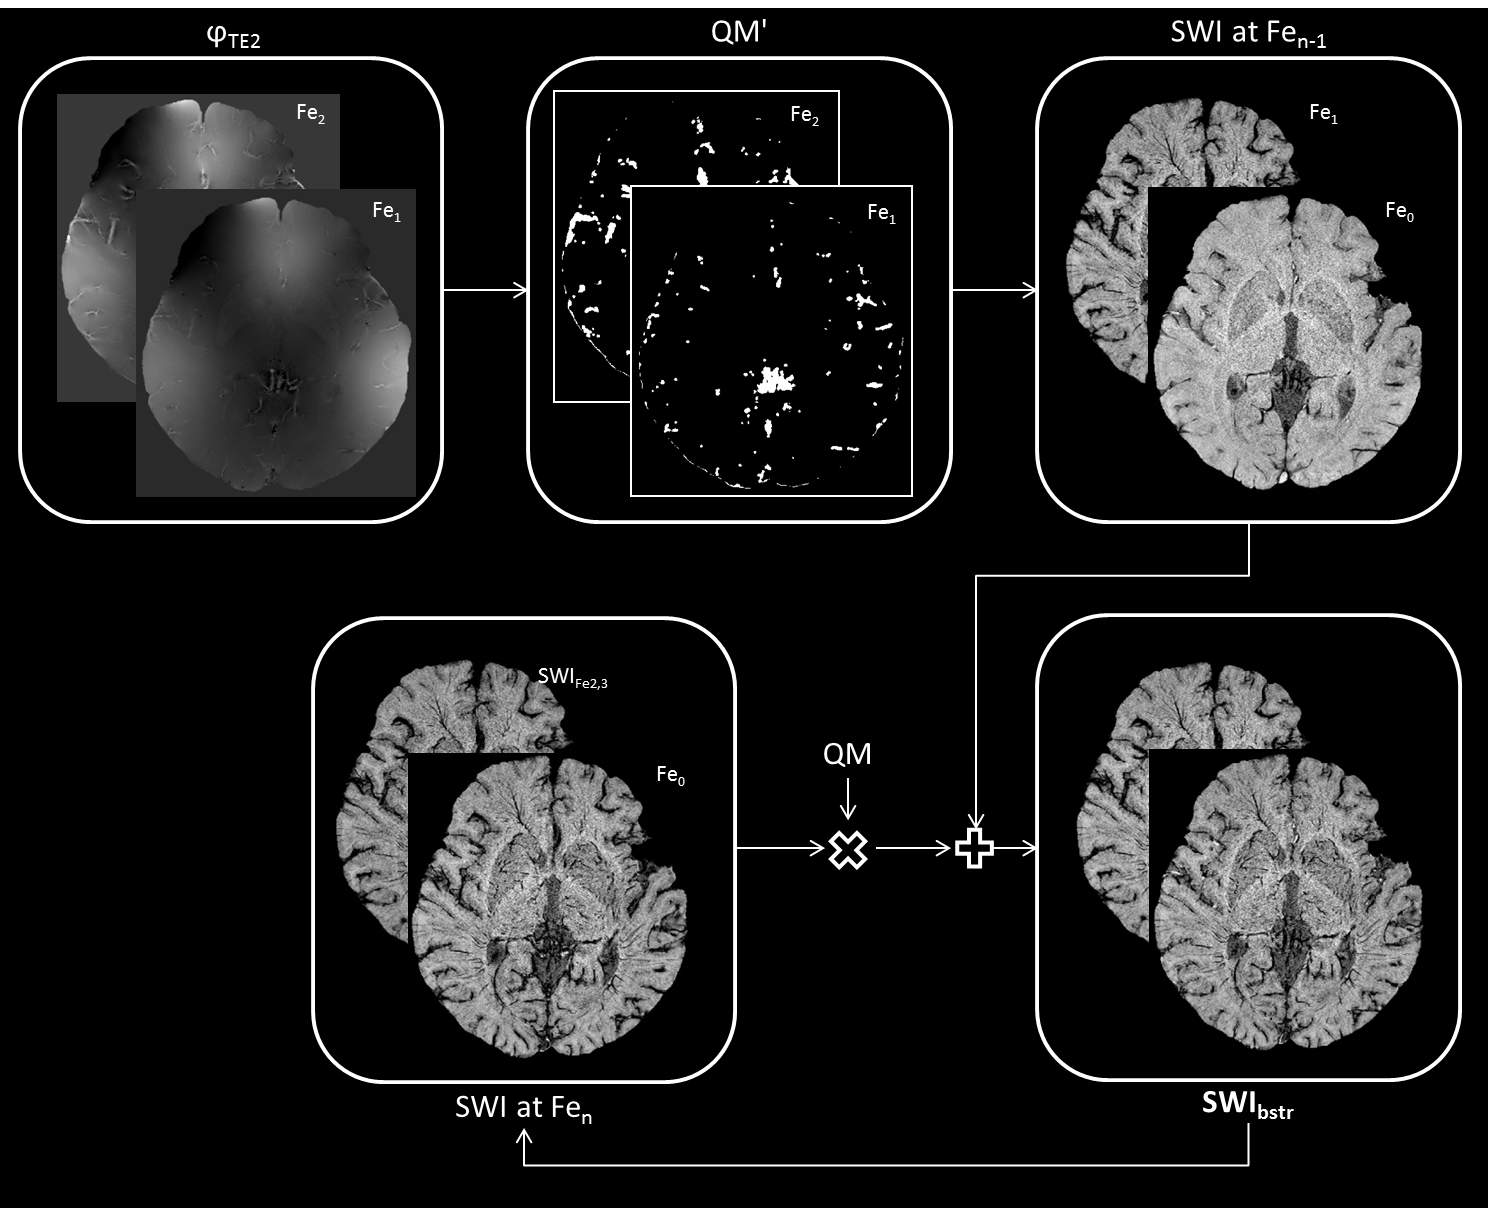
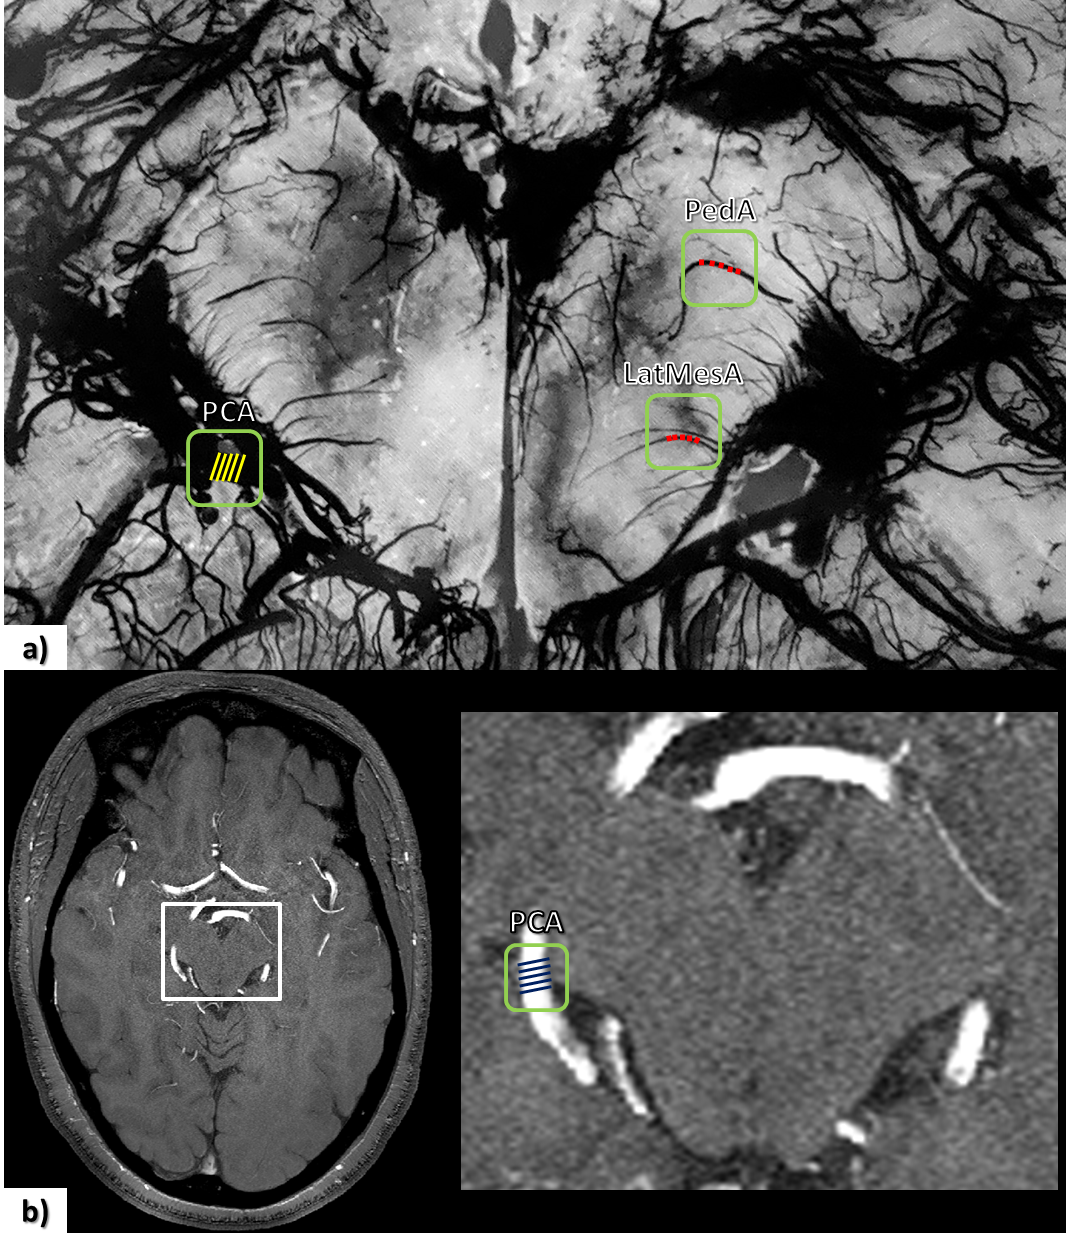
Eleven healthy volunteers were scanned with a dual echo SWI sequence at four time points: the first was acquired pre-contrast (Fe0) and the remaining three were acquired post-contrast at intervals of 11mins (Fe1, Fe2 and Fe3) during a gradual increase in dose (rate=180-185ml/hr, final Ferumoxytol concentration=4mg/kg); with the imaging parameters: TE1/TE2/TR=7.5/15/27ms, bandwidth=180Hz/pxl, flip angle=15o (Fe0 and Fe3) and 20o (Fe1 and Fe2); with a voxel resolution=0.22×0.44×1mm3. SWI images were generated by homodyne high-pass filtering (filter size=96×96) the phase images to generate a phase mask (multiplication factor=4).10 The phase data were unwrapped using the 3D best path method.11 All the magnitude, unwrapped phase and SWI data at time points Fe1, Fe2 and Fe3 were registered to Fe0 magnitude data. All four time points were combined to create a bootstrapped image of SWI (SWIbstr). SWI data for the Fe2 and Fe3 time points were averaged to obtain an improved SWI data (SWIFe2,3) with higher SNR. The regions with strong phase change were masked out on SWIFe2,3 data and were replaced with that of the previous time points (Fe1 and Fe0). A phase quality map was used to identify these regions of strong phase gradient (Δφ > 1.8radians), starting from the phase at Fe2 and then moving to Fe1 (Figure 1). The ratio of posterior cerebral artery (PCA) to a peduncular artery (PedA) and lateral mesencephalic artery (LatMesA) was estimated using the histology work by Salamon.12Results
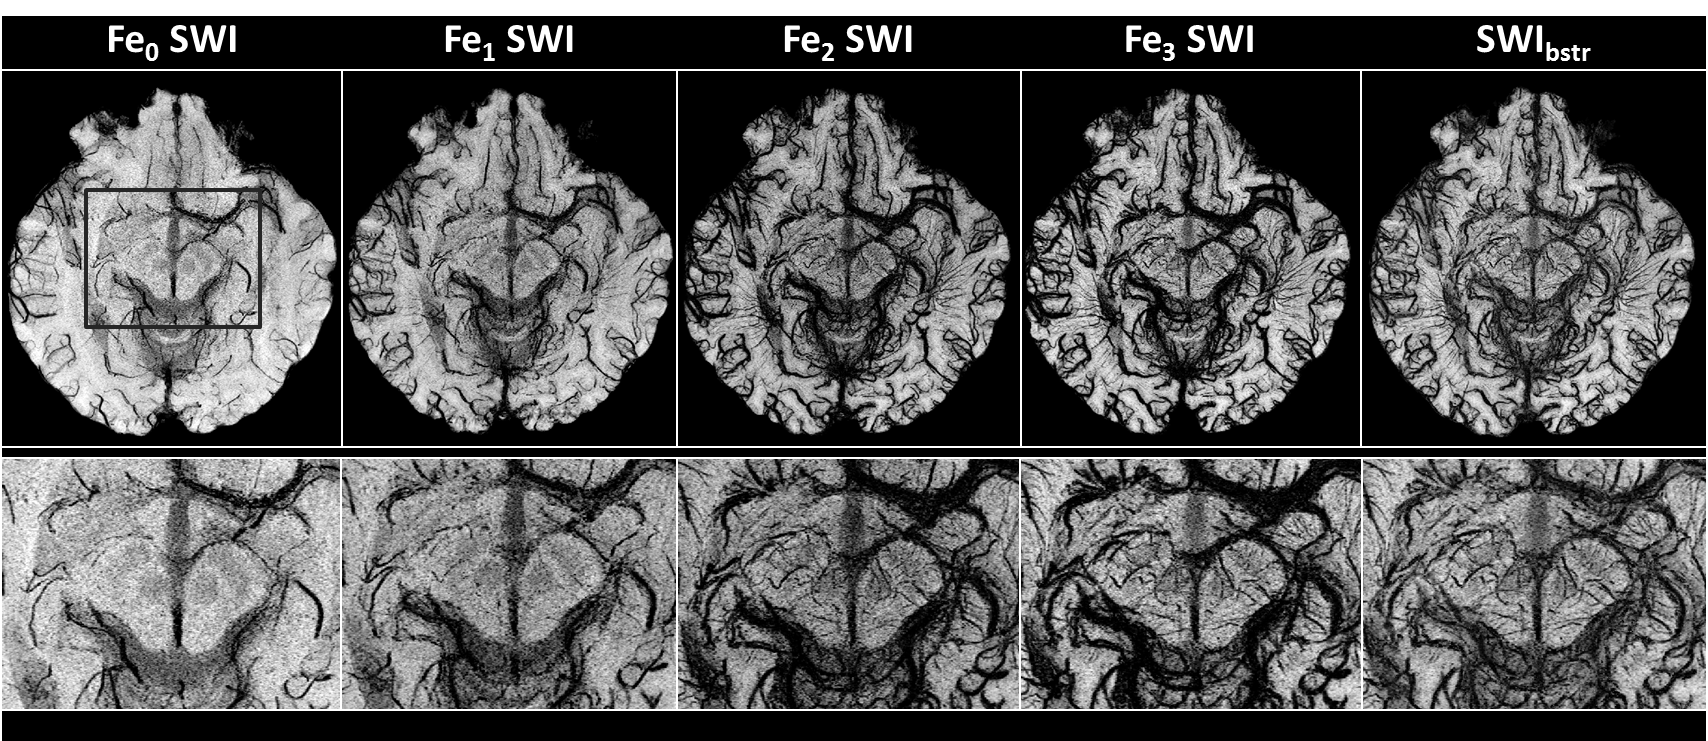
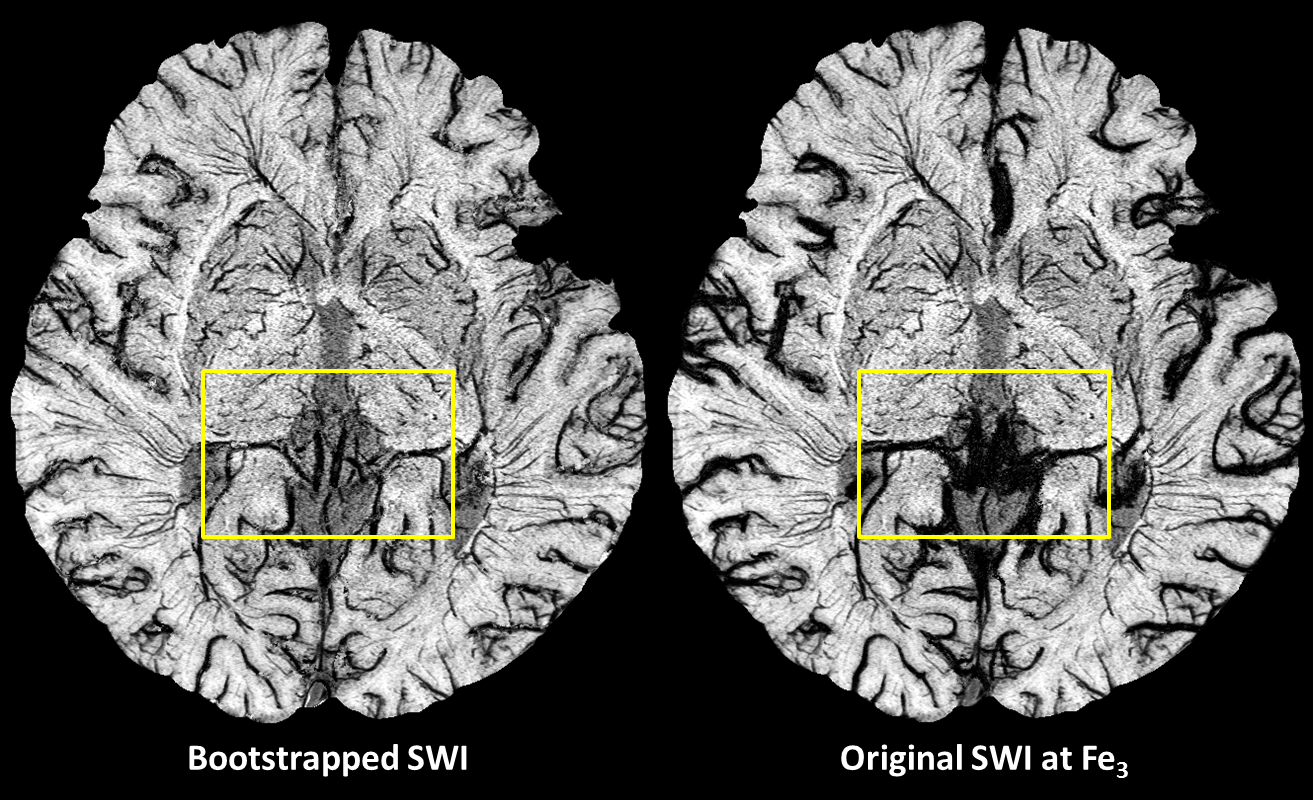
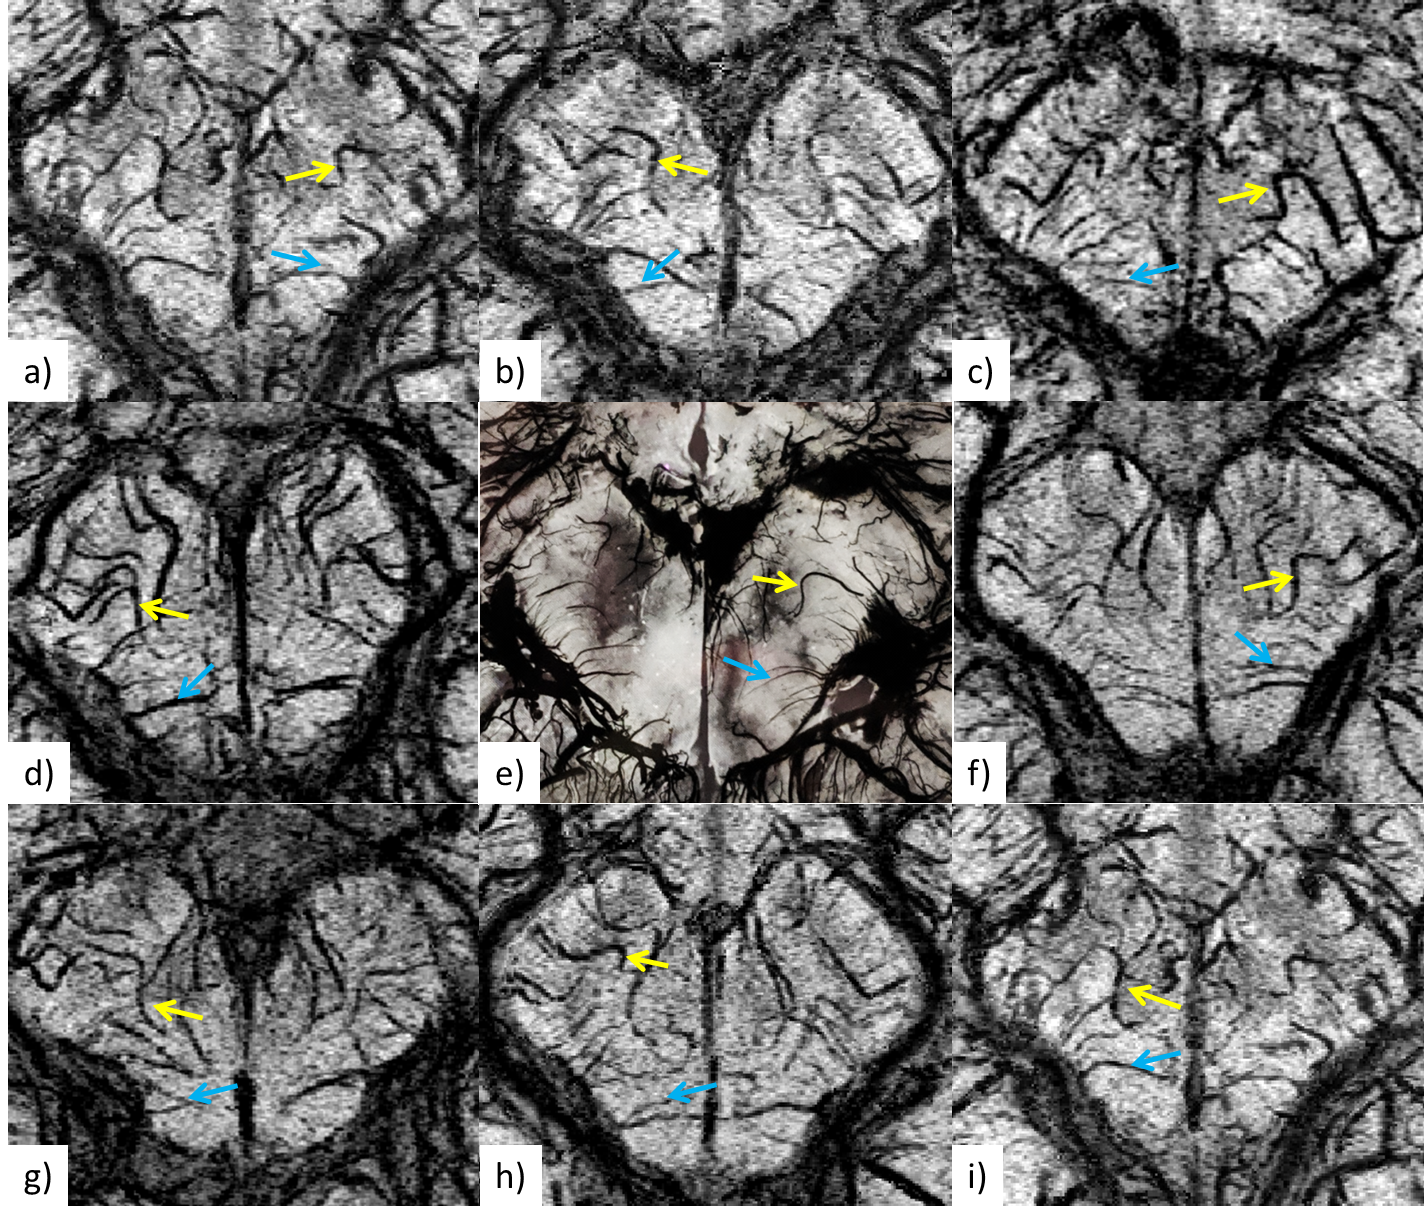
An example of pre-contrast (Fe0) and post-contrast (Fe1 to Fe3) SWI data shows the gradual enhancement of the sub-voxel mid-brain vasculature (Figure 2). Ferumoxytol at relatively higher doses (4mg/kg at Fe3) provides much better visualization of the smaller vessels. However, the signal loss around larger vessels was exacerbated due to high susceptibility of Ferumoxytol. On the other hand, the SWIbstr provided better delineation of larger vessels and preserved the visibility of the smaller or subvoxel vessels (Figure 3). SWIbstr data at Fe3 and previous histological data12 showed good agreement (Figure 4). PedA (yellow arrow) and LatMesA (blue arrow) were identified for each subject. The vessel diameter ratio from histology was calculated to be 7:1 and 14:1 for PCA:PedA and PCA:LatMesA, respectively (Figure 5). From the in vivo data, PCA was measured to be 1.98±0.44mm across. Based on the histology ratios and the in vivo PCA diameter, the estimated size of PedA and LatMesA were ~0.28mm and ~0.10mm.Discussion
SWI is a powerful tool to image the sub-voxel veins. However, it is insensitive to arteries in their natural form, which results in no susceptibility contrast with respect to the surrounding tissue. By administering a strongly paramagnetic agent, SWI was able to detect both arteries and veins; and its sensitivity to detect sub-voxel objects increased tremendously. This is due to both the increased dephasing/blooming artifact as well as to the special processing from SWI that uses the phase information. Using a resolution of 0.22×0.44×1mm3, we were able to detect small vessels on the order of 50μ to 100μ. Although it is possible to acquire the data with a higher voxel resolution, the SNR will be reduced and this hinders visualization of the vessels, especially in the center of the brain. With strong blooming effects, Ferumoxytol-enhanced SWI can circumvent both insufficient spatial resolution and contrast for very small vessels, thus offering the capability of imaging micro-vessels. Furthermore, by acquiring the SWI data at multiple time points, the resultant combined SWI data was able to visualize the presence and shape of these small vessels.Conclusion
In this work, we demonstrated the utility of low dose Ferumoxytol in imaging the microvasculature of the midbrain using SWI. Mapping the vasculature of the brain has immediate implications for understanding the etiology of many neurovascular and neurodegenerative diseases. The proposed combination of SWI data, from multiple time points, proved to be essential for reducing the blooming artifacts surrounding the larger vessels.Acknowledgements
This work was supported in part by the National Institute of Health (NIH) (grant number: 1R01NS108491-01). The authors would like to thank Zahid Latif, our MRI technician, for his efforts in collecting and organizing the data. The authors would also like to thank the participants that volunteered for this study.References
1. Guzman JN, Sánchez-Padilla J, Chan CS, Surmeier DJ. Robust pacemaking in substantia nigra dopaminergic neurons. J Neurosci. 2009;29:11011-9. doi: 10.1523/JNEUROSCI.2519-09.2009.
2. Pacelli C, Giguère N, Bourque MJ, Lévesque M, Slack RS, Trudeau LÉ. Elevated Mitochondrial Bioenergetics and Axonal Arborization Size Are Key Contributors to the Vulnerability of Dopamine Neurons. Curr Biol. 2015;25:2349-60. doi: 10.1016/j.cub.2015.07.050.
3. Harris JJ, Jolivet R, Attwell D. Synaptic energy use and supply. Neuron. 2012 ;75:762-77. doi: 10.1016/j.neuron.2012.08.019.
4. Hofmeijer J, van Putten MJ. Ischemic cerebral damage: an appraisal of synaptic failure. Stroke. 2012;43:607-15. doi: 10.1161/STROKEAHA.111.632943.
5. Syrimi ZJ, Vojtisek L, Eliasova I, Viskova J, Svatkova A, Vanicek J, Rektorova I. Arterial spin labelling detects posterior cortical hypoperfusion in non-demented patients with Parkinson's disease. J Neural Transm (Vienna). 2017;124:551-557. doi: 10.1007/s00702-017-1703-1.
6. Al-Bachari S, Vidyasagar R, Emsley HC, Parkes LM. Structural and physiological neurovascular changes in idiopathic Parkinson's disease and its clinical phenotypes. J Cereb Blood Flow Metab. 2017;37:3409-3421. doi: 10.1177/0271678X16688919.
7. Yang P, Pavlovic D, Waldvogel H, Dragunow M, Synek B, Turner C, et al. String Vessel Formation is Increased in the Brain of Parkinson Disease. J Parkinsons Dis. 2015;5:821-36. doi: 10.3233/JPD-140454.
8. Noyce AJ, Lees AJ, Schrag AE. The prediagnostic phase of Parkinson's disease. J Neurol Neurosurg Psychiatry. 2016;87:871-8. doi: 10.1136/jnnp-2015-311890.
9. Liu S, Brisset J-C, Hu J, Haacke EM, Ge Y. Susceptibility weighted imaging and quantitative susceptibility mapping of the cerebral vasculature using ferumoxytol. J Magn Reson Imaging 2018; 47: 621–633.
10. Haacke E, Mittal S, Wu Z, Neelavalli J, Cheng Y-CN. Susceptibility-weighted imaging: technical aspects and clinical applications, part 1. Am J Neuroradiol 2009; 30: 19–30.
11. Abdul-Rahman HS, Gdeisat MA, Burton DR, Lalor MJ, Lilley F, Moore CJ. Fast and robust three-dimensional best path phase unwrapping algorithm. Appl Opt, AO 2007; 46: 6623–6635
12. Salamon. Atlas de la vascularisation arterielle du cerveau chez l’homme / atlas of the arteries of the human brain. Sandoz; 1971
Figures