0530
Synthetic T1rho dispersion imaging for improved myocardial tissue characterization using dispersion reconstruction1Department of Internal Medicine I, University Hospital Würzburg, Würzburg, Germany, 2Experimental Physics 5, University of Würzburg, Würzburg, Germany, 3Comprehensive Heart Failure Center (CHFC), University Hospital Würzburg, Würzburg, Germany
Synopsis
T1ρ dispersion imaging is a very time-consuming process because full T1ρ-mapping at different spin-lock amplitudes is required. Due to this issue, investigation of T1ρ dispersion is hardly feasible in the limited measurement time of a small animal experiment. In this work, we present a novel approach for the rapid measurement of cardiac T1ρ dispersion called dispersion reconstruction. With our new concept a T1ρ dispersion image is generated by only acquiring a fraction of the required mapping data. Phantom and in vivo experiments confirm the applicability of our new method as part of a conventional protocol for small animal studies.
Introduction
In the last decade, cardiac MRI became the imaging modality of choice for myocardial function measurements as well as locally resolved tissue characterization. Here, quantitative methods like T1 and T2 mapping are useful tools for a precise tissue characterization. Recently, numerous studies explored the alternative contrast mechanism of the spin-lattice relaxation time T1ρ [1,2,3]. Due to the high sensitivity to low frequency processes at the molecular and cellular level, native T1ρ-mapping might be superior for accurate tissue characterization. Moreover, T1ρ gives the possibility for dispersion measurements by manipulation of the effective spin-lock (SL) pulse amplitude, which enables additional contrast mechanisms. However, due to cardiac and respiratory motion, the generation of single myocardial T1ρ-maps is very time consuming. In consequence, the investigation of myocardial T1ρ dispersion is not feasible in the limited measurement time of a common in vivo experiment.In this work, we present a novel concept for myocardial T1ρ dispersion quantification. Our measurements are based on an accelerated cardiac T1ρ-mapping sequence and a new approach called dispersion reconstruction.
Theory
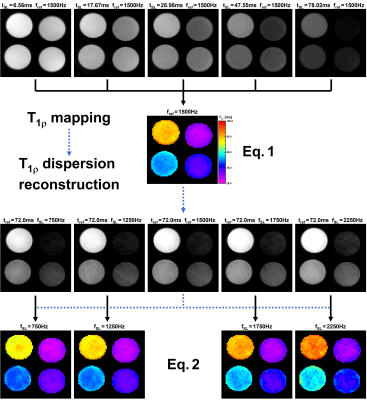
For T1ρ dispersion imaging, one typically needs to acquire a series of T1ρ-maps with various SL amplitudes fSL. With the new T1ρ dispersion reconstruction approach, a T1ρ dispersion image can be reconstructed by only acquiring a single T1ρ-map and a series of dispersion-weighted images (different fSL, constant SL time tSL). The concept is illustrated in Fig. 1. First, a reference T1ρ-map is acquired by varying tSL (constant amplitude fSL,const) and fitting a mono-exponential function:$$I_{map}=I\left(t_{SL},f_{SL,const}\right)=I_0\cdot\text{exp}\left[-\frac{t_{SL}}{T_{1\rho}(f_{SL,const})}\right]\;\;\;\;\;\text{Eq. 1}$$
Subsequently, several dispersion-weighted images are generated by the variation of fSL at a constant SL time tSL,const.
$$I_{disp}=I\left(t_{SL,const},f_{SL}\right)=I_0\cdot\text{exp}\left[-\frac{t_{SL,const}}{T_{1\rho}(f_{SL})}\right]$$
It is crucial that one of these images is acquired using the amplitude of the reference T1ρ-map.
$$I_{ref}=I\left(t_{ref},f_{ref}\right)=I_0\cdot\text{exp}\left[-\frac{t_{ref}}{T_{1\rho}(f_{ref})}\right],\,\,\,t_{ref}=t_{SL,const},\,\,\,f_{ref}=f_{SL,const}$$
Under this condition, a new synthetic T1ρ-map can be reconstructed from each dispersion-weighted image using the following equation:
$$T_{1\rho}(f_{disp})=\left(\frac{1}{T_{1\rho}(f_{ref})}-\frac{1}{t_{ref}}\cdot\text{log}\left[\frac{I_{disp}}{I_{ref}}\right]\right)^{-1}\;\;\;\;\;\text{Eq. 2}$$
The information thus obtained can then be used to calculate a dispersion map by pixel-wise fitting a suitable dispersion model (e.g. linear function).
Methods
All measurements were performed on a 7.0T small animal imaging system (Bruker BioSpec 70/30, BioSpin MRI GmbH, Ettlingen, Germany). Our novel dispersion reconstruction approach was validated in phantom as well as in in vivo experiments. T1ρ preparation was performed by totally-balanced-spin-locking (TB-SL) [4]. Acquisition of k-space was optimized for very fast myocardial imaging using a radial spoiled gradient echo readout (TE=1.9ms, TR=4.7ms). For every T1ρ-prepared image, data acquisition was segmented into 13 preparation experiments (identical tSL and fSL), each separated by a waiting time trec for magnetization recovery. Depending on the imaging mode, 8 different SL-prepared images with different tSL (T1ρ-mapping) respectively fSL (dispersion-weighting) were acquired.In the phantom measurements, 4 cylindrical sample tubes with various BSA concentrations were investigated and the dispersion reconstruction approach was compared with two common full-mapping techniques, once using the accelerated radial readout and once a conventional cartesian readout (in which 8 complete T1ρ-maps needs to be acquired). The waiting time trec was adjusted to 1000ms resulting in total measurement times of 3.5min (novel approach), 13.9min (full-mapping radial method) and 25.6min (full-mapping cartesian method). For the in vivo measurements, one SL preparation was performed in one heart beat (during end diastole) per respiratory cycle. Here, trec resulted in approximately 1100ms. A T1ρ-map and a synthetic T1ρ dispersion image was generated for testing the practicability and for investigation of the achievable image quality in vivo.
Results
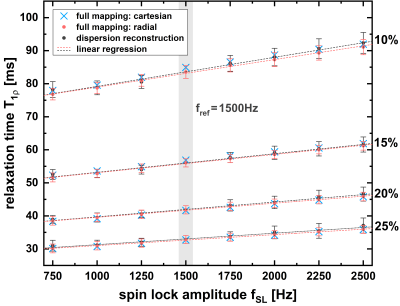
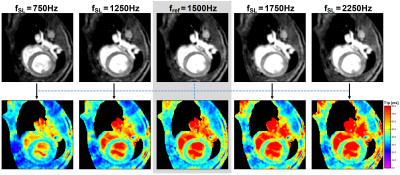
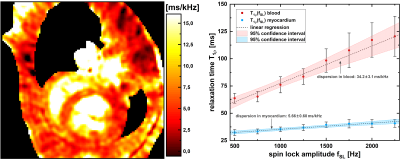
Fig. 2 shows the results of the phantom measurements. It is apparent that the common full-mapping cartesian and radial T1ρ dispersion methods as well as the novel dispersion reconstruction approach produce identical results with high reproducibility and accuracy. Mean deviation was 0.82%, 0.91%, 1.23% and 1.63% for the four different BSA phantoms. In Fig. 3 and 4 the results of the in vivo measurements are shown. In Fig. 3 the dispersion-weighted images and the reconstructed synthetic T1ρ-maps are depicted. Fig. 4 shows a synthetic T1ρ dispersion image and the determined dispersion behaviour of blood and myocardium. In myocardial tissue, T1ρ values increased from a minimum of 29.5ms to a maximum of 44.3ms with a mean slope of 5.66±0.60ms/kHz. The mean slope in the blood pool was determined to be 34.2±3.1ms/kHz.Discussion
In this work, a new synthetic dispersion imaging method is presented that is multiple times faster than common full-mapping techniques by comparable accuracy and usability. This acceleration is based on two steps. First, an acceleration of data sampling using optimized radial imaging, and second the implementation of the dispersion reconstruction procedure. Compared to the common cartesian full-mapping method, an acceleration by a factor of 7.4 was achieved. Furthermore, the experiments confirm the applicability of our new method in vivo, which enables the inclusion of T1ρ dispersion imaging in a conventional MRI study protocol. Due to the promising results using our new method, further studies on mice are in preparation for investigating the dispersion character of healthy and various diseased tissues. Moreover, our novel method is also feasible in clinical human MRI examinations, which are also planned in the near future.Acknowledgements
This work was supported by the Federal Ministry for Education and Research of the Federal Republic of Germany (BMBF 01EO1504, MO6)References
[1] Witschey et al. Magn Reson Med. 2010 Nov;64(5):1453-60
[2] van Oorschot et al. J Magn Reson Imaging. 2015 May;41(5):1181-9
[3] Kamesh Iyer et al. J Cardiovasc Magn Reson. 2019 Jan 10;21(1):5
[4] Gram et al. ISMRM Annual Meeting 2019. Montreal. #1215
Figures


