0528
Short T1 Measurement Using an Inversion Recovery Prepared Three-Dimensional Ultrashort Echo Time Cones (3D IR-UTE-Cones) Method1Department of Radiology, UC San Diego, San Diego, CA, United States, 2University of Chinese Academy of Sciences, Beijing, China, 3Institute of Electrical Engineering, Chinese Academy of Sciences, Beijing, China
Synopsis
In magnetic resonance imaging (MRI), T1 is an important biomarker for many diseases and plays a key role in affecting image contrast. We propose a novel T1 measurement method combining adiabatic inversion recovery with 3D ultrashort echo time cones pulse sequences (3D IR-UTE-Cones). This study aimed to verify the feasibility of using 3D IR-UTE-Cones to accurately calculate T1s of short T2* tissues. The results indicated that this method could precisely measure a broad range of T1s and that it performed better than commonly used clinical protocols in ultrashort T1 measurement.
Introduction
T1 plays a key role in MR image contrast and is an important biomarker for many diseases. In nanoparticle-based hyperthermia, T1 can be used as a biomarker to assess the concentration of iron-oxide nanoparticles (IONPs)1,2. In MRI-guided thermal ablation procedures (radiofrequency, laser, or focused ultrasound), T1 mapping can be used to monitor the tempreture3,4,5. Inversion recovery prepared ultrashort echo time (IR-UTE) pulse sequences have been used for high contrast imaging of short T2 tissues by suppressing signals from long T2 tissues6. IR-UTE sequences are able to provide not only high contrast morphological imaging, but also quantitative evaluation, such as proton density (PD), T2* mapping and T1 mapping of short T2 tissues7. This is especially important since short T2 tissues typically have short T1s, which are difficult to evaluate with conventional clinical sequences. In this study, we proposed a T1 quantification method based on the 3D IR-UTE-Cones pulse sequence for accurate estimation of short T1s and T1s of short T2 tissues.Methods
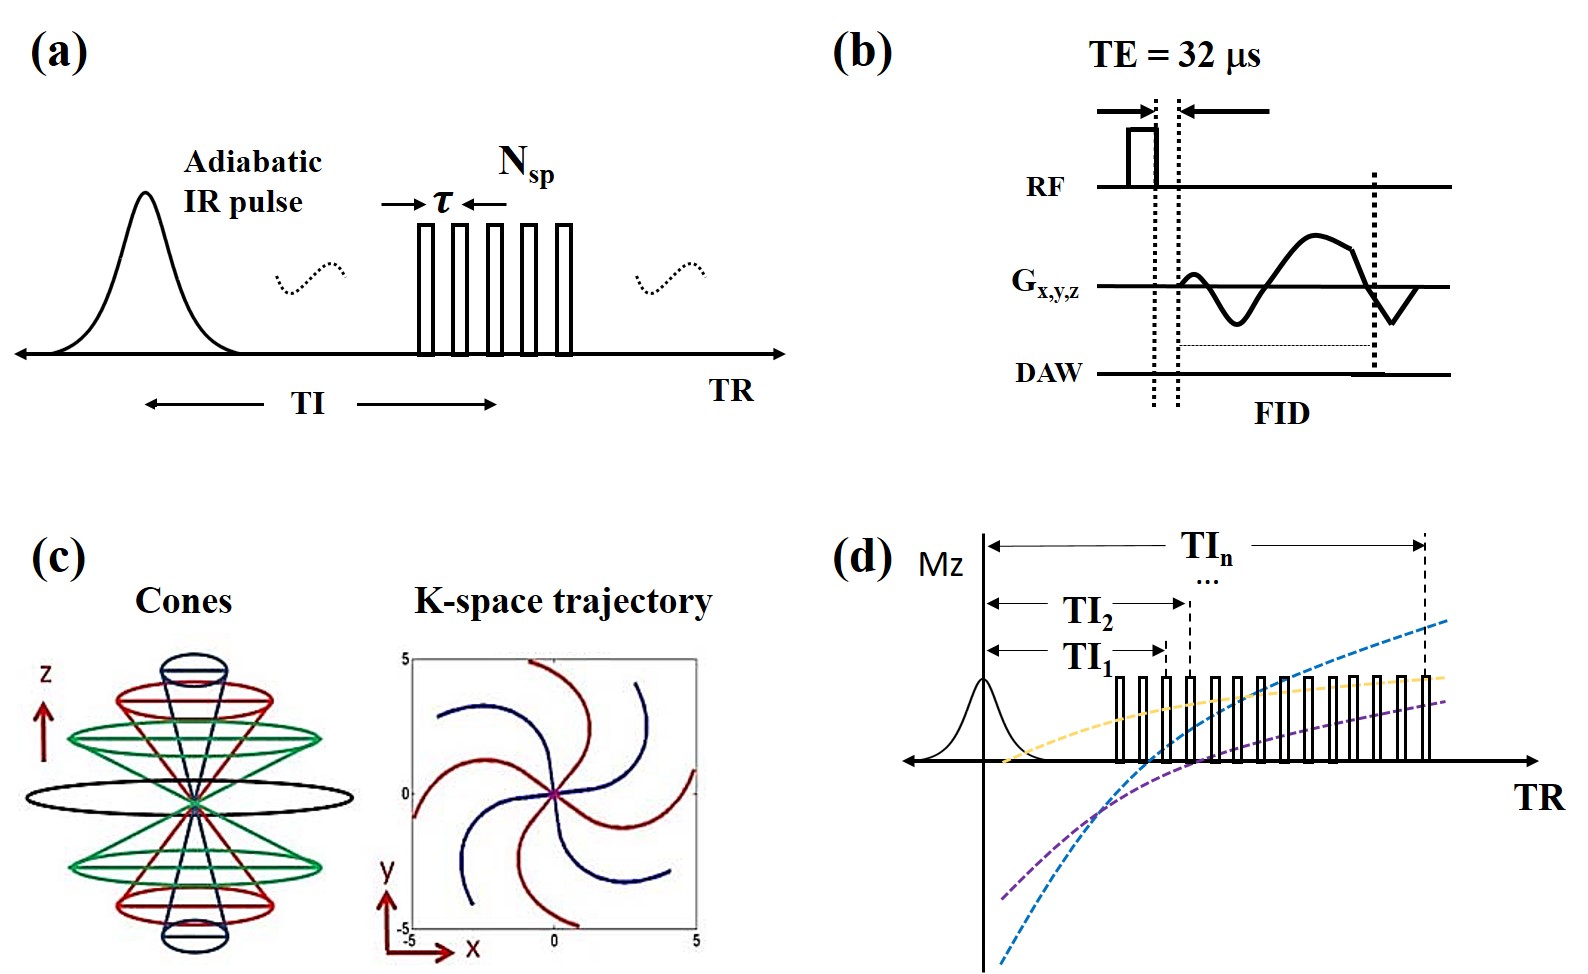
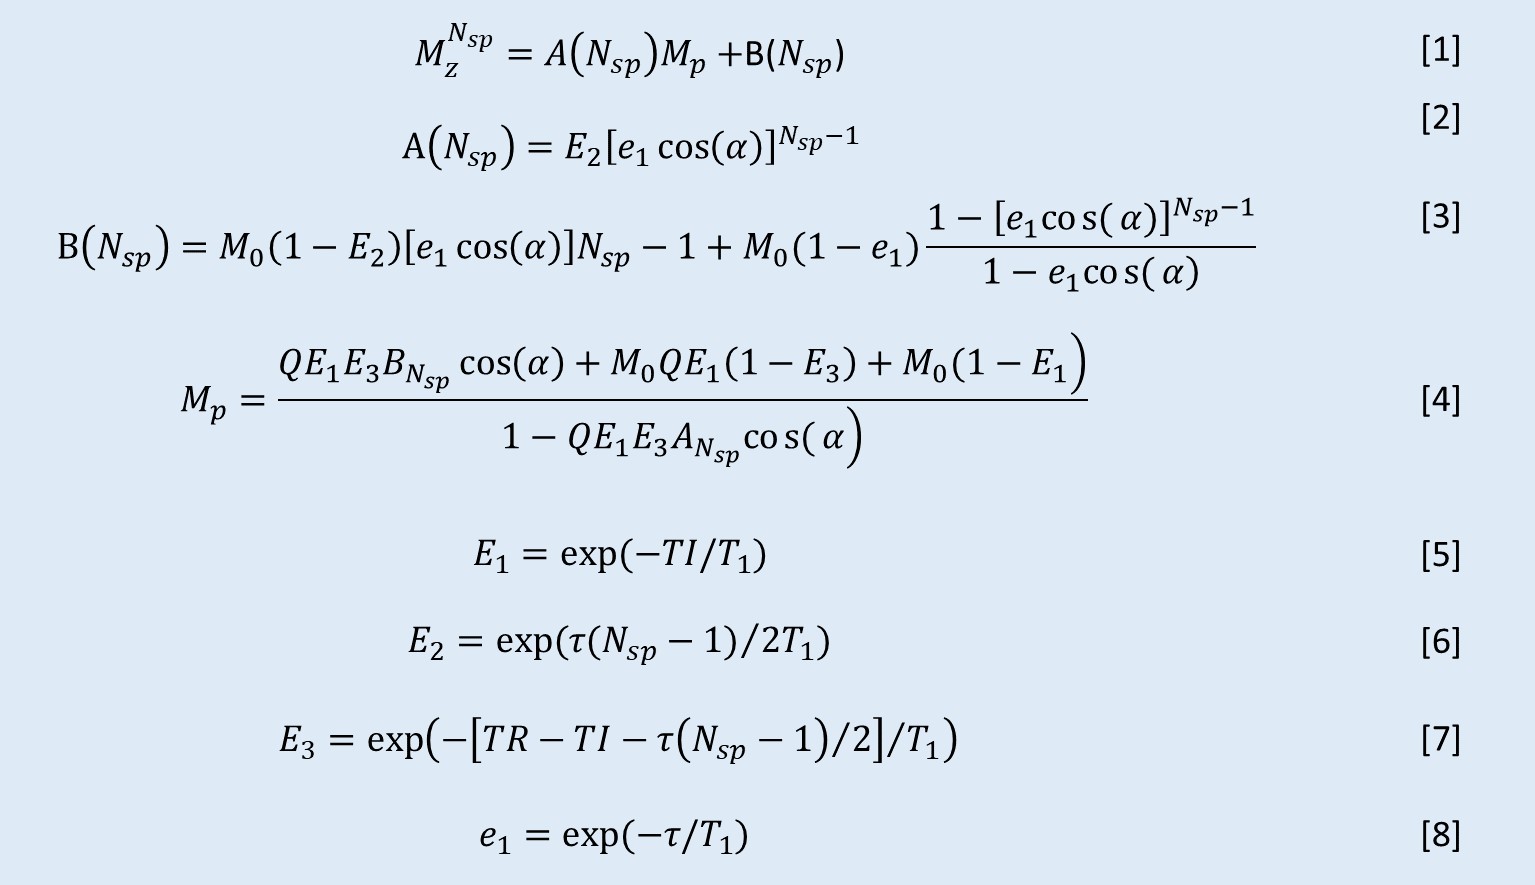
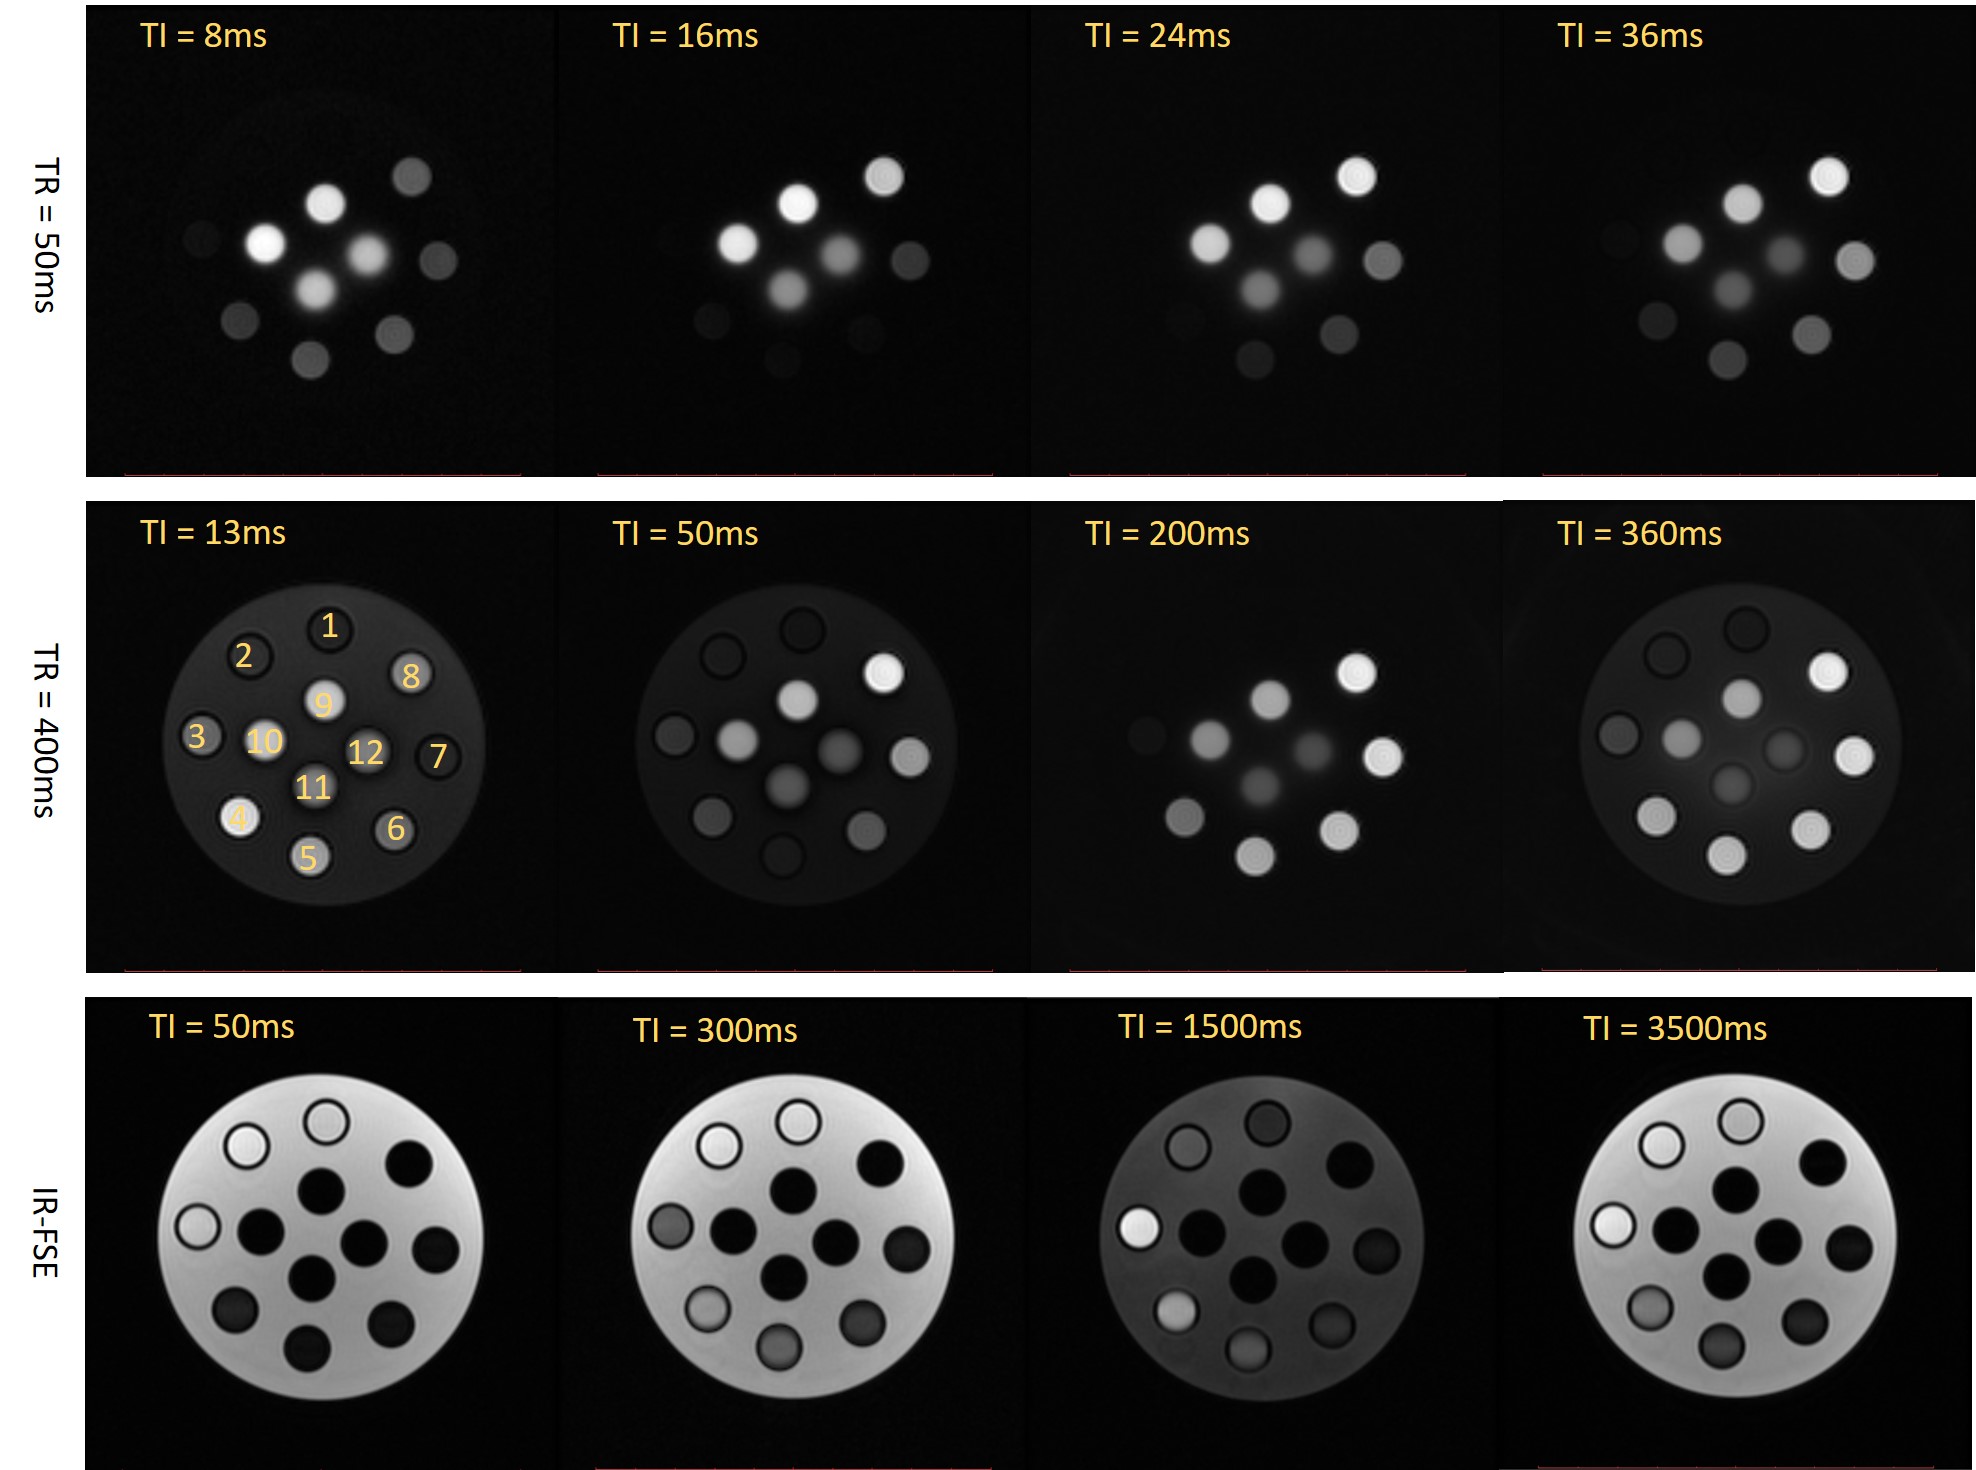
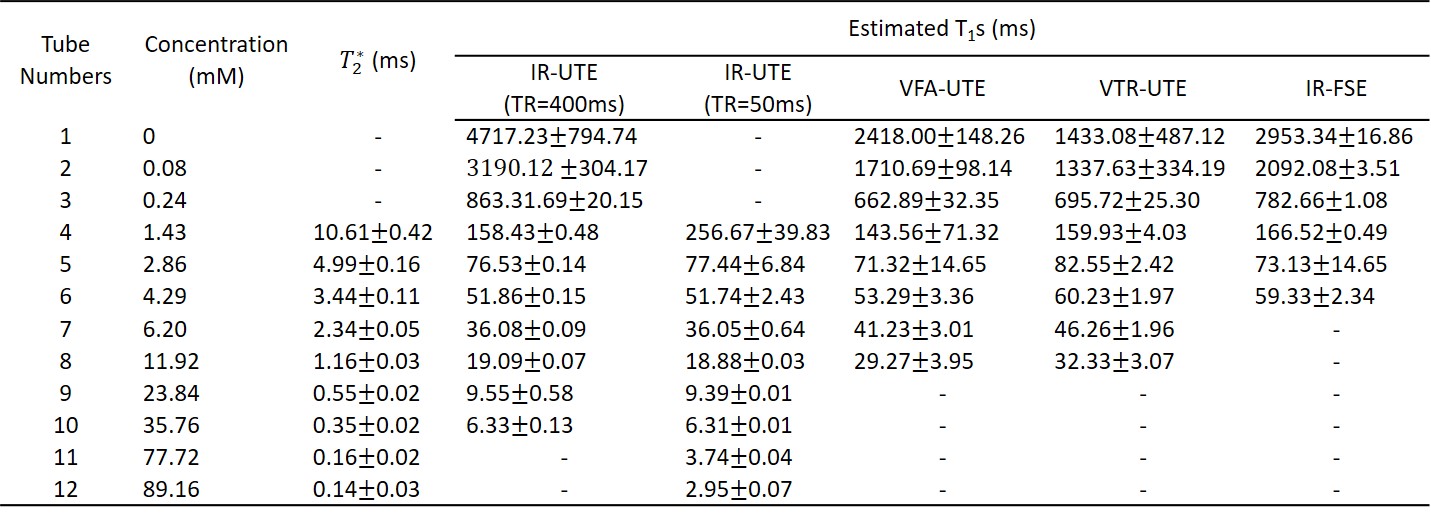
Twelve 5-ml tubes filled with MnCl2-doped solutions (concentrations ranging from 0 to 89.16 mM, details in Table 1) were placed inside a cylindrical container filled with agarose gel (1% by weight). The experiments were performed on a 3T GE MR750 scanner using an eight-channel transmit/receive knee coil. A diagram describing the 3D IR-UTE-Cones sequence is shown in Figure 1. By fixing the TR and selecting multi TIs along the T1 recovery process (as shown in Figure 1d), T1 values could be quantified with the proposed fitting model (Figure 2). Due to the large range of MnCl2 concentrations, IR-UTE-Cones protocols with two sets of TR/TI combinations were performed to fully sample the recovery curves of both long T1 and ultrashort T1 phantoms: for set 1, TR/TI = 400/13, 15, 18, 25, 30, 40, 50, 70, 100, 130, 160, 200, 240, 280, 320, 360 ms, and for set 2, TR/TI = 50/8, 9, 10, 11, 12, 13, 14, 15, 16, 17, 18, 20, 24, 28, 32, 36 ms. Other parameters were as follows: Silver Hoult adiabatic inversion pulse (duration=8.64 ms), TE= 32μs, FOV=120×120×128mm3, matrix=160×160×32, FA=10°, BW= ±125kHz. For purposes of comparison, two previously reported UTE-based techniques, variable flip angle UTE (VFA-UTE) and variable TR UTE (VTR-UTE), as well as the 2D IR-FSE technique, were also applied. The VFA-UTE method used the following parameters: TE=32μs, TR=20ms, FOV=120×120×128mm3, matrix=160×160×32, FA= 4°, 8°, 12°,16°, 20°, 24°, 28°, 32°, 36°, BW= ±125kHz. The VTR-UTE method used similar parameters except for the following changes: TR=20, 40, 60, 80ms; FA=45°. The 2D IR-FSE sequence used similar parameters except for the following changes: TE/TR=6.52/4000ms, FOV =120×120mm2, slice thickness=5mm; matrix=192×192; BW= ±62.5kHz; TI=50, 75, 100, 200, 300, 400, 600, 900, 1500, 2000, 2500, 3000, 3500ms; for each TI, only one slice was scanned. UTE-Cones data with 15 different TEs were acquired with TE=0.032, 0.2, 0.4, 0.8, 1.4, 2.2, 4.4, 6.6, 8.8, 11, 22, 33, 44, 66, and 88ms to estimate the T2* of each tube.Results
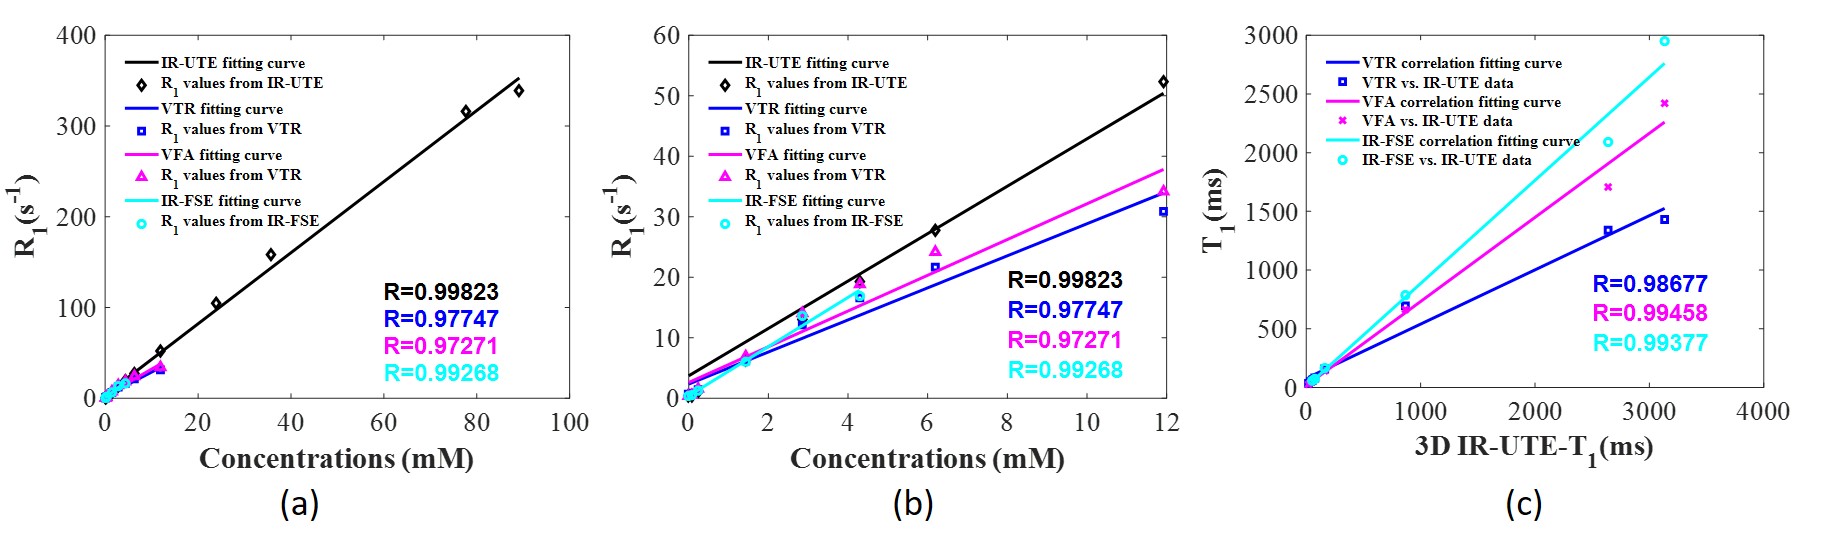
Figure 3 shows the MnCl2 phantom scanned with the 3D IR-UTE-Cones and the 2D IR-FSE method at different TR/TI combinations. 3D IR-UTE-Cones sequences could capture signals of short T2* tubes (tubes 7-12), which showed as high signal and contrast with the 3D IR-UTE-Cones sequence, but undetectable (dark at any TI) with the 2D IR-FSE sequence. Table 1 shows T1s calculated from different protocols and T2*s of nine tubes with MnCl2 above 1.43 mM. The IR-UTE-Cones method could measure T1s as short as 2.95ms, which was unachievable with the other three methods. Figure 4 shows nearly perfect correlations between MnCl2 concentrations and R1 values calculated from different methods, and correlations between the IR-UTE-Cones and other methods (i.e., VTR-UTE, VFA-UTE, and IR-FSE) in terms of the T1 value. Those results demonstrate that the IR-UTE-Cones method could accurately measure a broader range of T1s.Discussion
In this study, T1 values derived from the 3D IR-UTE-Cones method showed a strong linear correlation with concentrations of MnCl2. The results indicate that the 3D IR-UTE-Cones sequence can be used as a valid method for T1 measurement, especially for tissues with short T2s and short T1s. Compared with IR-FSE, VFA, and VTR protocols, the 3D IR-UTE-Cones method could measure a much broader range of T1s and produced more accurate measurements, especially for short T1s.Conclution
In this study, we demonstrated the feasibility of using the inversion recovery prepared ultrashort echo time cones sequence to accurately measure short T1s while providing high contrast images of short T2 tissues.Acknowledgements
The authors acknowledge grant support from GE Healthcare, NIH (2R01 AR062581, 1R01 NS092650, and 1R01 AR068987).References
1. Uwe G, Andreas J, Regina S, et al. Description and characterization of the novel hyperthermia- and thermoablation-system MFH®300F for clinical magnetic fluid hyperthermia. Medical Physics. 2004;31(6):1444–1451.
2. Andreas J, Regina S, Peter W, et al. Magnetic fluid hyperthermia (MFH): Cancer treatment with AC magnetic field induced excitation of biocompatible superparamagnetic nanoparticles. Journal of Magnetism and Magnetic Materials. 1999; 201(2): 413–419.
3. Woodrum D. A, Kawashima A, Gorny K. R, et al. Prostate cancer: state of the art imaging and focal treatment. Clinical Radiology. 2017; 72(8), 665–679.
4. Kuroda, K. MR techniques for guiding high-intensity focused ultrasound (HIFU) treatments. Journal of Magnetic Resonance Imaging. 2018;47(2), 316–331.
5. Mingming Z, Ziqi S, Chin K. N. Image-guided thermal ablation with MR-based thermometry. Quantitative Imaging in Medicine and Surgery.2017; 7(3), 356–368.
6. Yajun M, Yanchun Z, Xing L, et al. Short T 2 imaging using a 3D double adiabatic inversion recovery prepared ultrashort echo time cones (3D DIR-UTE-Cones) sequence. Magnetic Resonance in Medicine. 2018; 79(5), 2555–2563.
7. Jiang D, Michael C, Mark B, et al. Qualitative and quantitative ultrashort echo time (UTE) imaging of cortical bone. Journal of Magnetic Resonance. 2010; 207(2), 304–311.
Figures