0527
Adiabatic Inversion and T1 Relaxation of Bovine White Matter
Luke A. Reynolds1, Alex L. MacKay1,2,3, and Carl A. Michal1
1Physics & Astronomy, University of British Columbia, Vancouver, BC, Canada, 2Radiology, University of British Columbia, Vancouver, BC, Canada, 3MRI Research Centre, University of British Columbia, Vancouver, BC, Canada
1Physics & Astronomy, University of British Columbia, Vancouver, BC, Canada, 2Radiology, University of British Columbia, Vancouver, BC, Canada, 3MRI Research Centre, University of British Columbia, Vancouver, BC, Canada
Synopsis
Adiabatic pulses are commonly used in clinical MRI due to their insensitivity to B1 inhomogeneity and uniform flip angle over a selected bandwidth. When applied to white matter, they are generally assumed to saturate the magnetization of the non-aqueous protons in myelin. We performed adiabatic inversion recovery experiments on bovine brain in vitro using a solid state NMR spectrometer to directly observe the effects of adiabatic inversions on the non-aqueous signal. Substantial non-aqueous magnetization remains after typical adiabatic pulses. The state of the non-aqueous magnetization seriously impacts measurement of T1, yielding values dependent on the form of inversion pulse used.
Introduction
Soft pulses are ubiquitous in clinical MRI because of their low energy deposition and selective excitation bandwidth. Adiabatic pulses are modulated in amplitude and frequency such that all spins within a selected bandwidth are flipped uniformly. It is often assumed that adiabatic pulses saturate, or suppress, the non-aqueous proton magnetization in white matter tissue1,2. The state of this magnetization plays an important role in relaxation dynamics. While a consensus has emerged that T2 relaxation measurements in white matter in vivo can be understood in terms of a two-pool model3,4, conflicting reports of the number of components required to meaningfully describe T1 endure5-9.The goal of this study was to test the assumption that typical adiabatic pulses saturate non-aqueous magnetization in white matter by directly measuring the non-aqueous proton signal after adiabatic inversion and monitoring the effects of the non-aqueous magnetization’s initial state on determinations of T1.
Methods
Samples: We obtained an unfrozen bovine brain (Innovative Research – Novi, MI, USA) approximately 30 hours after harvest. Tissue samples were immediately extracted and sealed in 5mm NMR tubes with proton-free o-ring and caps . Two samples were collected from the splenium of the corpus callosum weighing 53.6mg (WM1) and 45.9mg (WM2) and one from frontal white matter weighing 67.7mg (WM3). All experiments were performed within 36 hours of receiving the brain.Experiments: Experiments were performed in a 360MHz (8.4T) NMR magnet using a home-built spectrometer. Sequences used were (Fig. 1): inversion recovery with FID (IR-FID) or CPMG acquisition (IR-CPMG). 30 inversion times, TI= 10µs - 10s, and a 10s recycle time were used. Echo spacing (TE) was 2ms with 256 echoes obtained.
Three types of inversion pulse were used. A ‘hard’ ~8µs rectangular pulse inverted all proton populations. A 3ms three-lobe sinc pulse yielded a 1.1kHz excitation bandwidth, inverting only the aqueous protons. Finally, an adiabatic hyperbolic secant (AHS) pulse was matched to clinically relevant parameters1 – 10ms length, 750Hz maximum amplitude, β 730s-1 10, and 4kHz bandwidth frequency modulation.
Analysis: IR-FID: The inversion recovery data were fitted to single or double exponential decays using a non-linear least squares (NNLS) algorithm (‘lsqnonlin’, MATLAB) to extract T1 values.
IR-CPMG: CPMG echo amplitudes were fitted to a superposition of exponentials, $$$\sum_{i}f_{i} * exp(-TE/T_{2,i})$$$, using a regularized NNLS algorithm (‘lsqnonneg’, MATLAB) to extract T2 values. Myelin water fraction (MWF) was computed as the proportion of coefficients for $$$\frac{T_{2} < 40ms}{\sum T_{2}}$$$11.
Results
Inversion Efficiency: IR-FID spectra from short TI (Fig. 2) show that the hard pulse effectively inverted both aqueous and non-aqueous magnetization, but it is clear that the adiabatic inversion left much of the dipolar broadened non-aqueous magnetization along B0. When normalized to fully equilibrated spectra, 48% of the non-aqueous signal (interpreted as -20kHz < S < -1.8kHz & 0.8kHz < S < 20kHz) remained.T1 Relaxation: IR-FID recoveries for the hard pulse inversion were much more nearly single exponential (RMS misfit 0.6% maximum amplitude) than for either adiabatic or sinc inversions (RMS misfits 3% and 5% respectively), (Fig 3). More importantly, the best fit T1 of aqueous amplitudes: 1.66 ± 0.02s, 1.38 ± 0.08s, and 1.25 ± 0.11s for the hard, adiabatic, and sinc inversions respectively, were significantly different. Applying two-component fits to the adiabatic and sinc cases provided better fits by introducing a short time component and shifting the long component closer to the single-component case (T1 = 1.59 ± 0.01s & 64 ± 4ms and 1.58 ± 0.02s & 65 ± 4ms respectively).
T2 Relaxation: NNLS fitting generated similar T2 distributions (Fig. 4) for each inversion case. The three peaks are interpreted to originate in the intra/extracellular water pool (T2 = 64ms) and the myelin water pool (T2 = 26ms & 9.6ms). The MWF, 11.6%, was found to be comparable to previous studies9,12.
Discussion
These results demonstrate that adiabatic inversion pulses do not saturate the non-aqueous proton magnetization. The state of the non-aqueous magnetization has clear effects on determinations of T1. Single exponential fits fail to consider effects of magnetization exchange between the different aqueous and non-aqueous proton pools. When the populations are prepared in different non-equilibrium states with soft pulses, magnetization exchange rapidly equalizes the spin polarization in different pools giving the appearance of a T1 that is faster than would be measured with uniform inversion. With two-component fits, this manifests as the appearance of a short T1 component13,14, which in this case was measured to be approximately 65ms.B1 inhomogeneity and incomplete spoiling have previously been attributed to discrepancies in T1 mappings15. Neither factor is significant here – B1 inhomogeneity in our system was approximately 1 part in 120 (Fig. 5), yet we still measured discrepancies in T1. While B1 homogeneity and incomplete spoiling play significant roles in MRI settings, it is evident that more fundamental dynamics need also be considered to accurately reflect the system. Alternate treatments such as the four-pool model have shown to be an effective step in the right direction8,9,12,16.
Conclusion
We have shown that the non-aqueous proton population in white matter is not completely saturated by adiabatic inversion pulses, contrary to common assumption. This effect introduces complex magnetization dynamics that are often overlooked in T1 relaxation measurements.Acknowledgements
No acknowledgement found.References
- van Gelderen, P, Duyn, JH. White matter intercompartmental water exchange rates determined from detailed modeling of the myelin sheath. Magn. Reson. Med. 2019; 81: 628– 638.
- Seifert, AC, Li, C, Wilhelm, MJ, Wehrli, SL, Wehrli, FW. Towards quantification of myelin by solid-state MRI of the lipid matrix protons. NeuroImage. 2017; 163: 358-367.
- Fischer, HW, Rinck, PA, Van Haverbeke, Y, Schmitz-Feuerhake, I, Muller, RN. Nuclear relaxation of human brain grey matter and white matter: analysis of field dependence and implications for MRI. Magn. Reson. Med. 1990; 16: 317-334.
- Stewart, WA, MacKay, AL, Whittall, KP, Moore, GR, Patsy, DW. Spin-spin relaxation in experimental allergic encephalomyelitis: analysis of CPMG data using a non-linear least squares method and linear inverse theory. Magn. Reson. Med. 1993; 29: 767-775.
- MacDonald, HL, Bell, BA, Smith, MA, Kean, DM, Tocher, JL, Douglas, RH, Miller, JD, Best, JJ. Correlation of human NMR T1 values measured in vivo and brain water content. Br. J. Radiol. 1986; 59: 355-357.
- Vavasour, IM, Laule, C, Li, DK, Traboulsee, AL, MacKay, AL. Is the magnetization transfer ratio a marker for myelin in multiple sclerosis? J. Magn. Reson. Imaging. 2011; 33: 713-718.
- Labadie, C, Lee, JH, Rooney, WD, Jarchow, S, Aubert-Frecon, M, Springer Jr, CS, Moller, HE. Myelin water mapping by spatially regularized longitudinal relaxographic imaging at high magnetic fields. Magn. Reson. Med. 2014; 71: 375-387.
- Stanisz, GJ, Kecojevic, A, Bronskill, MJ, Henkelman, RM. Characterizing white matter with magnetization transfer and T2. Magn. Reson. Med. 1999; 42: 1128-1136.
- Bjarnason, TA, Vavasour, IM, Chia, CLL, MacKay, AL. Characterization of the NMR behavior of white matter in bovine brain. Magn. Reson. Med. 2005; 54: 1072-1081.
- Tannús, A, Garwood, M. Adiabatic Pulses. NMR in Biomed. 1997; 10: 423-434.
- Laule, C. Myelin water imaging in multiple sclerosis: quantitative correlations with histopathology. Multiple Sclerosis Journ. 2006; 12: 747-753.
- Barta, R, Kalantari, S, Laule, C, Vavasour, IM, MacKay, AL, Michal, CA. Modeling T1 and T2 relaxation in bovine white matter. Journ. Magn. Reson. 2015; 259: 56-67.
- Prantner, AM, Bretthorst, GL, Neil, JJ, Garbow, JR, Ackerman, JJ. Magnetization transfer induced biexponential longitudinal relaxation. Magn. Reson. Med. 2008; 60: 555-563.
- Gochberg, DF, Gore, JC. Quantitative magnetization transfer via selective inversion recovery with short repetition times. Magn. Reson. Med. 2007; 57: 437-441.
- Stikov, N, Bourdreau, M, Levesque, IR, Tardif, CL, Barral, JK, Pike, GB. On the Accuracy of T1 Mapping: Searching for Common Ground. Magn. Reson. Med. 2015; 73: 514-522.
- Kalantari, S, Laule, C, Bjarnason, TA, Vavasour, IM, MacKay, AL. Insight into in vivo magnetization exchange in human white matter regions. Magn. Reson. Med. 2011; 66: 1142-1151.
Figures
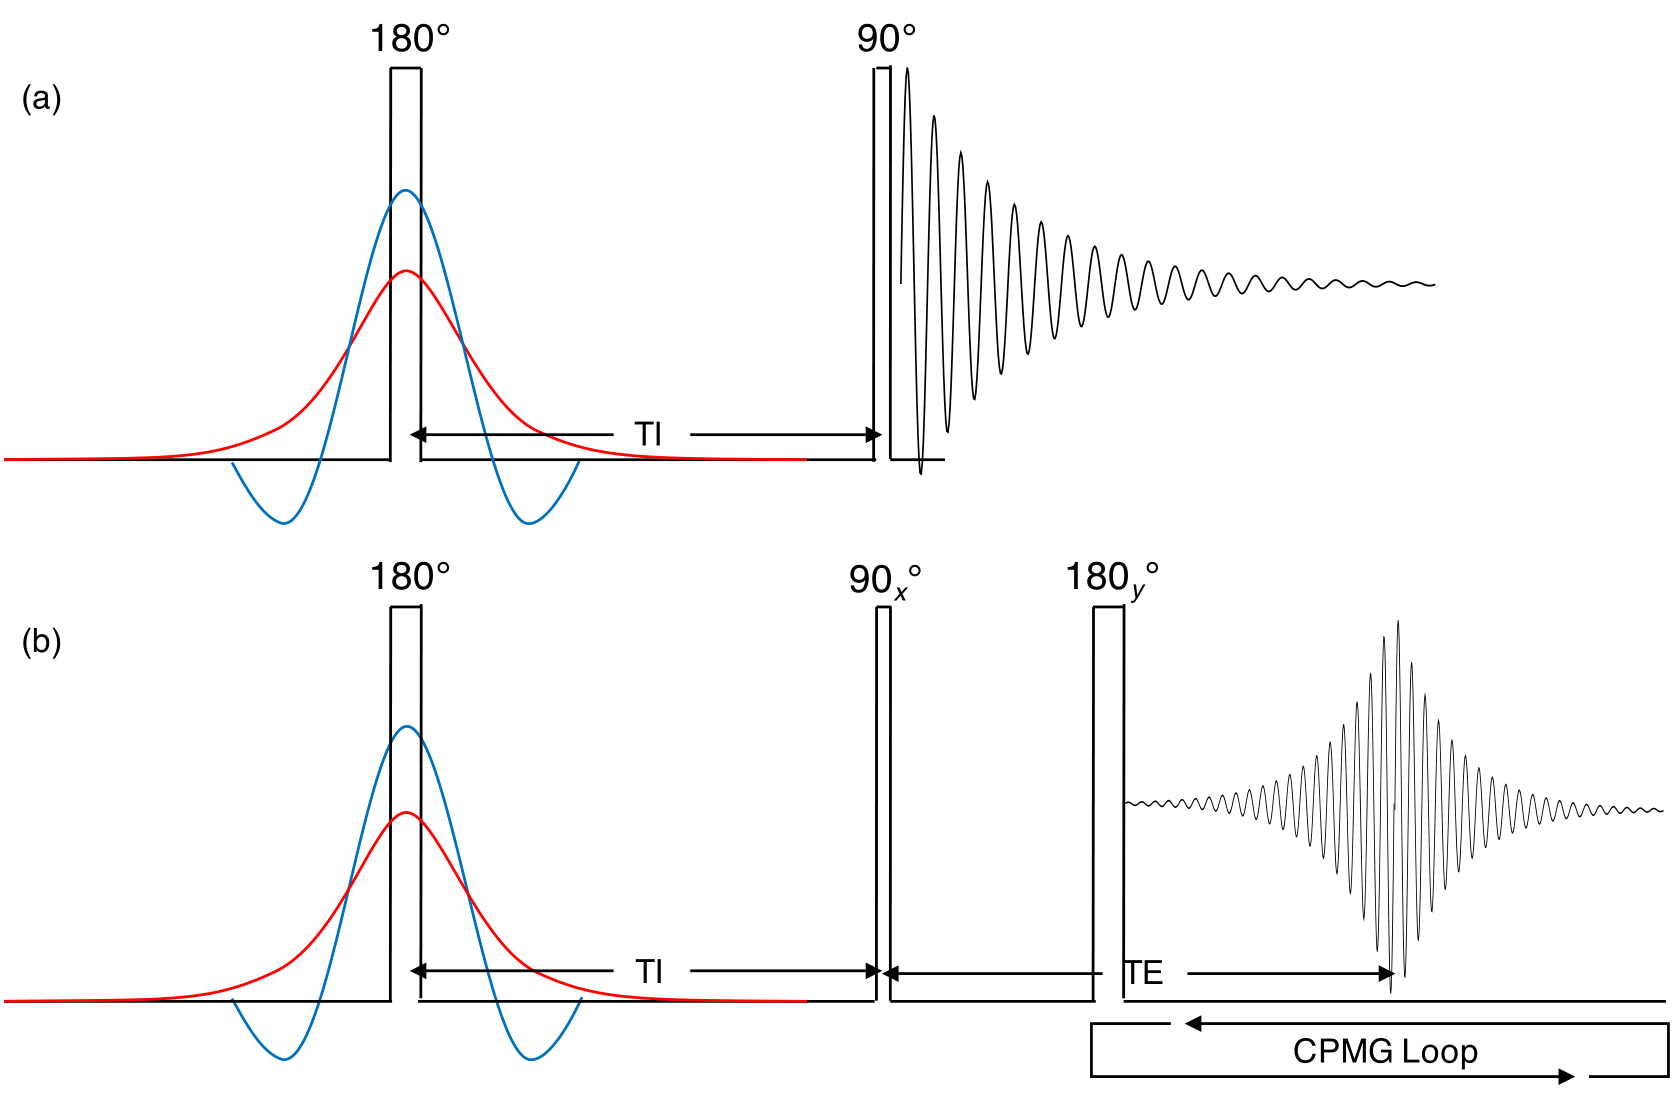
Figure 1: (a) IR-FID pulse sequence with three interchangeable inversion pulses. Note that the diagram is not to scale; the hard pulse (black) was ~8µs, AHS pulse (red) was 10ms, and the three-lobe sinc (blue) was 3ms. TI times were logarithmically spaced from 10µs-10s. (b) IR-CPMG sequence using the CPMG echo train of 256 echoes spaced at TE=2ms.
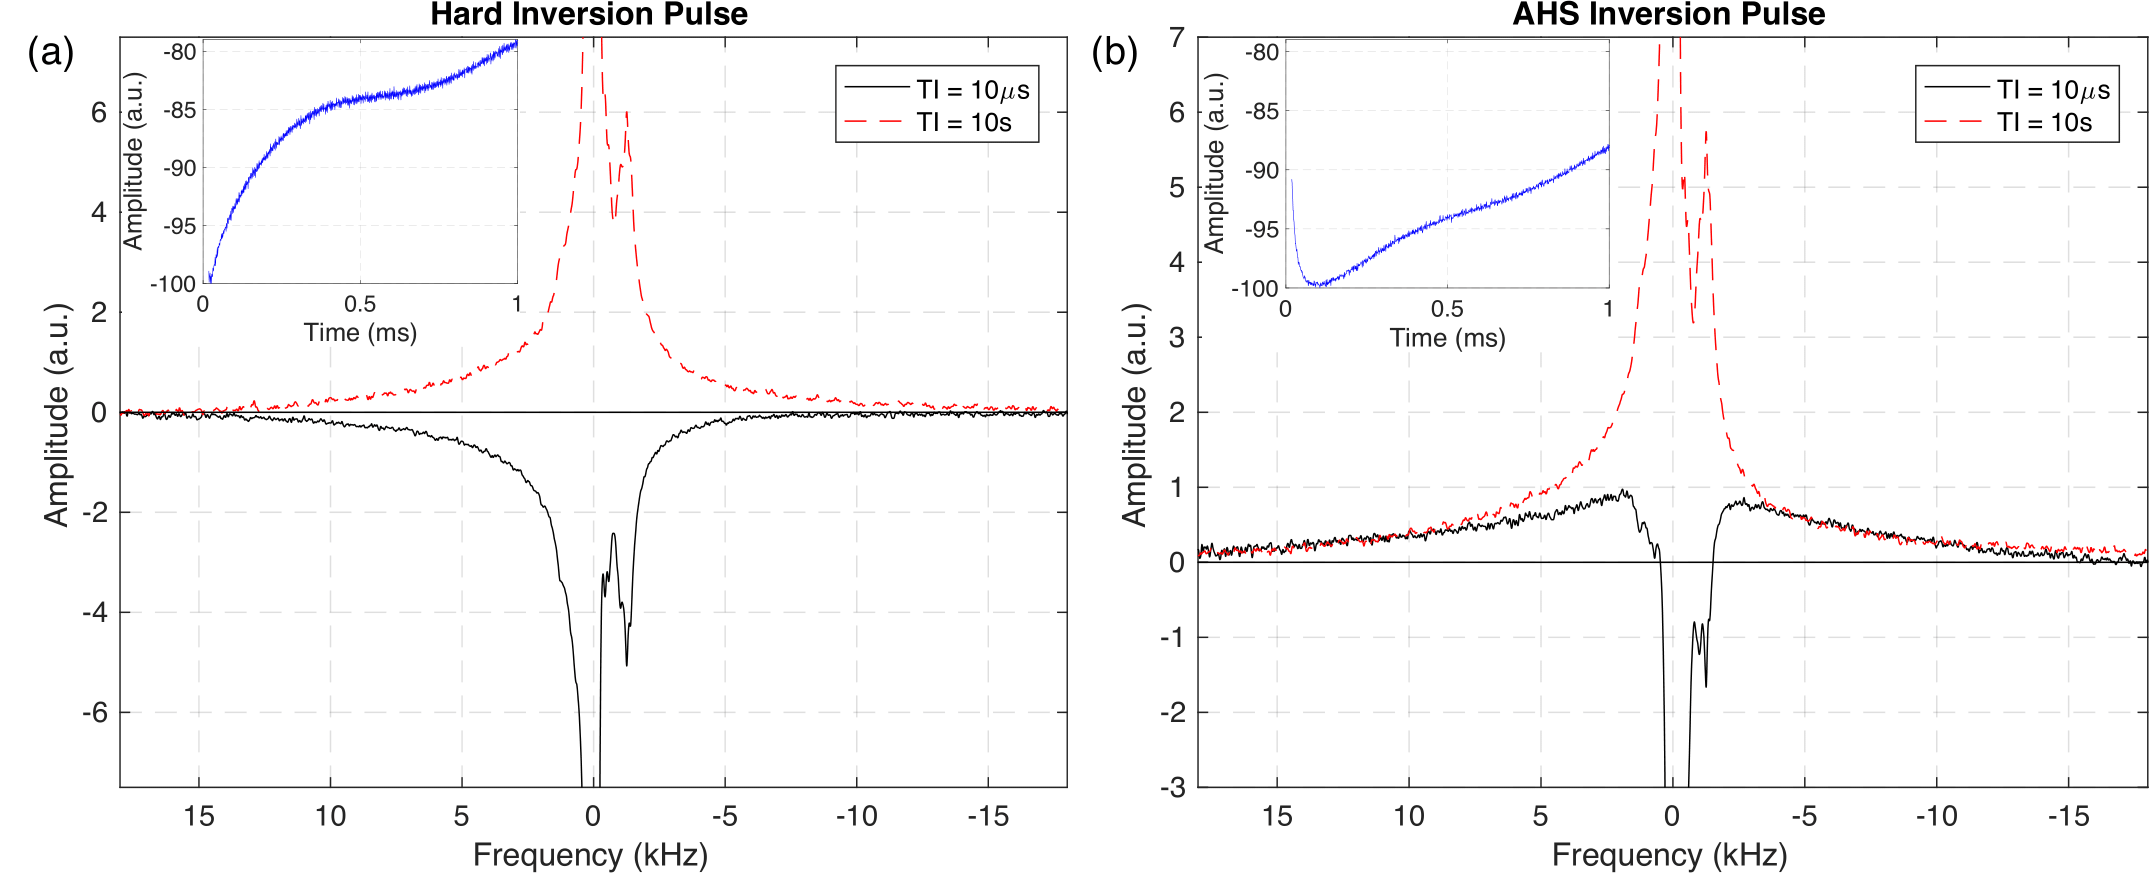
Figure 2: Spectra collected from WM3 sample during IR-FID
experiments at a fully relaxed state (red dashed, long TI) and directly
following (black solid, short TI) a hard (a) or adiabatic (b) inversion pulse.
Inset in both frames are the first millisecond of the FID from the short TI time,
i.e. the Fourier transform of the black curves, from each inversion case.
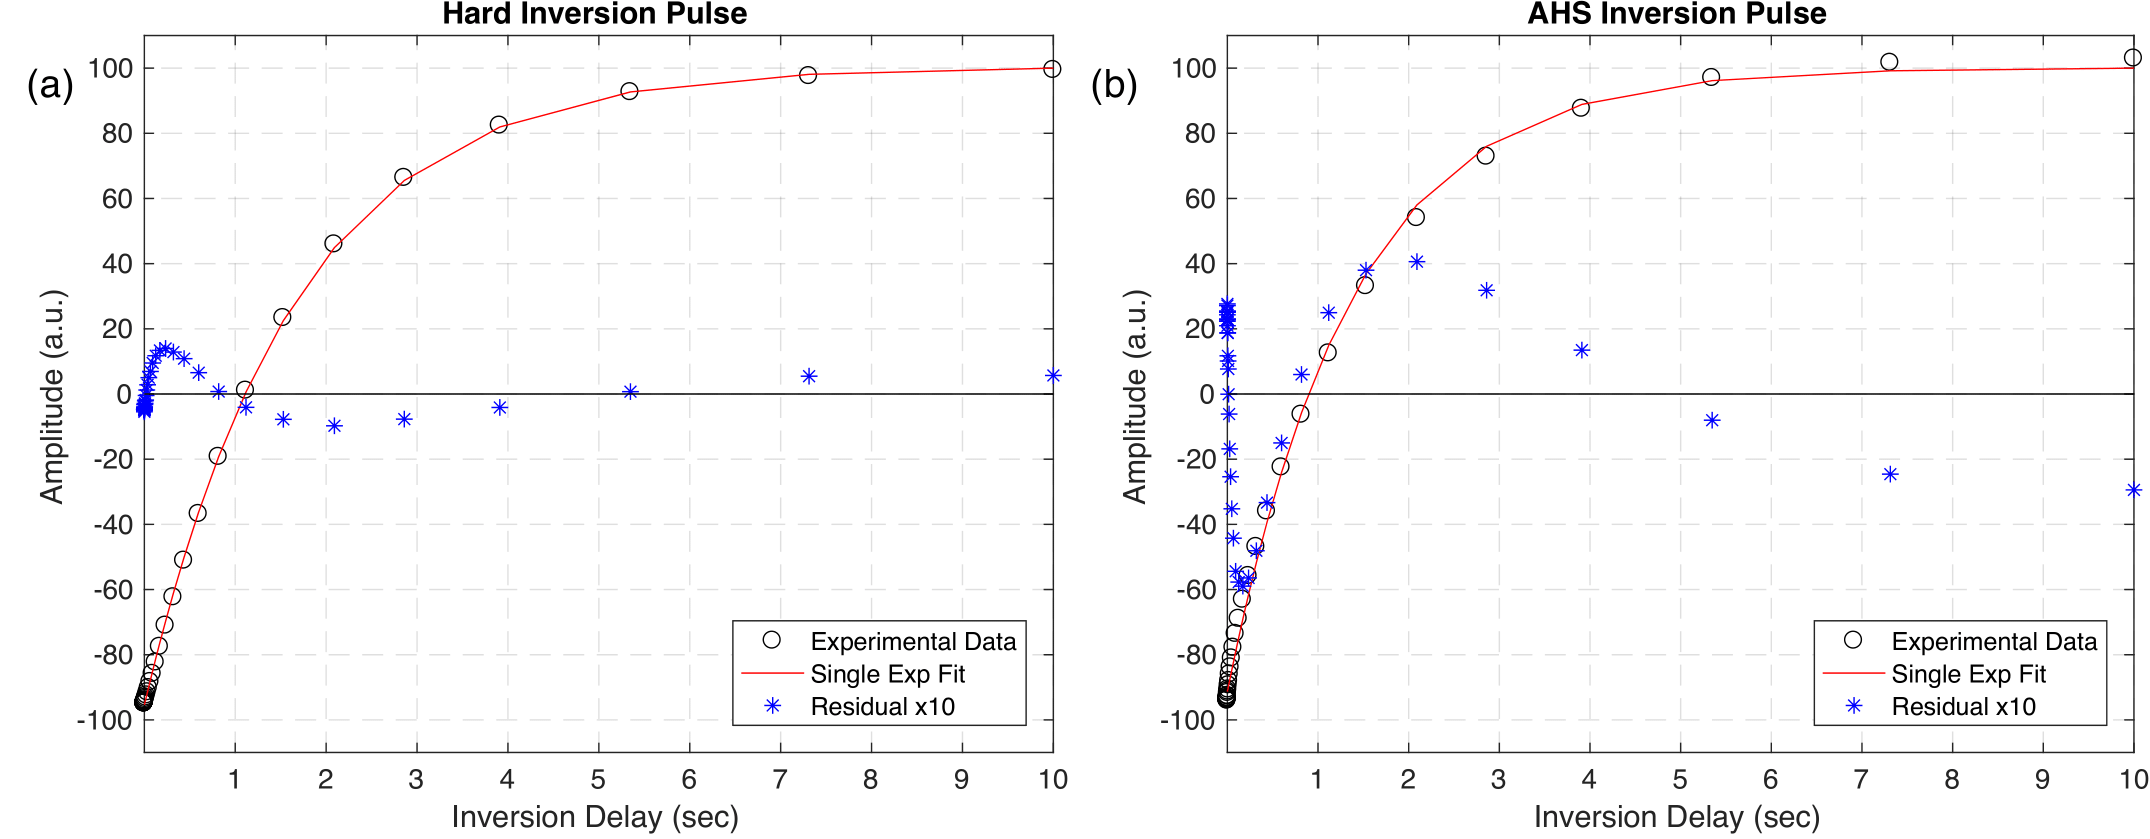
Figure 3: Characteristic single exponential recovery curves in
sample WM3 from IR-FID experiments with hard (a) and adiabatic (b) inversions.
The red line shows the best fit curve to the data (black circles), and the corresponding
residuals (blue stars) have been overlaid and multiplied by a factor of 10. The single
exponential fit is inadequate to describe the recovery following the adiabatic
inversion.
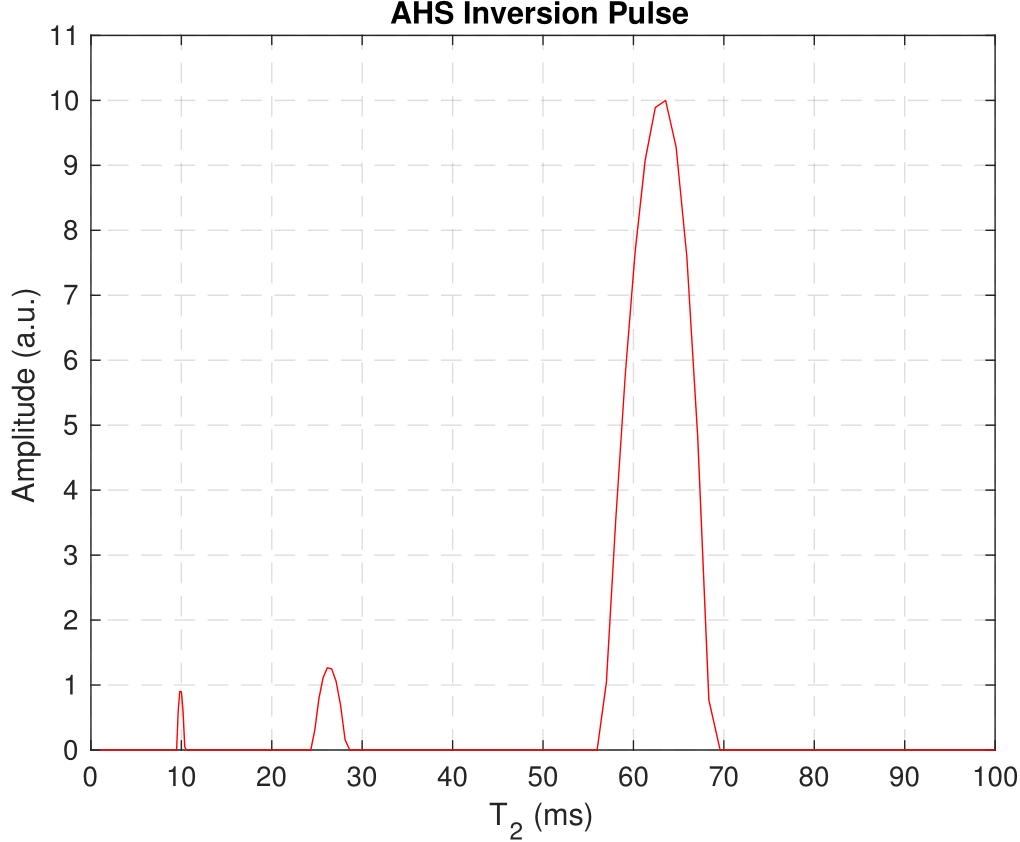
Figure 4: T2 distribution resulting from
regularized NNLS fitting of IR-CPMG decay curves at the longest TI time, 10s.
This distribution came from the adiabatic inversion case in WM3 but is
characteristic of the other IR-CPMG data sets, as there is little deviation in
T2s between samples and inversion methods at long TI.
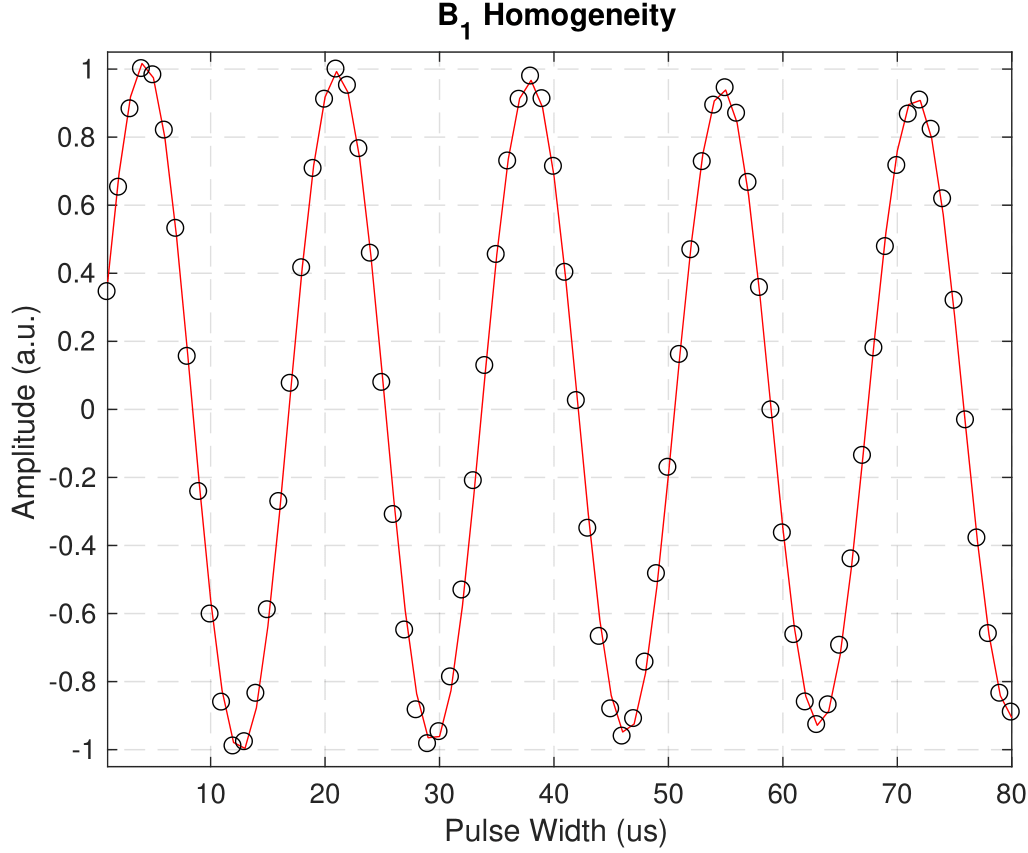
Figure 5: We measured the homogeneity of B1 for the
WM3 sample by applying one hard pulse at 80 uniformly spaced pulse widths. The
peak amplitudes (black circles) were fitted to an exponentially decaying
sinusoid (red line) to extract the nutation frequency and decay time constant.
These fitted parameters yield a field inhomogeneity of 1 part in 120.