0526
Field-Dependence of White Matter T1 Through Macromolecular Relaxation and Magnetization Transfer1AMRI, LFMI, NINDS, National Institutes of Health, Bethesda, MD, United States
Synopsis
Brain tissue T1 predominately reflects local macromolecular content and is magnetic field strength dependent. In this study, we quantified the field dependence of macromolecular proton T1 (or rate Rm) in white matter by evaluating its effect exerted on the water signal through magnetization transfer. Inversion recovery and saturation recovery experiments were performed on a group of eight volunteers at 0.55, 1.5, 3 and 7 T, and were jointly analyzed using a two-pool exchange model. Rm was found to be close to inversely proportional to B0, consistent with previous in vitro findings at very low fields.
Introduction
Tissue longitudinal relaxation, typically characterized by exponential recovery time constant T1 (or rate R1), is strongly affected by tissue macromolecular content [1]. Tissue T1 increases with the main field strength $$$B_0$$$ [2,3], yet the molecular mechanism of this field dependence has not been fully explained. Theoretical analysis and experiments involving hydrated protein have indicated that for protons on chain-structured large molecules, T1 (or rate $$$R_m$$$) is strongly field dependent, and this dependence is imposed on tissue T1 through magnetization transfer [4]. Nevertheless, in vivo evidence is lacking due to the difficulty of directly detecting the fast decaying signal from macromolecular protons (MP, T2 $$$\approx$$$ 65 us) on modern MRI systems. Recent studies have estimated the physical properties of MP indirectly by jointly analyzing inversion recovery (IR) and saturation recovery (SR) data of water protons (WP) [5,6]. In such experiments, inversion and saturation RF pulses are used to differentially disturb the WP and MP magnetization levels, leading to two bi-exponential curves that share a same pair of relaxation rates $$$\lambda_f$$$ (fast) and $$$\lambda_s$$$ (slow). Two-pool analysis follows to produce parameters relevant to each pool. In this study, we took this approach at four different $$$B_0$$$ values ranging from 0.55 to 7 T to explore the field dependence of $$$R_m$$$ in vivo in the white matter.Methods
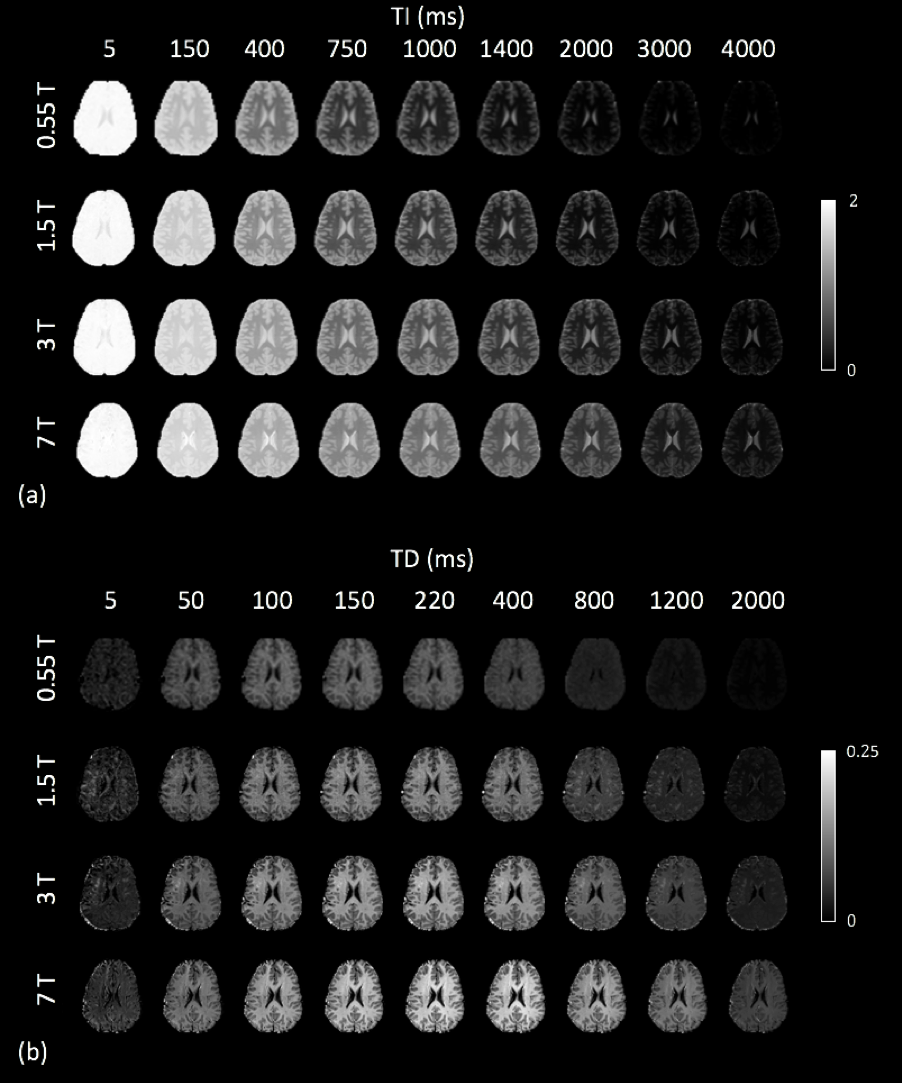
Data acquisition. Eight normal volunteers were scanned at 0.55 T (a ramped-down prototype 1.5 T Aera system), a 1.5 T Aera, a 3 T Prisma, and 7 T Magnetom (Siemens Healthineers, Erlangen, Germany). The same EPI sequence was implemented at the four fields. For IR, a hyperbolic-secant adiabatic pulse was used with peak-amplitude 19.6 uT, duration 7.0 ms, and $$$\beta$$$ value of 1026 s-1 [7]; This resulted in inversion of WP and saturation of MP. For SR, a hard pulse train (15 pulses) with flip angles of 60°, -120°, 120°, …, -120°, 60° was used with amplitude 19.6 uT and total duration 6.0 ms [5]; This saturated MP, while minimally affecting WP. Ten oblique axial slices (FOV 240x180 mm2) were acquired using single-shot EPI at ten delay times (ranges are provided in Table 1). For 1.5, 3 and 7 T, matrix size was 144x108 with SENSE rate 2; For 0.55 T, matrix size was 72x54 without parallel imaging acceleration. Twelve repetitions were acquired for IR, including two references without inversion pulse; Sixteen repetitions were acquired for SR, including four references without saturation pulse. Other imaging parameters are provided in Table 1.Data analysis. After EPI distortion correction and slice-wise motion correction, IR and SR saturation levels were calculated using $$$S(t):=1-\frac{Image(t)}{Ref}$$$, and averaged over the splenium of the corpus collosum (SCC), a homogenous white matter region manually contoured on EPI. At each field, the averaged IR and SR saturations were jointly fitted to the bi-exponential function sharing the same relaxation rates $$$\lambda_f$$$ and $$$\lambda_s$$$ $$\begin{split} S_{IR}(t)&=a_1e^{-\lambda_st}+a_2e^{-\lambda_ft}\\ S_{SR}(t)&=a_3e^{-\lambda_st}+a_4e^{-\lambda_ft} \end{split}\tag1$$ For IR data at 0.55 and 1.5 T, $$$a_2$$$ was set to 0 since $$$a_1\gg a_2$$$, essentially leading to mono-exponential relaxation. To determine two-pool parameters, it was assumed that the saturation level of the MP pool by the SR pulse is 0.93, based on previous simulations and experiments reported in [5,6]. $$$R_w$$$ was assumed to be 0.40 s-1 and field independent [8,5]. For 3 and 7 T, the following equation set was solved to obtain $$$R_m$$$, as well as MP fraction $$$f$$$ and exchange rates $$$k_w$$$ (from WP to MP) and $$$k_m$$$ (from MP to WP) $$\begin{split} k_w&=\frac{(\lambda_s-R_w)a_3+(\lambda_f-R_w)a_4}{a_3+a_4-S_{m\_SR}(t=0)}\\ \lambda_f+\lambda_s&=R_w+R_m+k_w+k_m\\ \lambda_f-\lambda_s&=\sqrt{(R_w-R_m+k_w-k_m)^2+4k_wk_m}\\ f&=\frac{k_w}{k_w+k_m} \end{split}\tag2$$ For 0.55 and 1.5 T, a reliable estimate of $$$\lambda_f$$$ is intractable because of the small amplitude of the fast component. Therefore, averaged $$$k_w$$$ and $$$k_m$$$ from 7 T were used to calculate $$$R_m$$$ $$R_m=\frac{k_wk_m}{R_w+k_w-\lambda_s}+\lambda_s-k_m\tag3$$
Results
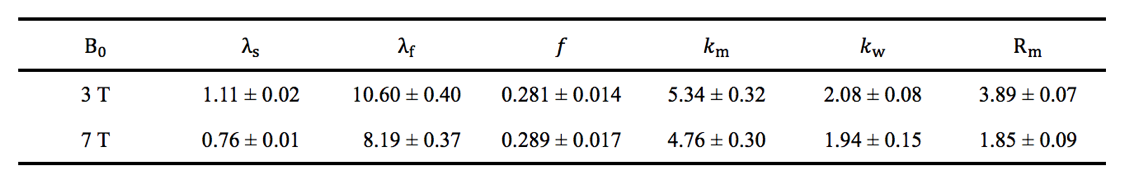
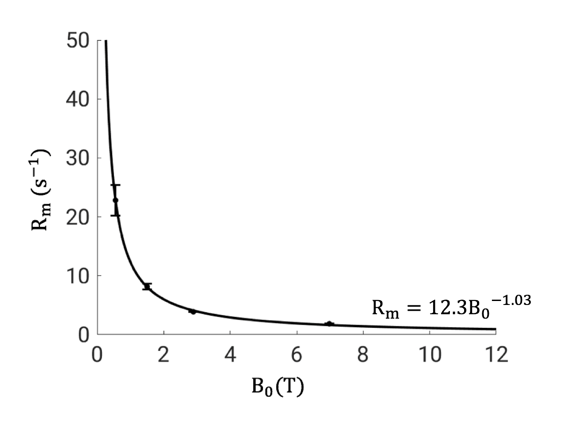
IR and SR images over a range of delay times from a representative subject are shown in Figure 1. As expected, longitudinal recovery becomes slower and MT effect larger with increasing $$$B_0$$$. The averaged signal in the SCC fits well to Eq. (1) with R2>0.999 at all fields (Figure 2). Two-pool analysis results in the SCC are shown in Table 2. Similar $$$f$$$, $$$k_w$$$ and $$$k_m$$$ values are obtained at 3 and 7 T, consistent with previous findings [5]. A significant decrease of $$$R_m$$$ by 52.4% is found from 3 to 7 T, which accounts for the discrepancies in $$$\lambda_f$$$ and $$$\lambda_s$$$ between these two fields. At 1.5 and 0.55 T, $$$\lambda_s$$$ in the SCC is found to be 1.53 $$$\pm$$$ 0.03 s-1 and 1.97 $$$\pm$$$ 0.04 s-1, respectively, and $$$R_m$$$ values are calculated as 8.2 $$$\pm$$$ 0.5 s-1 and 22.8$$$\pm$$$ 2.6 s-1. The measurement results fit well to $$$R_m=12.3B_0^{-1.03}$$$ with R2=0.996 (Figure 3).Conclusion
In human brain white matter, over a clinically relevant range of magnetic field strengths, macromolecular longitudinal relaxation rate $$$R_m$$$ is strongly dependent on the main magnetic field strength $$$B_0$$$ and follows a simple power law according to $$$R_m=12.3B_0^{-1.03}$$$. Combined with a two-pool model of magnetization exchange, this power-law explains the $$$B_0$$$ dependence of tissue T1. The current approach may be further applied to the gray matter for accurate myelination quantification or to project white matter – gray matter contrast at ultra-high fields.Acknowledgements
This study has been supported by the intramural program of NINDS. We would like to acknowledge the assistance of Siemens Healthcare in the modification of the MRI system for operation at 0.55T under an existing cooperative research agreement (CRADA) between NHLBI and Siemens Healthcare.References
1. Koenig SH, Brown RD, Spiller M, Lundbom N. Relaxometry of brain: Why white matter appears bright in MRI. Magn. Reson. Med. 1990;14:482–495 doi: 10.1002/mrm.1910140306.
2. Bottomley PA, Foster TH, Argersinger RE, Pfeifer LM. A review of normal tissue hydrogen NMR relaxation times and relaxation mechanisms from 1–100 MHz: Dependence on tissue type, NMR frequency, temperature, species, excision, and age. Med. Phys. 1984;11:425–448 doi: 10.1118/1.595535.
3. Rooney WD, Johnson G, Li X, et al. Magnetic field and tissue dependencies of human brain longitudinal 1H2O relaxation in vivo. Magn. Reson. Med. 2007;57:308–318 doi: 10.1002/mrm.21122.
4. Korb J-P, Bryant RG. Magnetic field dependence of proton spin-lattice relaxation times. Magn. Reson. Med. 2002;48:21–26 doi: 10.1002/mrm.10185.
5. van Gelderen P, Jiang X, Duyn JH. Effects of magnetization transfer on T1 contrast in human brain white matter. NeuroImage 2016;128:85–95 doi: 10.1016/j.neuroimage.2015.12.032.
6. van Gelderen P, Jiang X, Duyn JH. Rapid measurement of brain macromolecular proton fraction with transient saturation transfer MRI. Magn. Reson. Med. 2017;77:2174–2185 doi: 10.1002/mrm.26304.
7. Tannús A, Garwood M. Adiabatic pulses. NMR Biomed. 1997;10:423–434 doi: 10.1002/(SICI)1099-1492(199712)10:8<423::AID-NBM488>3.0.CO;2-X.
8. Gossuin Y, Roch A, Muller RN, Gillis P. Relaxation induced by ferritin and ferritin-like magnetic particles: The role of proton exchange. Magn. Reson. Med. 2000;43:237–243 doi: 10.1002/(SICI)1522-2594(200002)43:2<237::AID-MRM10>3.0.CO;2-5.
Figures