0525
In vivo irreversible and reversible transverse relaxation rates in human cerebral cortex via line scans at 7T with 250 micron radial resolution1Harvard Medical School, Boston, MA, United States, 2Department of Radiology, Boston Children's Hospital, Boston, MA, United States, 3Athinoula A. Martinos Center for Biomedical Imaging, Department of Radiology, Massachusetts General Hospital, Charlestown, MA, United States, 4Harvard-MIT Division of Health Sciences and Technology, Massachusetts Institute of Technology, Cambridge, MA, United States
Synopsis
A novel “line-scan GESSE” pulse sequence was used to measure irreversible and reversible transverse relaxation rates—R2 and R2´, respectively—in the cerebral cortex of eight healthy human subjects, scanned at 7T with extremely high resolution (250 μm) in the radial direction, i.e., perpendicular to the cortical surface. Within primary visual (V1), motor (M1) and somatosensory (S1) cortex, we observed patterns of R2 versus cortical depth that were quite consistent across subjects. These patterns are also consistent with the intracortical non-heme iron content in these areas, known from prior histology studies.
Introduction
Knowledge of transverse relaxation rates as a function of cortical depth may provide information that ultimately enables noninvasive investigation of the laminar architecture of cerebral cortex. Measuring these rates in vivo in humans is challenging since cortical gray matter is typically only a few millimeters thick, requiring voxels that are small enough to sample cortex at several depths while maintaining adequate signal-to-noise ratio (SNR) within realistic acquisition times. One solution to this problem is to make the voxel size small along the radial direction (i.e., perpendicular to the cortical sheet)—a direction in which structure varies quite substantially—with much larger voxel size (providing higher SNR) in the tangential directions, along which structure varies little. Such anisotropic voxel geometries are readily achieved with a line-scan sequence[1–3], into which we incorporated GESSE readouts[4] (Fig. 1), enabling the simultaneous measurement of irreversible transverse relaxation rates, R2=1/T2, and reversible transverse relaxation rates, R2´=1/T2´. The goal of this study was to use this novel “line-scan GESSE” sequence to measure R2 and R2´ in vivo at 7T with extremely high (250 μm) radial resolution in three well-studied cortical areas: primary visual (V1), motor (M1) and somatosensory (S1) cortex.Methods
Eight healthy volunteers (2F/6M, ages: 24–37 years), having given informed consent, were scanned on a Siemens 7T whole-body scanner using a custom-built 32-channel head receive coil and birdcage transmit coil. On each volunteer, a 0.75×0.75×0.75 mm3 FOCI-ME-MPRAGE scan[5] was acquired and used as the anatomical localizer for subsequent line-scan GESSE acquisitions. For subjects 1–3, a single line was prescribed perpendicularly to two patches of V1 on either bank of the calcarine sulcus (e.g., see Fig. 2, top panel). For subjects 4–8, the line was prescribed perpendicularly to M1 and S1, which lie on the anterior and posterior bank of the central sulcus, respectively (e.g., see Fig. 3, top panel). Line-scan GESSE data were acquired in ~9 minutes with the following parameters: TR = 2 s, 256 repetitions, 7 unipolar gradient echoes with the 4th gradient echo coinciding with the spin echo at TE = 50 ms (BW = 305 Hz/px). The voxel size along the line was 250 μm, with a 256 mm readout field-of-view and nominal line thickness of 3 mm.For each voxel, complex-valued data were averaged across repetitions prior to root-sum-of-squares coil combination. Monoexponential fits to signals on either side of the spin echo then yielded per-voxel R2 and R2´ values[4,6], as illustrated in Fig. 1 (bottom panel). Although this plot displays the signal logarithm ln(S), with monoexponentials appearing as straight lines, the actual fits were to S, performed with the (nonlinear least-squares) Levenberg-Marquardt algorithm in MATLAB.
Results
Fig. 2 shows plots of R2 and R2´ in V1 for subjects 1–3. An R2 peak near the center of V1 can consistently be appreciated in these subjects. On the other hand, it is hard to discern a pattern with regard to R2´ as a function of cortical depth. Fig. 3 shows plots of R2 and R2´ in M1 and S1 for subjects 4–8. Both areas also exhibit an intracortical R2 peak, although the peak appears to be rather broad in M1, with no consistent pattern again for R2´.Discussion
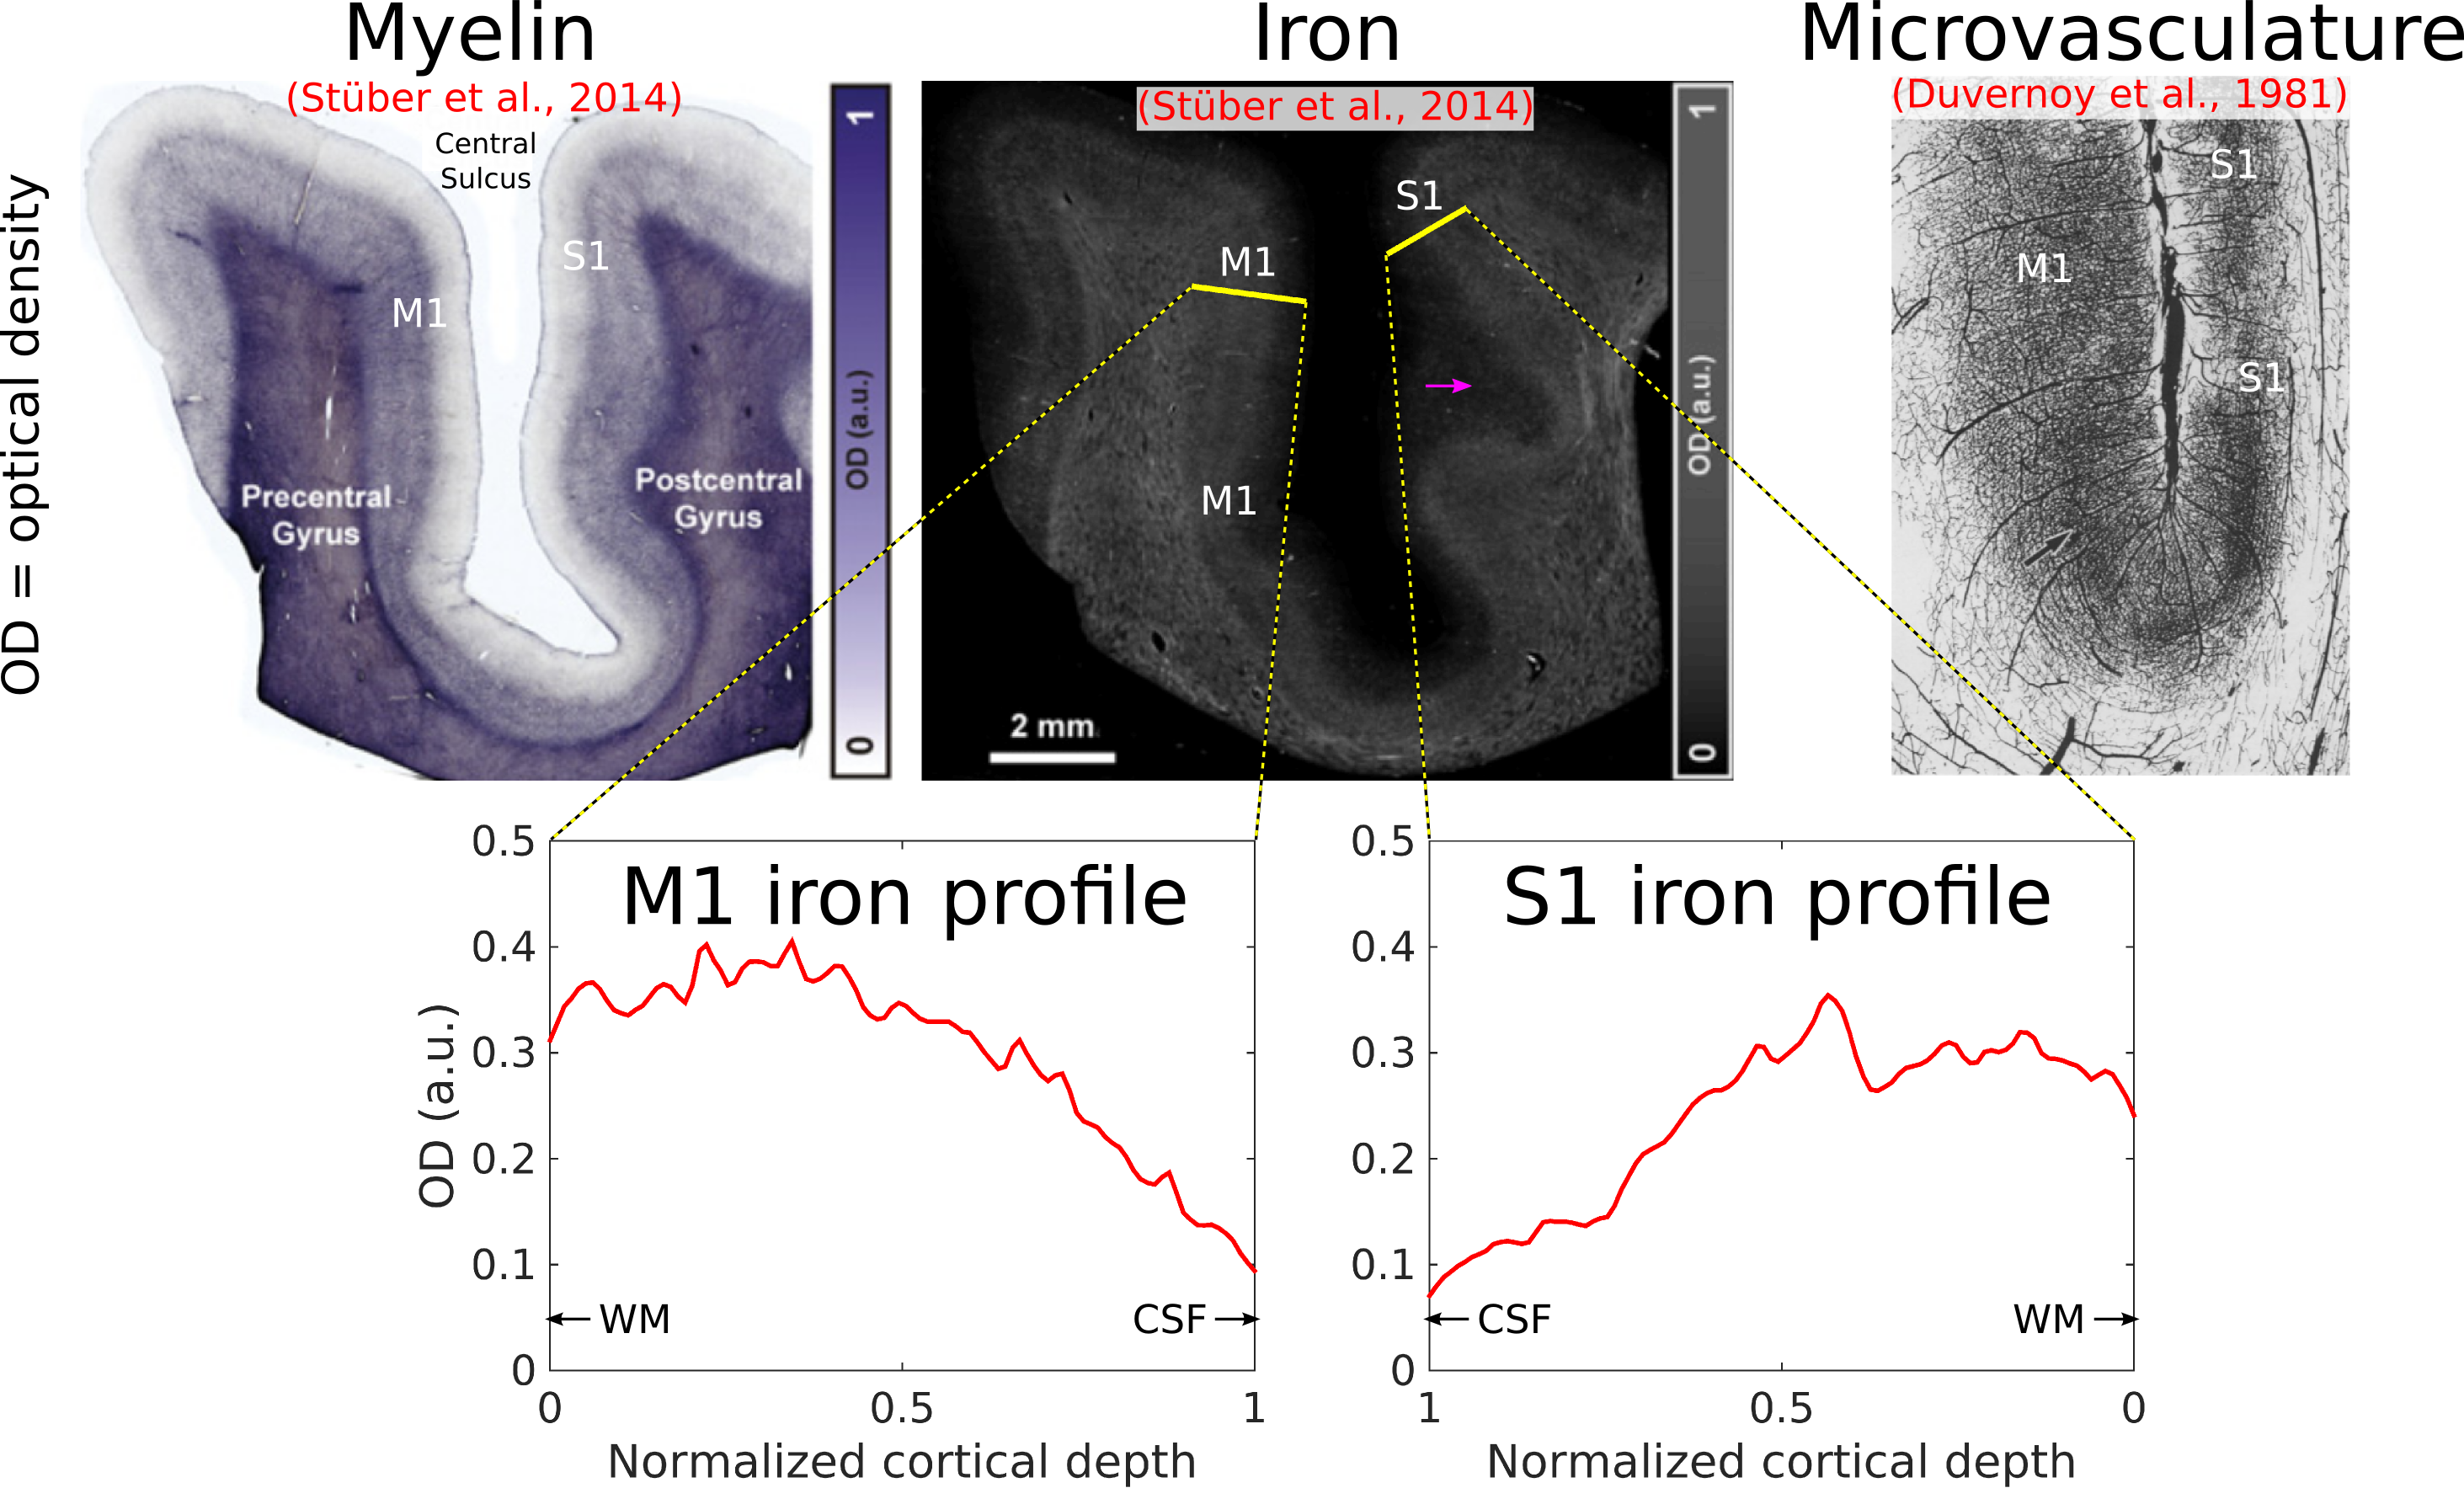
We have shown here patterns of intracortical R2 variation in the living human brain that have not, to our knowledge, been observed before. The high (250 μm) radial resolution of our data, enabled by the line-scan technique, was critical in making these observations, allowing cortex to be sampled with a relatively large number of points. These R2 patterns, consistent across subjects, were conspicuous without averaging data across different locations on the cortical sheet—a common practice in studies of the cortical depth dependence of MR signals[7,8], but one that is problematic since variability in the depth of cortical laminae[9,10] could lead to undesired mixing of signals across layers. We failed to observe any consistent intracortical R2´ patterns, which is perhaps unsurprising given the sensitivity of R2´ to variables such as shim quality, proximity to large pial veins, and tissue orientation relative to the main magnetic field.[11]Cortical R2 could be sensitive to myelin, non-heme iron (e.g., ferritin) or microvascular density (via the presence of deoxyhemoglobin in small vessels) or some combination of the above. It is known from histology that in V1, these quantities all peak in the middle layers[12,13] (Fig. 4). The absence of strong R2 contrast between gray and white matter, however, argues against a primary sensitivity to myelin. In S1, iron and microvascular density also appear to be higher in the middle layers, but in M1, microvascular density is known to be quite homogenous across cortical depth, unlike iron[13,14] (Fig. 5), supporting an interpretation of laminar R2 profiles being shaped primarily by non-heme iron content. Although such an interpretation is appealing, R2 is also sensitive to other quantities (e.g., water and protein content), and so the explanation for the R2 patterns observed here may ultimately lie elsewhere. Regardless of their origin, these patterns are arguably interesting in their own right and, in combination with other MR features, may prove valuable for the in vivo delineation of cortical layers and areas.[15]
Acknowledgements
The authors would like to thank Nina Fultz and Kyle Droppa for their assistance with subject recruitment and data acquisition. This work was supported by NIH grants P41-EB015896, U01-EB026996, R01-EB019437 and R01-MH111419, the Athinoula A. Martinos Center for Biomedical Imaging, and the Radiology Departments at BCH and MGH, and made possible by the resources provided by NIH Shared Instrumentation Grant S10-RR019371.References
[1] Mansfield P, Maudsley AA. Line scan proton spin imaging in biological structures by NMR. Phys Med Biol 1976;21:847–852.
[2] Maudsley A. Multiple-line-scanning spin density imaging. J Magn Reson 1980;41:112–126.
[3] Crooks LE. Selective irradiation line scan techniques for NMR imaging. IEEE Trans Nucl Sci 1980;27:1239–1244.
[4] Yablonskiy DA, Haacke EM. An MRI method for measuring T2 in the presence of static and RF magnetic field inhomogeneities. Magn Reson Med 1997;37:872–876.
[5] Zaretskaya N, Fischl B, Reuter M, Renvall V, Polimeni JR. Advantages of cortical surface reconstruction using submillimeter 7 T MEMPRAGE. Neuroimage 2018;165:11–26.
[6] Mulkern RV, Balasubramanian M, Mitsouras D. On the Lorentzian versus Gaussian character of time-domain spin-echo signals from the brain as sampled by means of gradient-echoes: Implications for quantitative transverse relaxation studies. Magn Reson Med 2015;74:51–62.
[7] Koopmans PJ, Barth M, Orzada S, Norris DG. Multi-echo fMRI of the cortical laminae in humans at 7 T. Neuroimage 2011;56:1276–1285.
[8] Marques JP, Khabipova D, Gruetter R. Studying cyto and myeloarchitecture of the human cortex at ultra-high field with quantitative imaging: R1, R2* and magnetic susceptibility. Neuroimage 2017;147:152–163.
[9] Waehnert MD, Dinse J, Weiss M, Streicher MN, Waehnert P, Geyer S, Turner R, Bazin P-L. Anatomically motivated modeling of cortical laminae. Neuroimage 2014;93 Pt 2:210–220.
[10] Hinds O, Balasubramanian M, Augustinack JC, Schwartz EL, Fischl B, Polimeni JR. Variation in cortical depth of the stria of Gennari seen in high-resolution ex vivo MRI of human V1. 21st Annu Meet Organ Hum Brain Mapp 2015;21:WT4084.
[11] Cohen-Adad J, Polimeni JR, Helmer KG, Benner T, McNab JA, Wald LL, Rosen BR, Mainero C. T2* mapping and B0 orientation-dependence at 7T reveal cyto- and myeloarchitecture organization of the human cortex. Neuroimage 2012;60:1006–1014.
[12] Fukunaga M, Li T-Q, van Gelderen P, de Zwart JA, Shmueli K, Yao B, Lee J, Maric D, Aronova MA, Zhang G, Leapman RD, Schenck JF, Merkle H, Duyn JH. Layer-specific variation of iron content in cerebral cortex as a source of MRI contrast. Proc Natl Acad Sci U S A 2010;107:3834–3839.
[13] Duvernoy HM, Delon S, Vannson JL. Cortical blood vessels of the human brain. Brain Res Bull 1981;7:519–579.
[14] Stüber C, Morawski M, Schäfer A, Labadie C, Wähnert M, Leuze C, Streicher M, Barapatre N, Reimann K, Geyer S, Spemann D, Turner R. Myelin and iron concentration in the human brain: a quantitative study of MRI contrast. Neuroimage 2014;93 Pt 1:95–106.
[15] Trampel R, Bazin P-L, Pine K, Weiskopf N. In-vivo magnetic resonance imaging (MRI) of laminae in the human cortex. NeuroImage 2017;197:707–715.
Figures