0524
Efficient mapping of ultra-fast T2* decay1Institute for Biomedical Engineering, ETH Zurich and University of Zurich, Zurich, Switzerland
Synopsis
With recent developments in gradient hardware even tissues with T2s down to tens of microseconds have become accessible for MRI. Hence, mapping signal decay or imaging short-T2 tissues selectively is of particular interest.
This can be performed using ultra-short echo time imaging with multiple TEs. However, for typical resolutions this approach is limited to T2s down to hundreds of microseconds.
In this work, the PETRA and HYFI techniques are utilized to map the signal decay of samples with T2s down to 54 μs. Considerably larger scan efficiency is obtained for the HYFI approach.
Introduction
Direct depiction of tissues with transverse relaxation times T2 or T2* in the sub-millisecond range, such as e.g. bone, teeth, or lung has a great potential for further expanding the scientific and diagnostic value of MRI (1). With recent developments in gradient hardware (2) even tissues with T2s down to tens of microseconds, e.g. the myelin sheath (3), have become accessible. In this context, mapping signal decay or imaging short-T2 tissues selectively is of particular interest.A common technique applied for this purpose is radial ultra-short echo time (UTE) imaging with multiple TEs (4,5). However, for typical resolutions the UTE approach is limited to T2s down to hundreds of microseconds. Imaging of shorter T2s can be accomplished by avoiding any gradient ramping after excitation with the radial zero echo time (ZTE) technique (6)(Fig. 1a), yet preventing increasing TE and hence T2 weighting. The latter is possible with single-point imaging (SPI)(7), yet at the price of greatly reduced SNR efficiency.
In this work, the PETRA (8)(Fig. 1c) and HYFI (9)(Fig. 1d) techniques are utilized to enable mapping of very rapid signal decay. Both approaches improve scan efficient by combining ZTE and SPI data using different strategies while the option for T2 weighting is still available. These features are employed here for mapping samples with T2s down to 54 μs, clearly demonstrating highest efficiency for HYFI.
Methods
HardwareAll experiments were performed on a 3T Achieva MRI system (Philips Healthcare, Best, Netherlands), complemented with dedicated short-T2-MRI hardware: a high-performance insert gradient capable of reaching 200 mT/m at full duty cycle (2), symmetrically biased transmit-receive switches with switching times of approximately 3µs at 3T (10), and a high-end spectrometer with up to 4 MHz acquisition bandwidth and short digital filters with group delays down to 1.2µs (11). A largely 1H-free RF loop coil was used for both transmission and reception (12).
Imaging
Data were acquired with HYFI and PETRA (Fig. 1) where the inner k-space was increased so that it contains all the k-space support but the outermost Nyquist interval. The acquisition of same image geometry with increasing TE was obtained by increasing the dead time and reducing the gradient accordingly. In PETRA and HYFI, the echo time is defined to be equal to the dead time. For HYFI, the decay constant was set to A=0.1 for target T2=TE.
Images were reconstructed using an iterative conjugate gradient algorithm complemented with a pulse profile correction algorithm (13,14).
Samples
An imaging phantom with a range of T2 values was created by filling six solutions of MnCl2 with concentrations of 240,120,60,30,15 and 7.5 mMol into glass vials. For measurement of the transverse relaxation times, the solutions were filled into glass spheres of diameter 20mm to minimize susceptibility effects.
Results
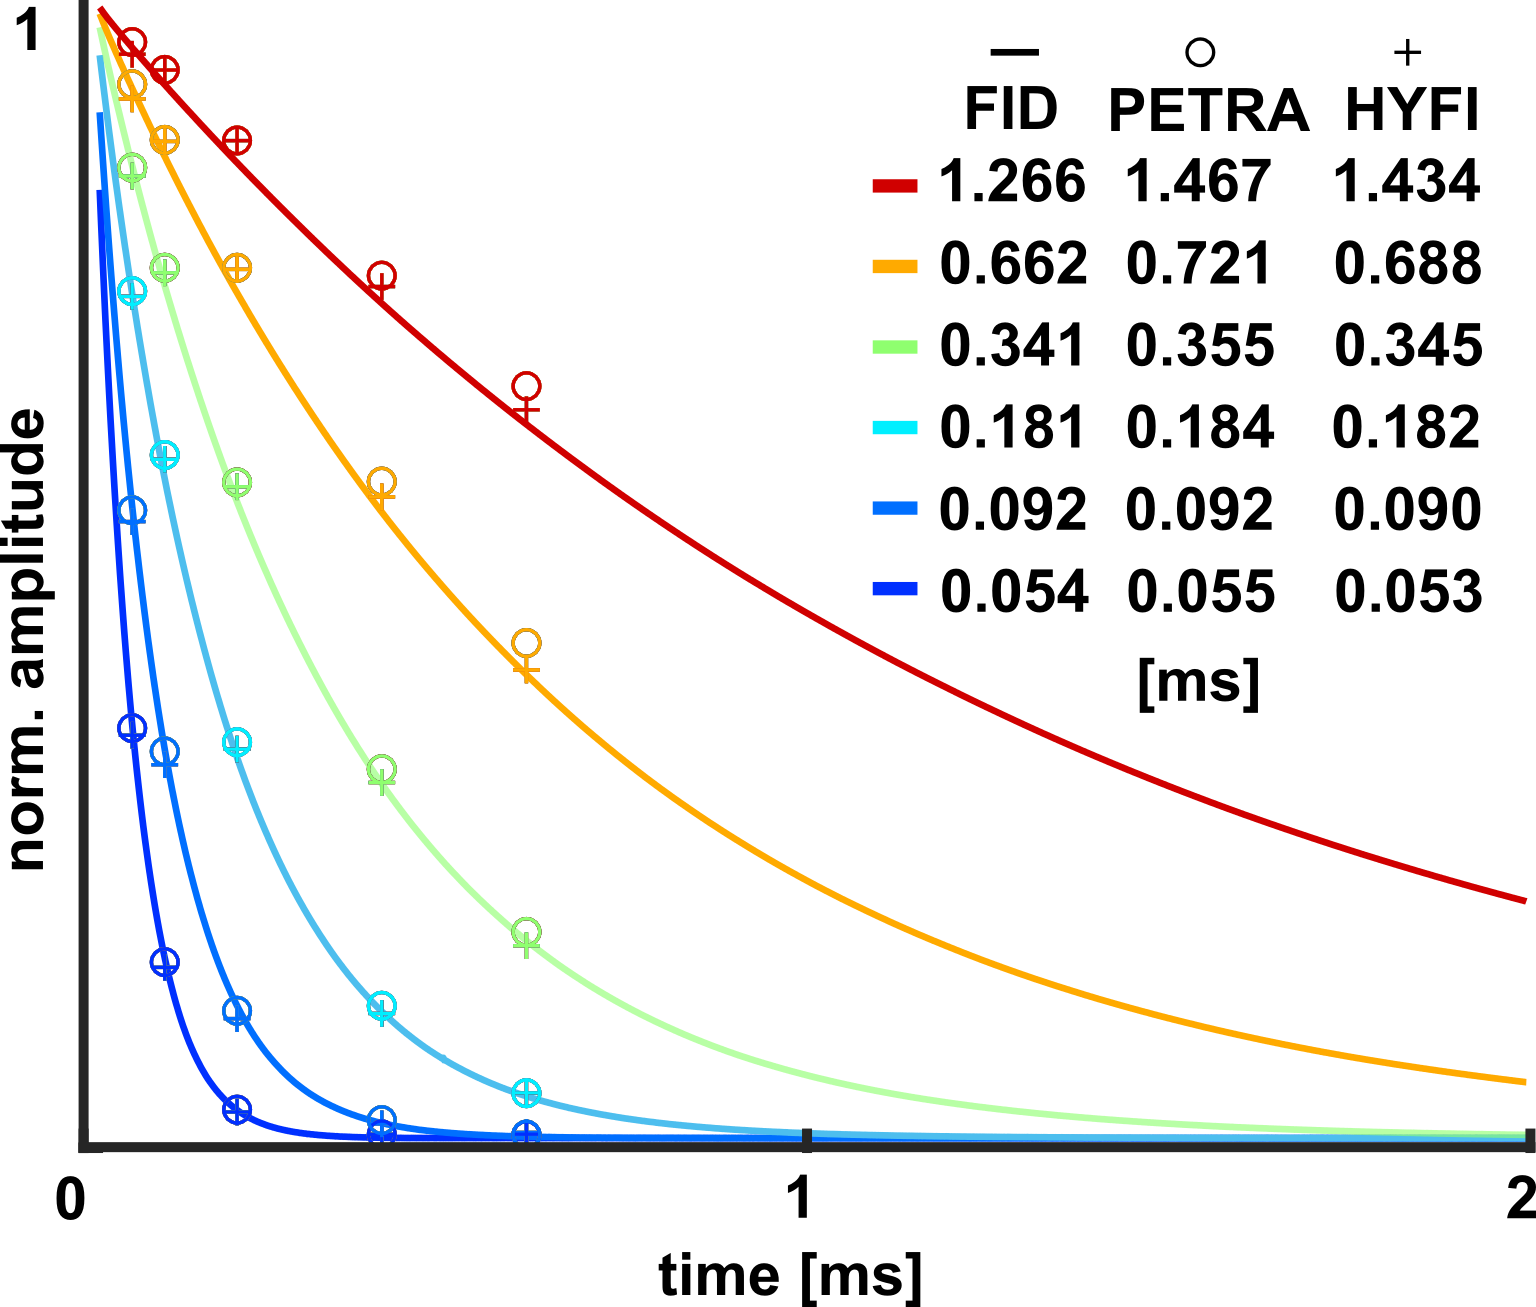
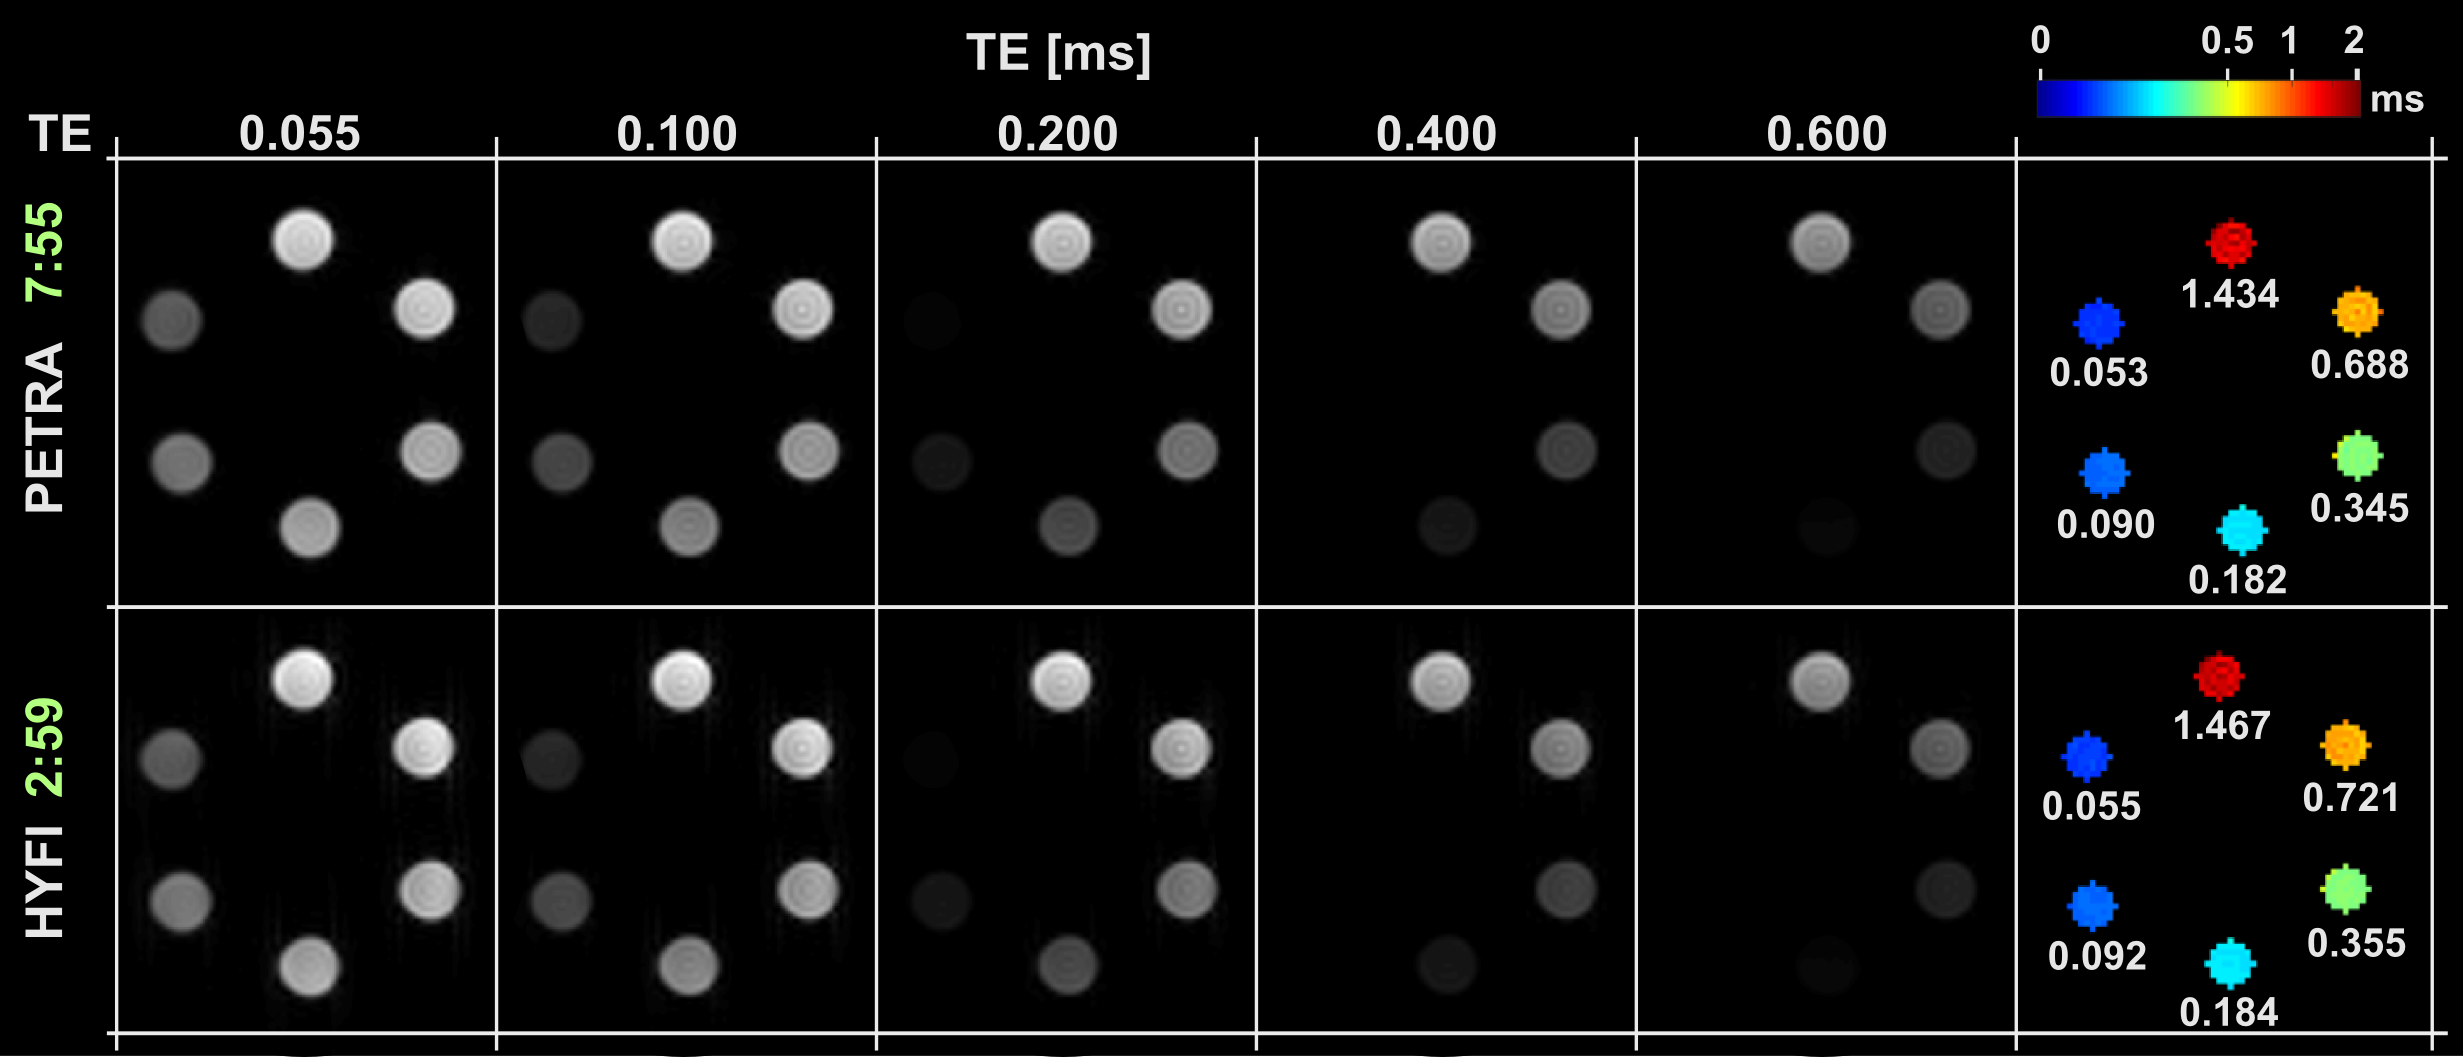
Fig. 2: The signal decay of each MnCl2 solution was fitted with single exponentials for three different data types: FIDs and PETRA or HYFI echo series. They provide the indicated relaxation constants with very good agreement especially in the short-T2 range. However, HYFI seems to consistently underestimate T2 values as compared to PETRA.Fig. 3: Two echo series of similar image quality were obtained with HYFI and PETRA while HYFI required only 37% of the scan time needed by PETRA.
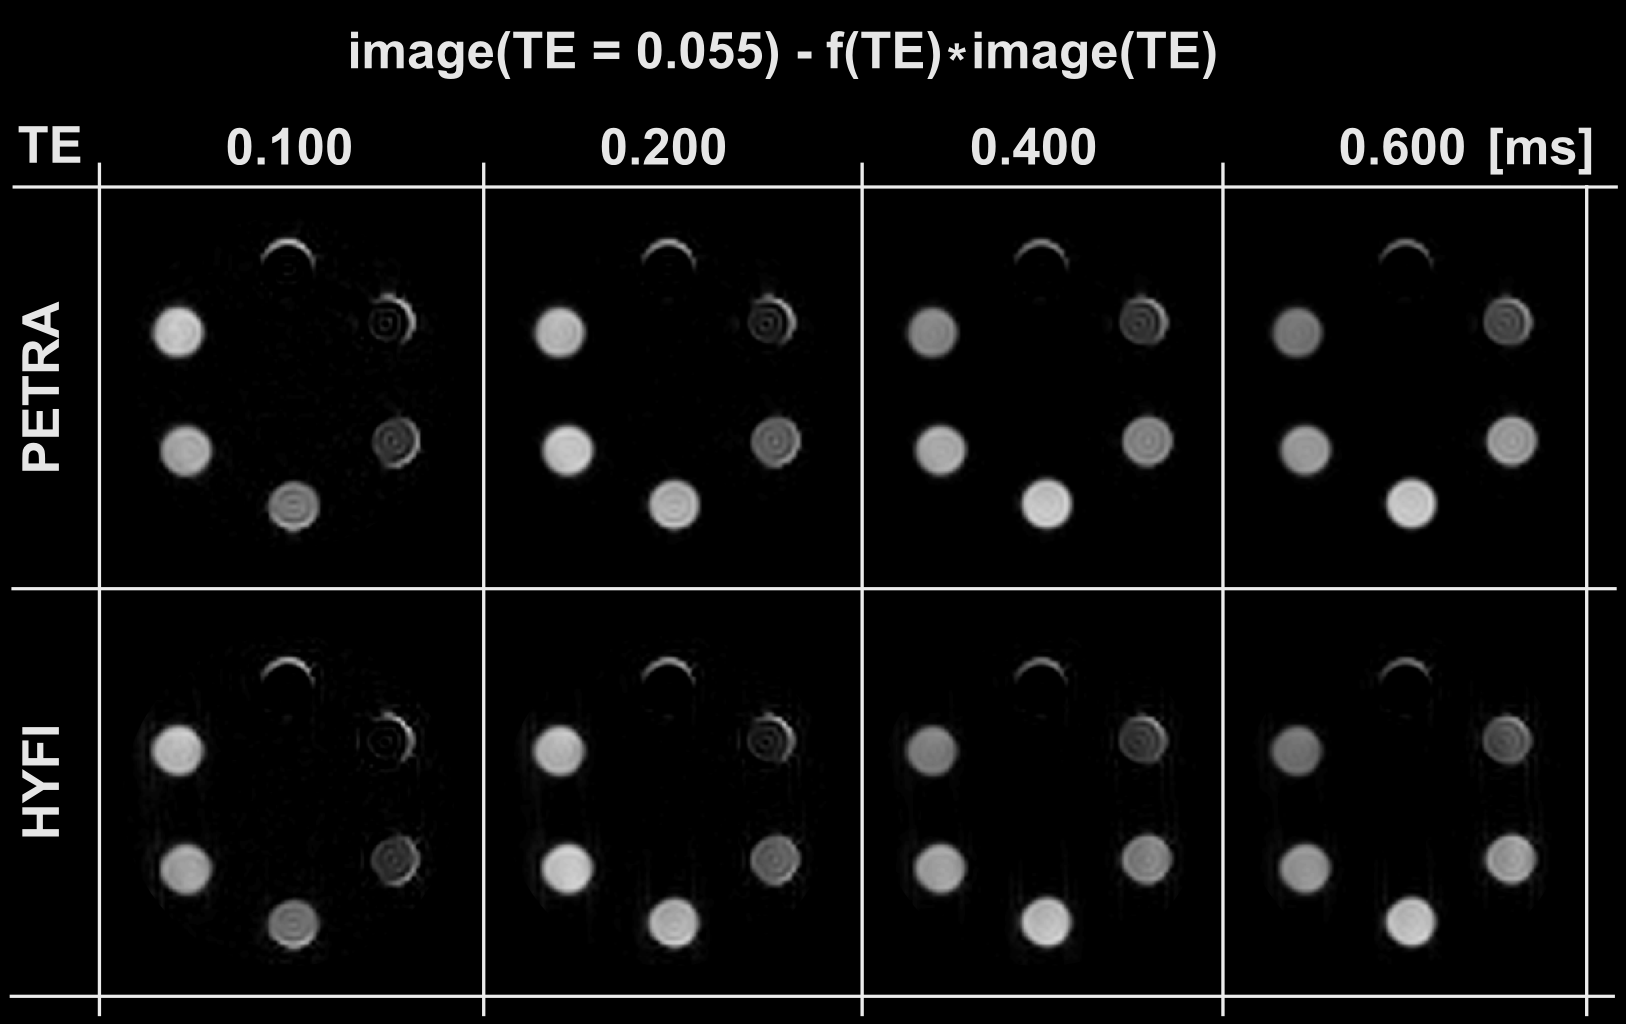
Fig. 4: Weighted subtractions(15) of the shortest and one longer TE efficiently suppress long-T2 signals and provide a large variety of short-T2 contrast in the sub-millisecond range. Only a small edge artefact is observed for longer T2s (for both HYFI and PETRA).
Discussion
Very good agreement was obtained for T2s derived from FIDs and both mapping approaches. Faster decay in FIDs at longer relaxation times indicates dephasing due to residual inhomogeneity, which is reduced by separating locations in the mapping techniques. Deviations between HYFI and PETRA are associated with the different strategies used for the inner k-space. Indeed in HYFI, choosing TE equal to the dead time slightly underestimates the actual time of acquisition of the radial data points (as opposed to PETRA where all data are acquired at TE), leading to somewhat lower T2 values. This might be addressed by a more sophisticated data analysis.Weighted subtractions of HYFI data (Fig. 4) show great potential to introduce versatile contrast in the short-T2 range while preserving acceptable scanning efficiency. This may be especially interesting for direct imaging of the myelin sheath in which the majority of the signal is expected to decay in less than a 100 µs(16,17).
The edge artifact in Fig. 4 will require further investigation. It may stem from gradient imperfections due to strong eddy currents occurring at high-bandwidth, thus mostly affecting the shortest-TE image.
Conclusion
Multi-TE HYFI imaging enables mapping and T2-contrast generation for samples with ultra-short T2s down to tens of microseconds. It proved to be significantly more time-efficient than its PETRA counterpart relying on more SPI scanning. Further speed-up is possible by changing the partition of inner and outer k-space but this requires careful consideration with respect to mapping fidelity. The presented approach allows a large variety of T2 contrast in the sub-millisecond range, suggesting applications in domains such as direct depiction of the myelin sheath, bone or teeth imaging, as well as material studies.Acknowledgements
No acknowledgement found.References
(1) Weiger M, Pruessmann KP. Short-T2 MRI: Principles and recent advances. Prog Nucl Magn Reson Spectrosc 2019.
(2) Weiger M, Overweg J, Rösler MB, Froidevaux R, Hennel F, Wilm BJ, Penn A, Sturzenegger U, Schuth W, Mathlener M, et al. A high-performance gradient insert for rapid and short-T 2 imaging at full duty cycle. Magn Reson Med 2018;79:3256–66.
(3) Seifert AC, Li C, Wilhelm MJ, Wehrli SL, Wehrli FW. Towards quantification of myelin by solid-state MRI of the lipid matrix protons. Neuroimage 2017;163:358–67.
(4) Rahmer J, Blume U, Börnert P. Selective 3D ultrashort TE imaging: Comparison of “dual-echo” acquisition and magnetization preparation for improving short-T2 contrast. Magn Reson Mater Physics, Biol Med 2007;20:83–92.
(5) Du J. Quantitative Ultrashort TE (UTE) Imaging of Short T 2 Tissues . Encycl Magn Reson 2012;1:801–10.
(6) Weiger M, Pruessmann KP. MRI with zero echo time. Encycl Magn Reson 2012;1:311–22. (7) Balcom BJ, Macgregor RP, Beyea SD, Green DP, Armstrong RL, Bremner TW. Single-point ramped imaging with T1 enhancement (SPRITE). J Magn Reson 1996;123:131–4.
(8) Grodzki DM, Jakob PM, Heismann B. Ultrashort echo time imaging using pointwise encoding time reduction with radial acquisition (PETRA). Magn Reson Med 2012;67:510–8.
(9) Froidevaux R, Weiger M, Rösler MB, Brunner DO, Pruessmann KP. HYFI: Hybrid filling of the dead-time gap for faster zero echo time imaging. Proc 27th Annu Meet ISMRM, Montr Canada 2019:943.
(10) Brunner DO, Furrer L, Weiger M, Baumberger W, Schmid T, Reber J, Dietrich BE, Wilm BJ, Froidevaux R, Pruessmann KP. Symmetrically biased T/R switches for NMR and MRI with microsecond dead time. J Magn Reson 2016;263:147–55.
(11) Dietrich BE, Brunner DO, Wilm BJ, BarmeT C, Gross S, Kasper L, Haeberlin M, Schmid T, Vannesjo SJ, Pruessmann KP. A field camera for MR sequence monitoring and system analysis. Magn Reson Med 2016;75:1831–40.
(12) Rösler M, Weiger M, Schmid T, Brunner D, Froidevaux R, Pruessmann KP. Ultrasonic soldering on glass for the construction of MRI coils with minimized background signal in short-T2 images. Proc 33rd Annu Sci Meet ESMRMB, Vienna, Austria 2016:87.
(13) Pruessmann KP, Weiger M, Börnert P, Boesiger P. Advances in sensitivity encoding with arbitrary k-space trajectories. Magn Reson Med 2001;46:638–51.
(14) Li C, Magland JF, Zhao X, Seifert AC, Wehrli FW. Selective In Vivo Bone Imaging with Long- T 2 Suppressed PETRA MRI 2017;77:989–97.
(15) Lee HM, Weiger M, Giehr C, Froidevaux R, Brunner DO, Rösler MB, Pruessmann KP. Long‐T2‐suppressed zero echo time imaging with weighted echo subtraction and gradient error correction. Magn Reson Med 2019:1–15.
(16) Weiger M, Froidevaux R, Brunner DO, Rosler M, Pruessmann KP. Advances in Direct Myelin Imaging. Proc 27th Annu Meet ISMRM, Montr 2019:1118.
(17) Wilhelm MJ, Ong HH, Wehrli SL, Li C, Tsai PH, Hackney DB, Wehrli FW. Direct magnetic resonance detection of myelin and prospects for quantitative imaging of myelin density. Proc Natl Acad Sci U S A 2012;109:9605–10.
Figures