0523
ZTE Imaging Across Field Strengths; Opportunities for Low-Field Imaging
Emil Ljungberg1, Brian Burns2, Tobias Wood1, Ana Beatriz Solana3, Peder E.Z. Larson4, Gareth J. Barker1, and Florian Wiesinger1,3
1Neuroimaging, King's College London, London, United Kingdom, 2ASL West, GE Healthcare, Menlo Park, CA, United States, 3ASL Europe, GE Healthcare, Munich, Germany, 4Univeristy of California, San Francisco, San Francisco, CA, United States
1Neuroimaging, King's College London, London, United Kingdom, 2ASL West, GE Healthcare, Menlo Park, CA, United States, 3ASL Europe, GE Healthcare, Munich, Germany, 4Univeristy of California, San Francisco, San Francisco, CA, United States
Synopsis
Zero Echo Time (ZTE) imaging enables ultra-fast, near silent data acquisition. In this work we demonstrate how contrast-to-noise, between white and gray matter in the brain, with a ZTE acquisition changes with field strength. At low field strength, maximum contrast is achievable with low RF power, which is promising for implementation on low field systems. We demonstrate through in vivo experiment that ZTE imaging can be performed at 1.5T/3T/7T, and how variable flip angle data at, for instance, 1.5T can be used for synthesising high quality T1-weighted MR images.
Introduction
Arguably, RUFIS-type ZTE imaging can be considered the simplest MRI pulse sequence possible1. RF excitation is achieved with the readout gradient on via ultra-short hard pulses, such that the RF excitation bandwidth encompasses the acquisition bandwidth (BWRF≥BWACQ)2, with centre-out 3D radial sampling resulting in nominal TE=0. The readout gradient is constant throughout the experiment with only minor directional updates between repetitions, resulting in near silent imaging. Together, this produces a motion-robust acquisition with high sampling efficiency where almost 100% of the repetition time is used for acquiring data (i.e. TR≈TACQ).Here, we analyse steady-state ZTE contrast behaviour across field strengths. Theoretical findings are substantiated by experimental ZTE images acquired at 1.5T, 3T, and 7T. Finally, we’ll briefly sketch requirements for a dedicated low-field ZTE MR system.
Theoretical Maximum Contrast and Flip Angle Constraints
The signal in a steady-state ZTE acquisition (TR<<T1,α<<1 rad) can be expressed as3$$
S(\alpha,TR,T_1,PD)=\sin\alpha\frac{PD(1-e^{-TR/T_1})}{1-\cos\alpha\cdot{e^{-TR/T_1}}}\approx\frac{\alpha PD}{1+\frac{T_1 \alpha^2}{2 TR}}\quad\quad\quad\quad[1]
$$
Maximum contrast-to-noise ratio (CNR) between two tissues A and B is achieved by finding the flip angle which maximises the difference
$$
CNR(A,B)=B_0\cdot\left( S(\alpha,TR,T_{1,A},PD_A)-S(\alpha,TR,T_{1,B},PD_B)\right)\quad\quad [2]
$$
where the SNR is assumed to scale linearly with field strength4. Figure 1 shows the CNR normalised by B0 between white matter (WM) and gray matter (GM) as a function of TR and flip angle for different B0, assuming a B0-dependence of T1 as described by Rooney et al.5. The change in T1 with B0 results in stronger relative CNR at low field (darker red color). The maximum contrast at each TR, traced by the solid black line, shows how longer TR requires higher flip angle for optimal contrast.
For 3D radial sampling, the TR can be limited to only include the acquisition time (TACQ) to maximize encoding efficiency. To reduce chemical shift-artefacts at water-fat interfaces, TACQ<Tip (in-phase time for fat-water) which depends on the field strength6. Thus, the longest TR for optimal sampling efficiency is TR=Tip which is indicated by the dashed vertical lines in Figure 1.
With ZTE, the maximum contrast is not always achievable due to the constraint on the RF pulse width from the receive bandwidth (i.e. BWRF≥BWACQ). At high field strength, higher readout-bandwidth is required which reduces the maximum pulse width and thus flip angle2. The achievable B1-amplitude depends on the RF system, which makes generalisations across field strengths and scanners complicated. To demonstrate this limitation, we simulated RF systems with fixed peak B1 across field strengths, TR=Tip, and a 64-point readout. The results (Figure 2) shows how the flip angle for maximum contrast is only achievable with high peak B1 at low field. However, since the SNR increases linearly with B0, the maximum CNR occurs at different field strengths depending on the RF system.
In vivo experiment
MethodsTo demonstrate ZTE across field strengths, a single healthy volunteer was scanned on three GE MRI scanners: 1.5T MR450w, 3T MR750, 7T MR950 (GE Healthcare, Chicago, WI). ZTE data were acquired on 1.5T and 3T with TR=2.37ms, at BW=±15.625kHz, and α1.5T=[1.0,2.3,3.4,5.0,8.0]°, α3T=3.4°. At 7T, data were collected with TR=1.3ms, at BW=±31.25kHz and α7T=1.9°. The TR at 3T and 7T were close to the in-phase TR described above. Quantitative T1-maps were calculated from the 1.5T VFA data using QUIT7.
Results
Our in vivo experiments showed that 0.25°μs-1 was achievable across scanners, corresponding to B1≈16μT, equivalent to the blue lines in Figure 2. The results from the in vivo experiments show excellent image quality at all field strengths (Figure 3). Images from 3T and 7T, where TR≈TIP, showed similar off-resonance behaviour, indicated with arrows in Figure 3, while the artefacts were lower at 1.5T as expected. The quantitative T1 and PD-maps obtained at 1.5T (Figure 4), were used to generate a synthetic anatomical T1-image, showing strong WM/GM contrast.
Conclusion
Here we have shown that due to peak B1 limitations, the theoretically maximum CNR for a given field strength can only be achieved at low B0. However, with sufficient peak B1, higher field strengths could still provide higher CNR from increased SNR (Figure 2), but B02 dependent RF power absorption makes this practically impossible. Our in vivo experiments showed that steady-state ZTE can be applied across field strengths for T1 and PD contrast, however, ZTE can also be used with magnetisation preparation (MP-ZTE) to achieve T1, T2, MT, and DWI contrast8–12.The bandwidth limitation in ZTE introduces a unique constraint on the acquisition, which in this work was shown to have less impact on the CNR at low field strength. At low field, less powerful RF amplifiers are required to obtain a given peak B1, compared to high field, thus potentially reducing costs. With less power needed for RF excitation, faster switching between transmit and receive can be achieved in the RF system, which reduces the deadtime gap13. Furthermore, a low field MR system for ZTE could be developed with low power gradient amplifiers, as the incremental gradient updates in ZTE requires low slew rate, and low readout bandwidth requires low gradient amplitude. We believe ZTE/MP-ZTE offers an unexplored opportunity for low field imaging with low performance requirements on the system and high contrast using a silent readout.
Acknowledgements
E. Ljungberg is in receipt of a PhD studentship jointly funded by General Electric (GE) Healthcare and the National Institute for Health Research (NIHR) Biomedical Research Centre at South London and Maudsley NHS Foundation Trust and King’s College London. The views expressed are those of the author and not necessarily those of the NHS, the NIHR or the Department of Health and Social Care.References
- Madio DP, Lowe IJ. Ultra-Fast Imaging Using Low Flip Angles and FIDs. Magn Reson Med. 1995;34(4):525–9.
- Grodzki DM, Jakob PM, Heismann B. Correcting slice selectivity in hard pulse sequences. J Magn Reson. 2012;214:61–7.
- Christensen KA, Grant DM, Schulman EM, Walling C. Optimal determination of relaxation times of fourier transform nuclear magnetic resonance. Determination of spin-lattice relaxation times in chemically polarized species. J Phys Chem. 1974;78(19):1971–7.
- Edelstein WA, Glover GH, Hardy CJ, Redington RW. The intrinsic signal‐to‐noise ratio in NMR imaging. Magn Reson Med. 1986;3(4):604–18.
- Rooney WD, Johnson G, Li X, Cohen ER, Kim SG, Ugurbil K, et al. Magnetic field and tissue dependencies of human brain longitudinal 1H2O relaxation in vivo. Magn Reson Med. 2007;57(2):308–18.
- Engström M, McKinnon G, Cozzini C, Wiesinger F. In‐phase zero TE musculoskeletal imaging. Magn Reson Med. 2019;(July):1–8.
- Wood TC. QUIT: QUantitative Imaging Tools. J Open Source Softw [Internet]. 2017;3(26):656. Available from: https://github.com/spinicist/QUIT
- Ljungberg E, Wiesinger F, Wood TC. Silent Structural Imaging and T1-mapping with a Rapid-Radial Twice-Prepared (R2P2) Sequence. In: Proc Intl Soc Mag Reson Med 27. Montreal; 2019. p. 4636.
- Ljungberg E, Burns B, Wood T, Kolind S, Wiesinger F, Barker GJ. Rapid, multi-TE, T2-prepared RUFIS for Silent T2-weighted imaging. In: Proc Intl Soc Mag Reson Med 27. Montreal; 2019. p. 4571.
- Wood TC, Ljungberg E, Sanchez AS, Wiesinger F. Silent Myelin Imaging with a dipolar-coupled / inhomogeneous MT-Prepared ZTE Radial Sequence. In: Proc Intl Soc Mag Reson Med 27. Montreal; 2019. p. 4896.
- Yuan J, Hu Y, Menini A, Sandino CM, Sandberg J, Alley MT, et al. Silent Distortionless DWI. Proc Intl Soc Mag Reson Med 27. 2019;3489.
- Solana AB, Menini A, Sacolick LI, Hehn N, Wiesinger F. Quiet and Distortion-Free , Whole Brain BOLD fMRI Using T2 -Prepared RUFIS. Magn Reson Med. 2016;75:1402–12.
- Froidevaux R, Weiger M, Brunner DO, Dietrich BE, Wilm BJ, Pruessmann KP. Filling the dead time gap in zero echo time MRI: principles compared. Magn Reson Med. 2017;00(00):1–10.
Figures
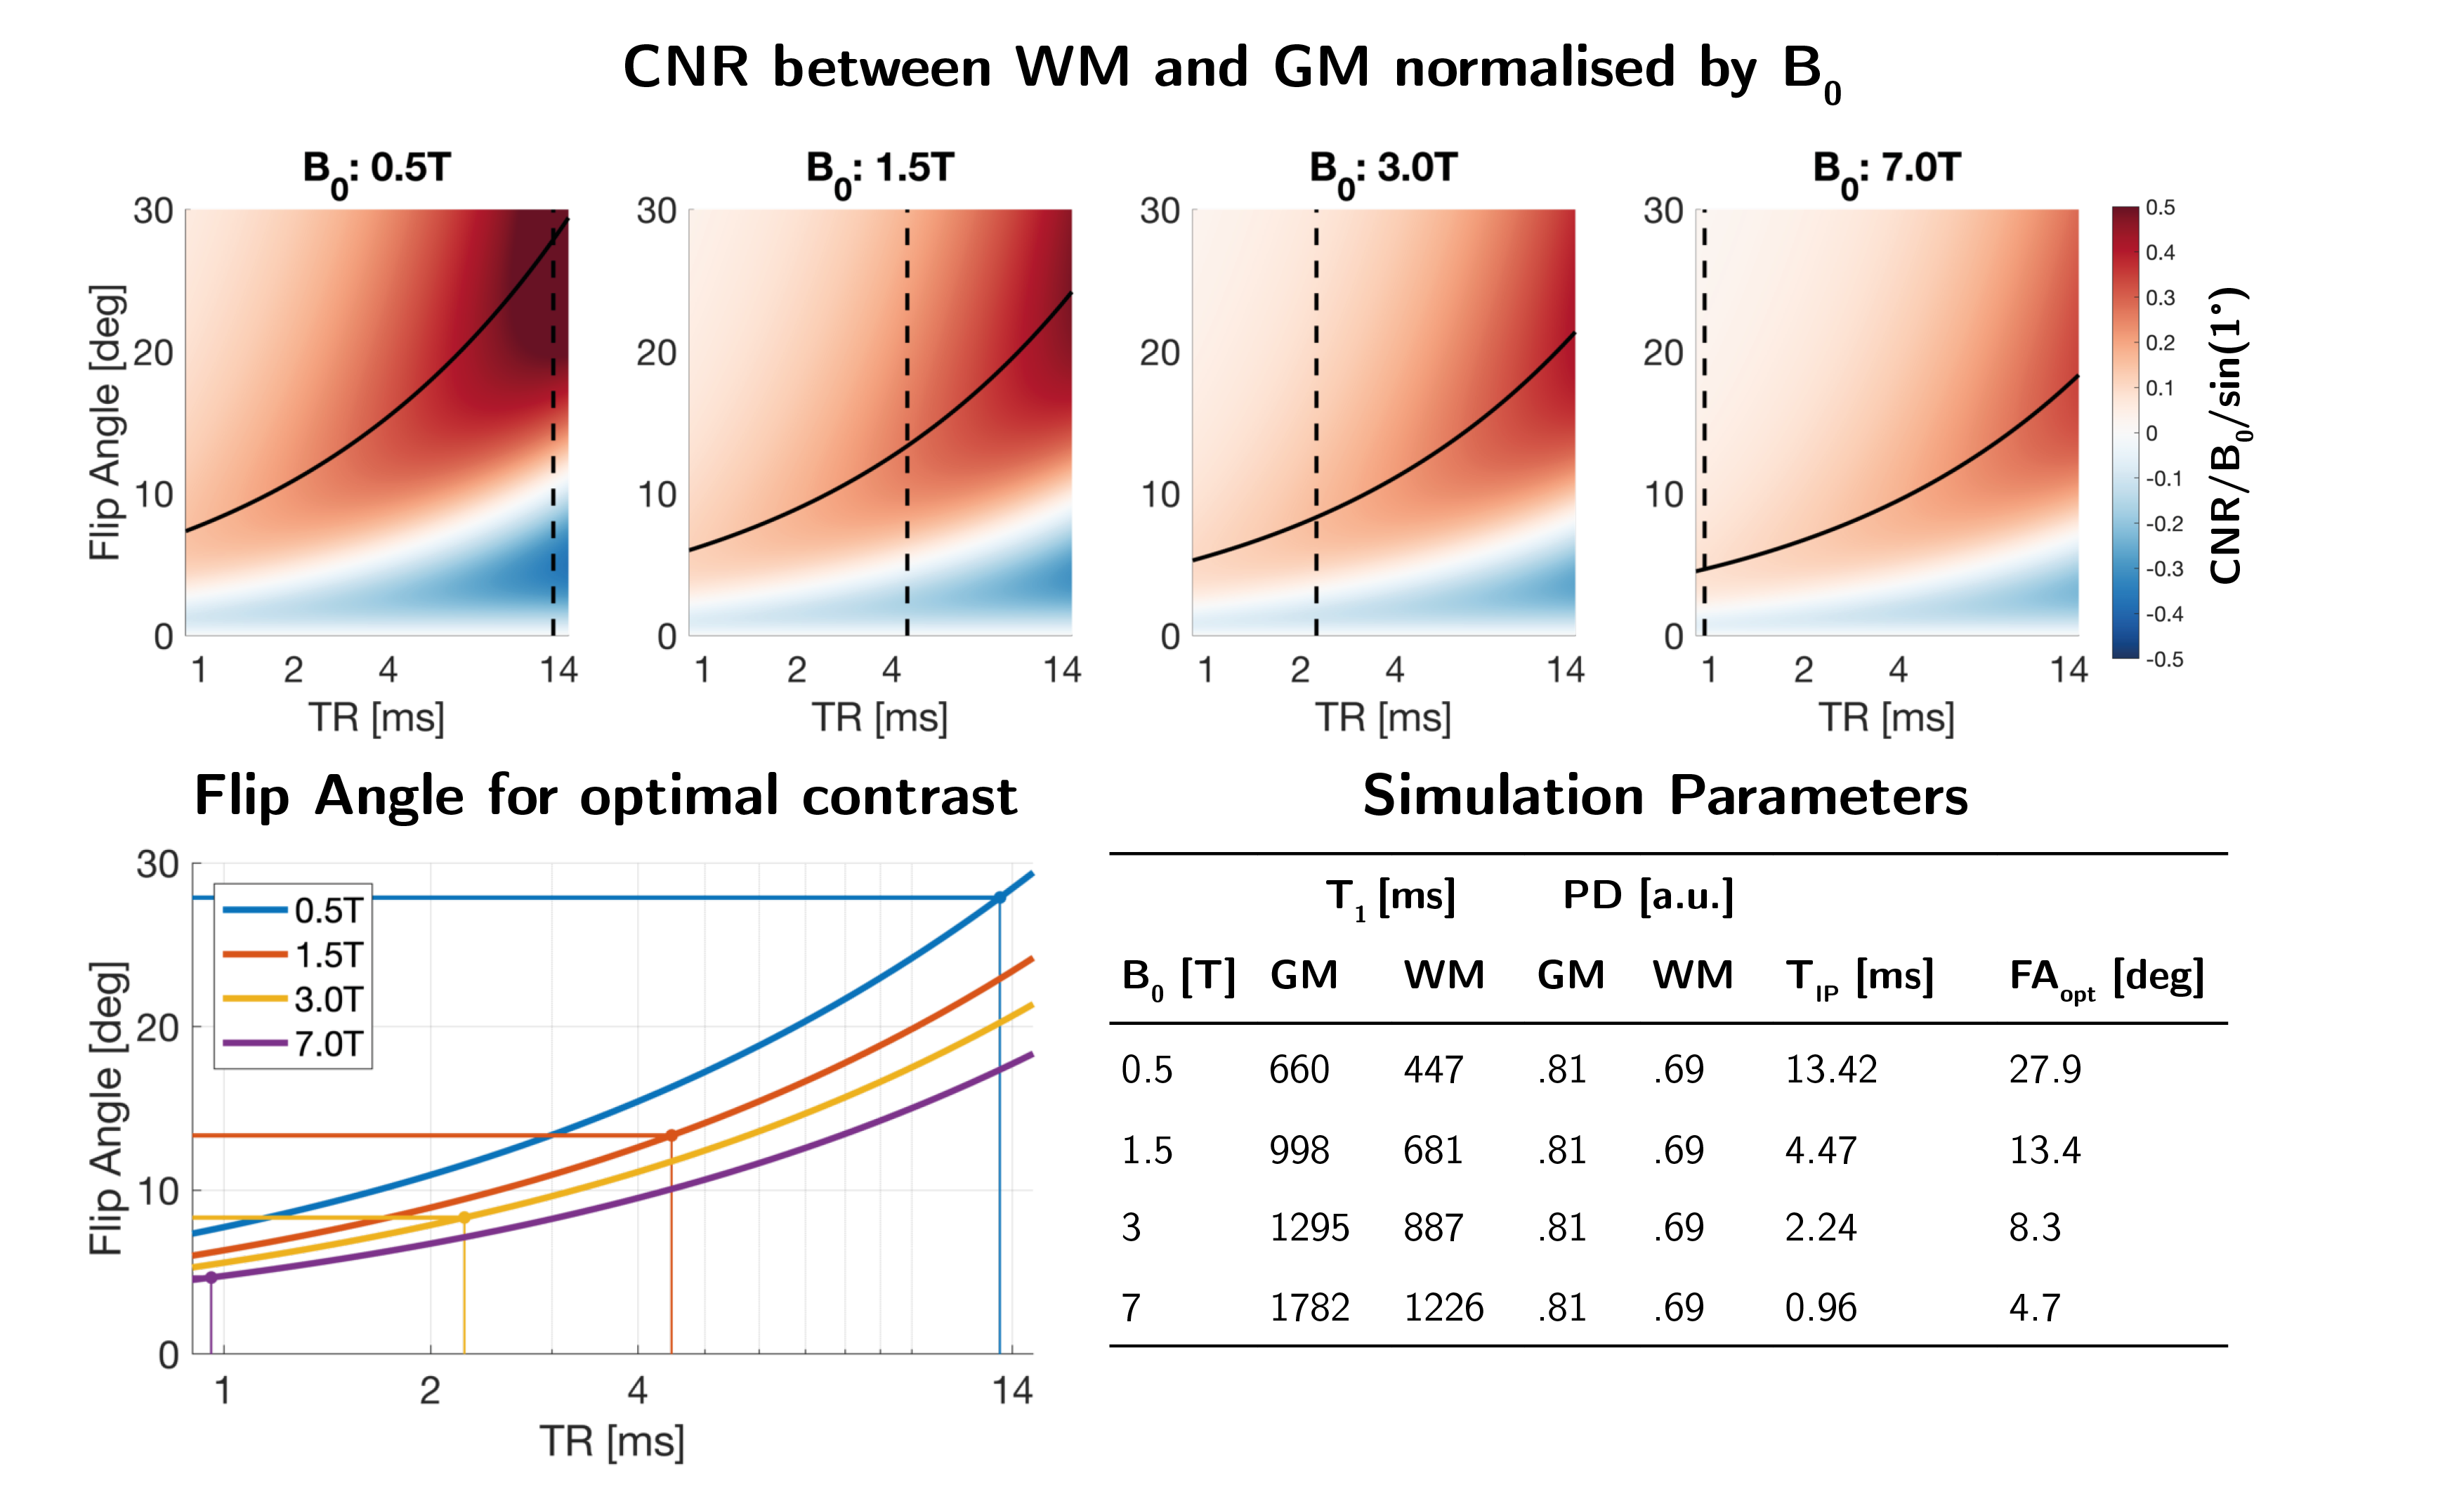
Figure 1: (Top) Contrast
between WM and GM shown as CNR/B0/sin(1°) at four different field strengths. Solid
line indicates maximum contrast at each TR, dashed line indicates fat-water
in-phase time (Tip). (Lower left) The flip
angles required to achieve the maximum positive contrast for each
field strength. (Lower right) Simulation parameters, including field dependent
T1, fat-water in-phase time (Tip) and the calculated flip angles
for optimal contrast.
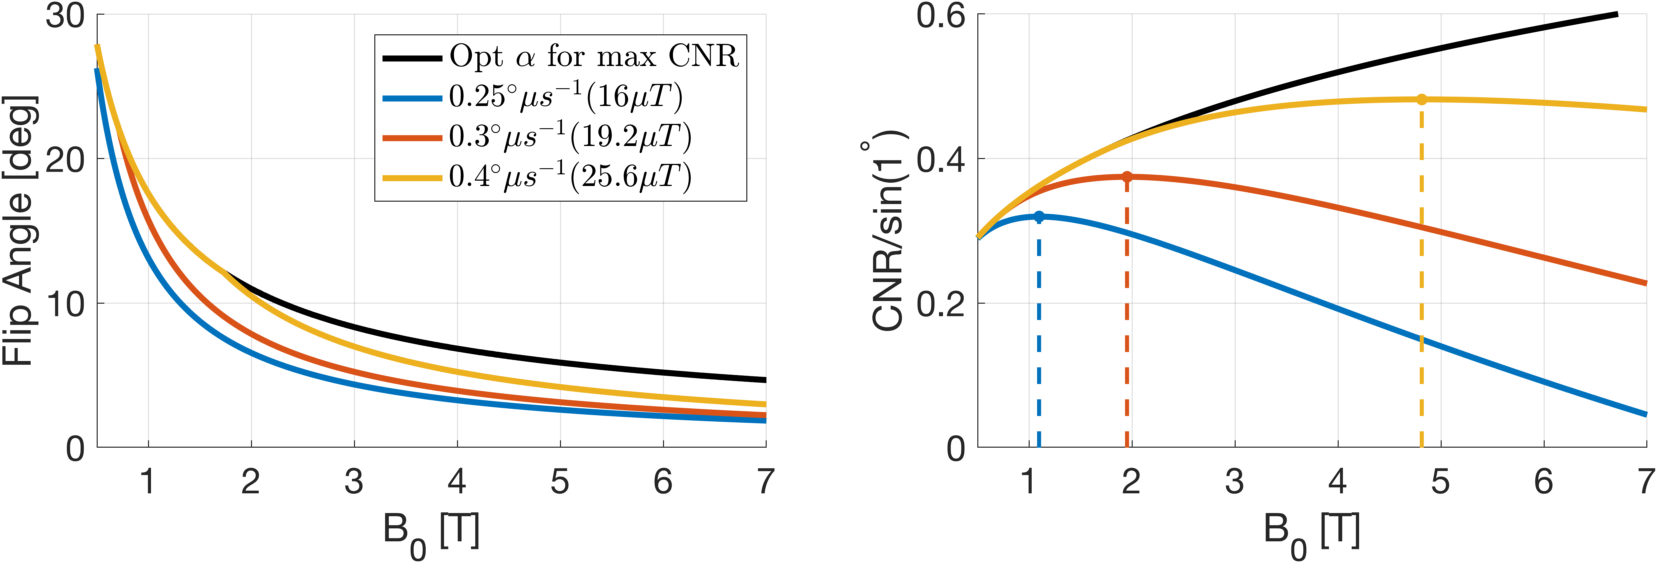
Figure
2: (Left) Simulation
of the achievable flip angle for maximum contrast between WM and GM at three different peak B1 amplitudes.
At low field, the flip angle for maximum contrast (black line) is achievable while at higher field the flip
angle is limited by the bandwidth. This results in reduced CNR between WM and GM (Right)
at higher fields depending on the peak B1 amplitude. Maximum CNR for each peak
B1 amplitude is indicated with dashed vertical lines.
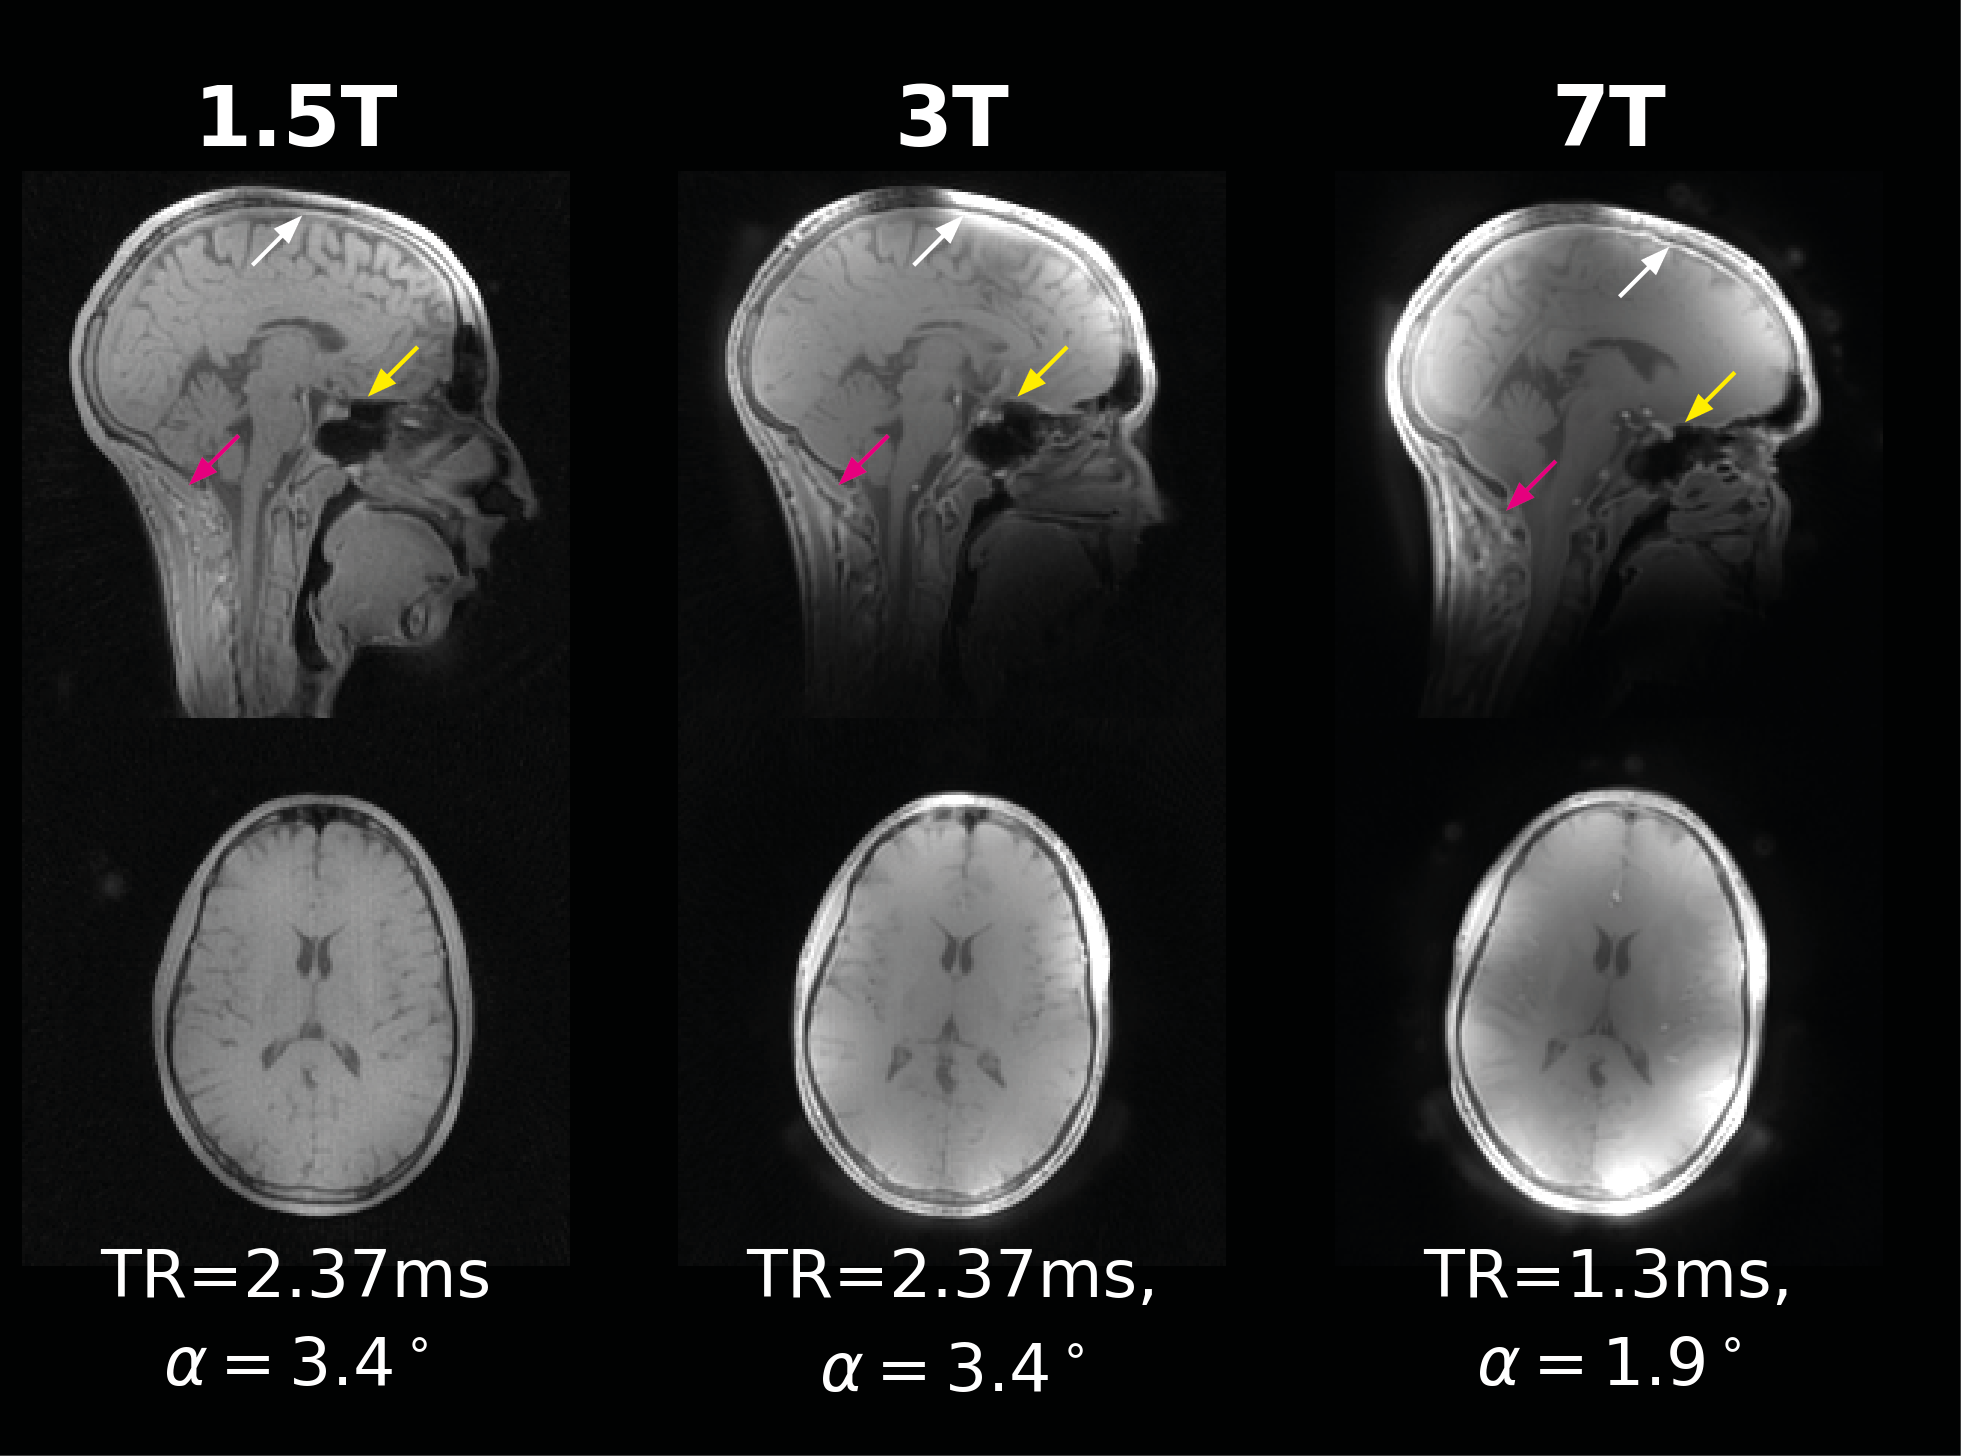
Figure 3: Example of ZTE data
acquired at 1.5T, 3T, and 7T, showing excellent image quality at each field
strength, with the expected higher SNR at higher field strength. At 3T and 7T, increased B1-inhomogeneity can be observed as well as
stronger off-resonance effects compared to 1.5T (indicated with arrows).
Off-resonance artefacts are comparable between 3T and 7T as expected with
TR≈TIP.
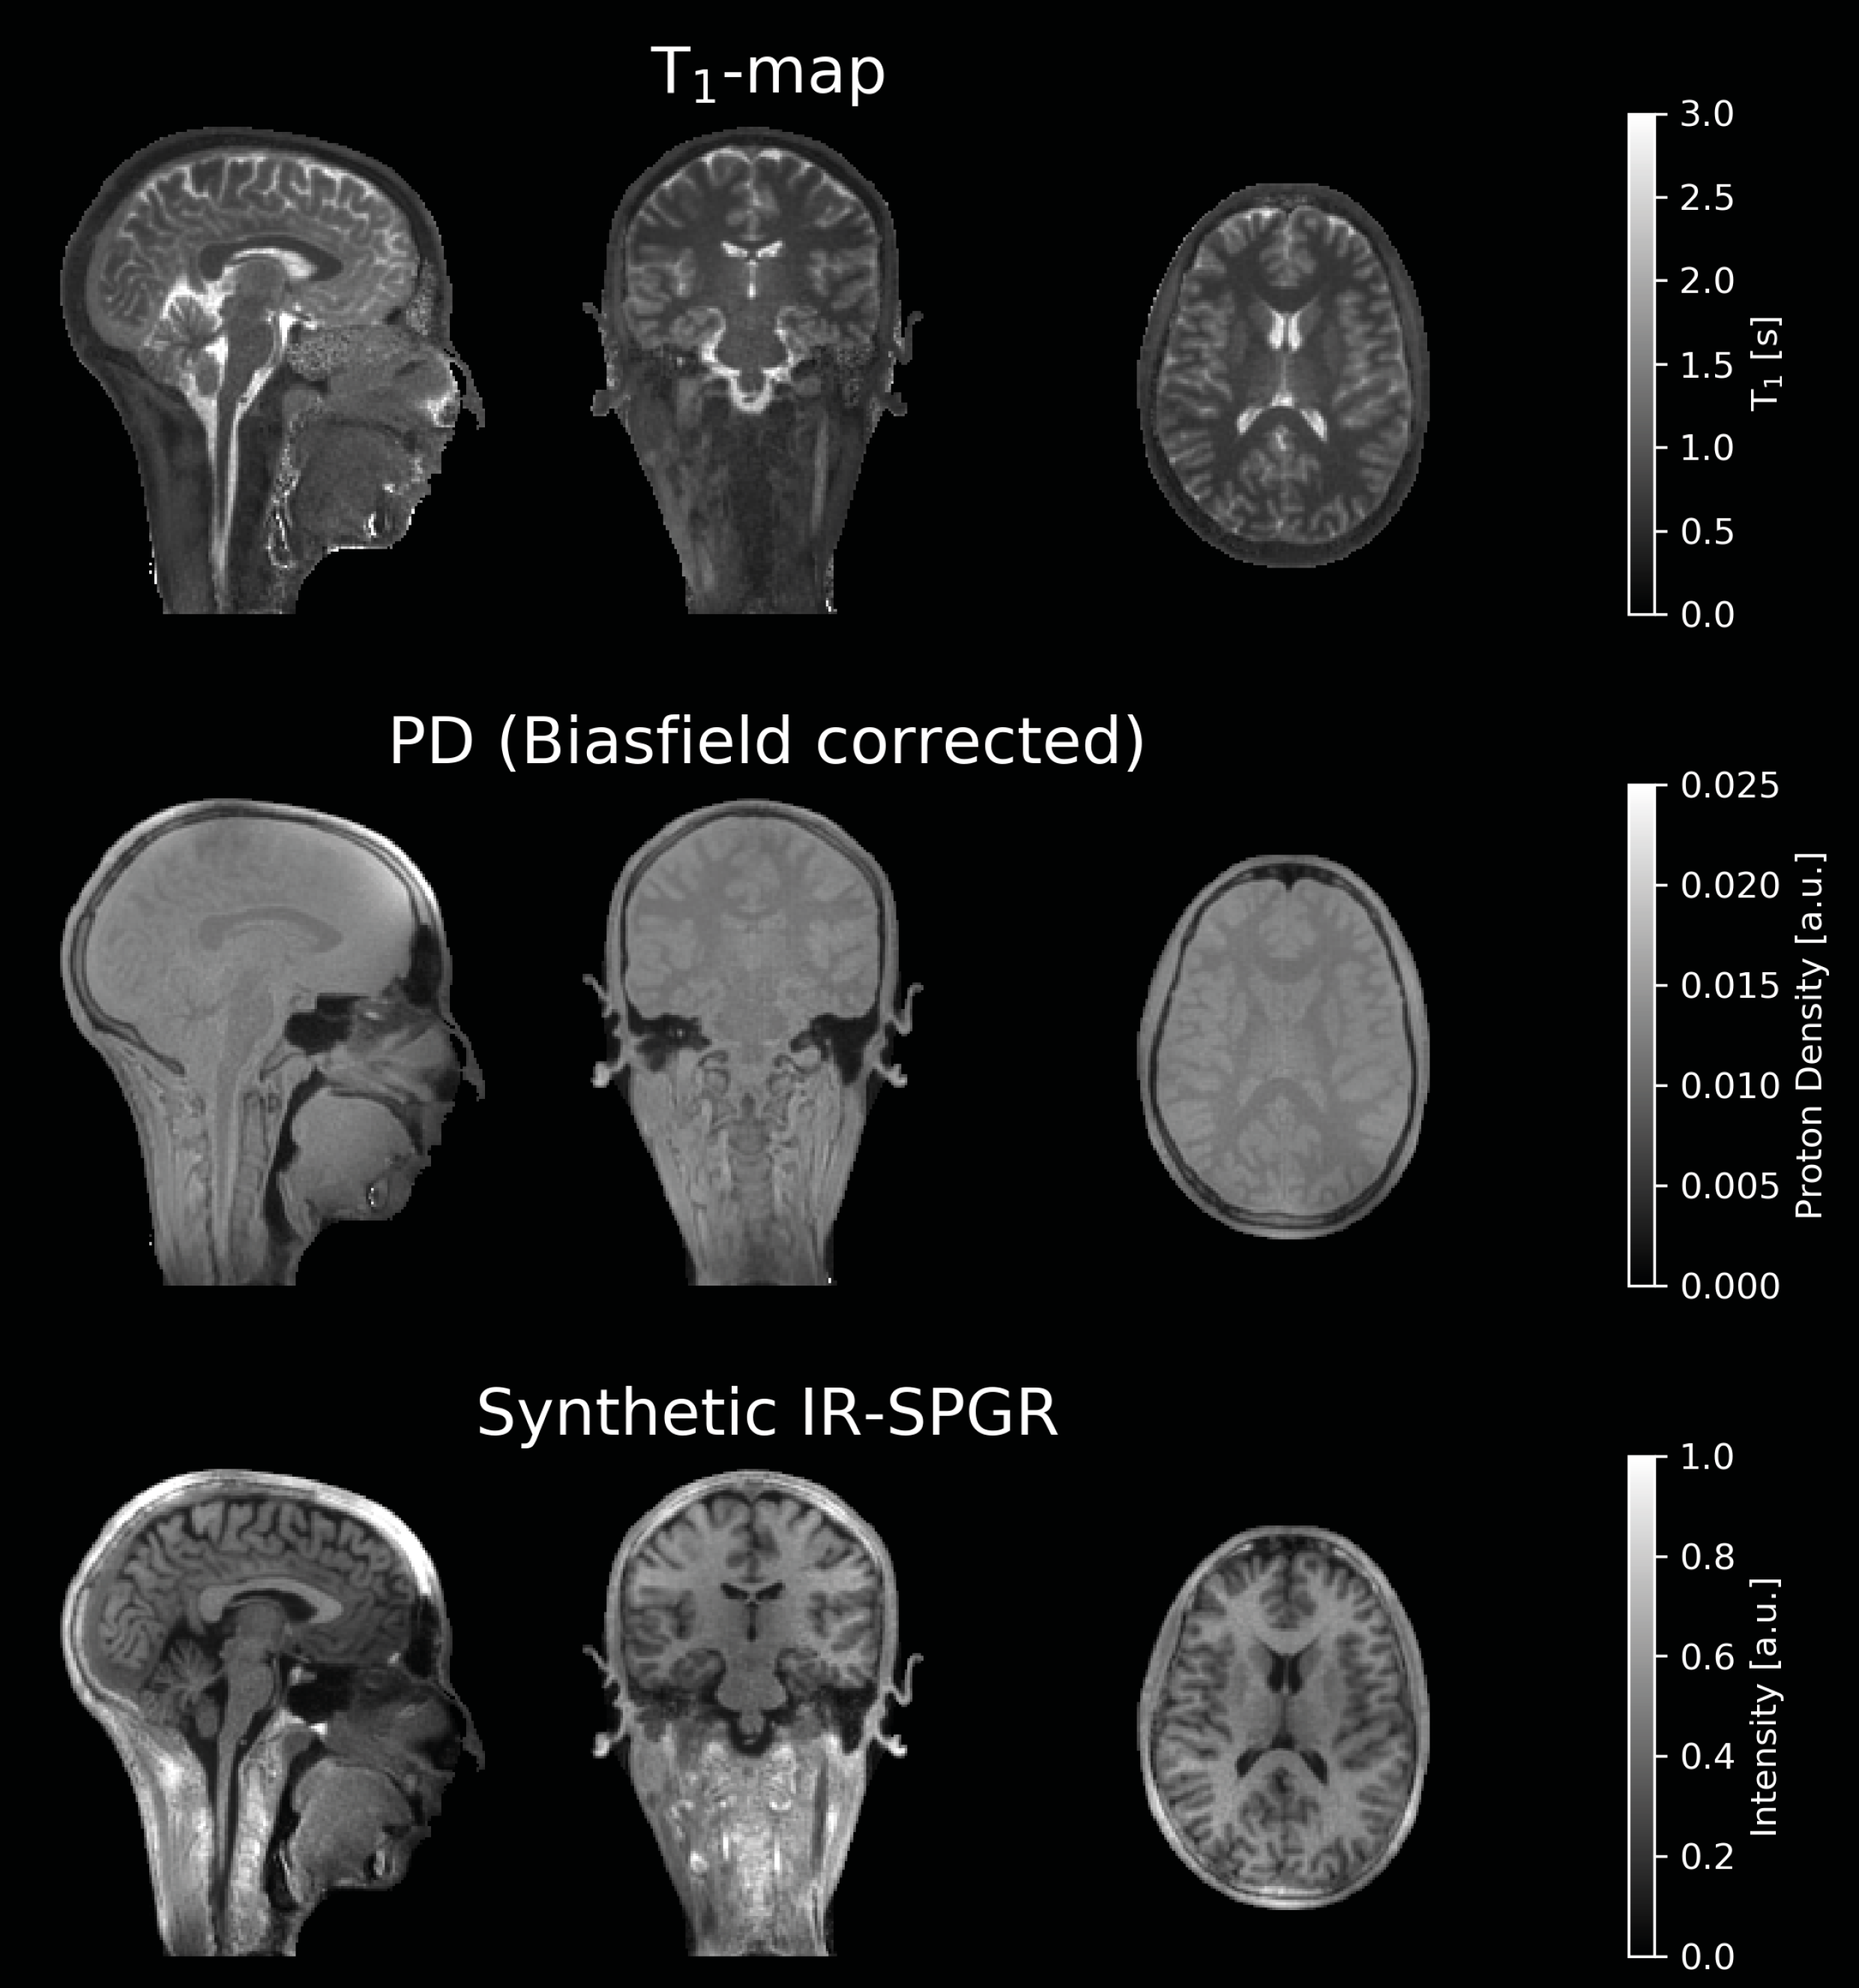
Figure 4: Quantitative T1-map
and semi-quantitative PD-map acquired using VFA ZTE at 1.5T. Using the T1 and
PD map, an inversion-recovery prepared spoiled gradient echo image (IR-SPGR/MPRAGE)
image was synthesised showing excellent WM/GM contrast.