0520
Quantitative Susceptibility Mapping from 3D Magnetic Resonance Fingerprinting with Quadratic RF Phase Data1Radiology, Case Western Reserve University, Cleveland, OH, United States
Synopsis
Magnetic Resonance Fingerprinting with Quadratic RF Phase (MRFqRF) can simultaneously map T1, T2, T2* and off-resonance. It has been shown that local field inhomogeneities due to susceptibility is encoded in MRFqRF off-resonance maps. Here publicly available standard QSM processing tools were used to analyze two high resolution 3D MRFqRF datasets from 3T. Susceptibility contrast is revealed after phase unwrapping, background removal and B1 correction. QSM preprocessed data was further analyzed with two dipole kernel inversion algorithms. Susceptibility encoding in MRF framework is novel and brings immediate additional value to MRI exam.
Introduction
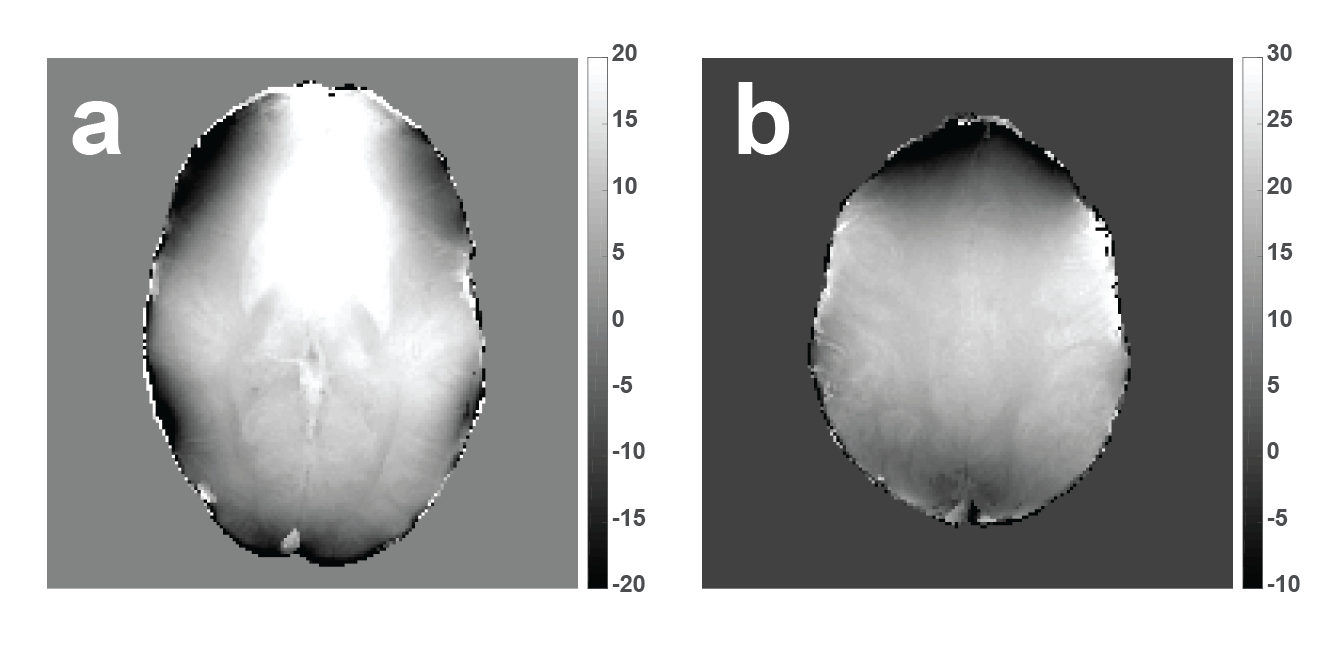
Multiple quantitative tissue property maps can be obtained with Magnetic Resonance Fingerprinting1 (MRF). Recently MRF framework was extended to also map off-resonance and T2* in 2D2 and the first implementation for 3D was proposed3. The MRF sequence is made sensitive to different off-resonance frequencies by linearly sweeping the on-resonance band with a quadratic RF phase function (MRFqRF). For T2* mapping, first the frequency dispersion (T2’) in a voxel is simulated in the dictionary and then the match is combined with T2. Off-resonance maps have high anatomical contrast with minimal wrapping around the air-tissue interfaces. Because the off-resonance encoding is based largely on the time axis, we have seen that the off-resonance maps are less sensitive to Gaussian noise. Simulations of repeated reconstructions with added noise show ~0.05 Hz sensitivity for off-resonance (Figure 1). Based on the stability and available anatomical contrast of MRFqRF off-resonance maps, it is suggested in this abstract that they can be used for quantitative susceptibility mapping (QSM) with the possibility to overcome some of the error-prone steps of QSM. Two high resolution MRFqRF datasets are processed with online available QSM processing software and results are presented.Methods
Two sets of MRFqRF data were acquired with the flip angle, repetition time and RF phase replicated from 3D MRFqRF3 with two different resolutions and orientations on a 3T system (Siemens Skyra). Informed consent with IRB approval was obtained from both volunteers. Dataset 1 acquired in 11 min: 300x300x144 mm3 FOV, 48 axial slices with 1.2x1.2x3 mm3 interpolated to 96 slices with 0.6x0.6x1.5 mm3. Dataset 2 acquired in 22 min: 300x300x154 mm3 FOV, 96 sagittal slices with 1.2x1.2x1.6 mm3 interpolated to 192 slices with 0.8x0.8x0.8 mm3. Interpolation was done by zero-filling in k-space for individual MRF image series before dictionary matching.MRF images were reconstructed after compression with randomized SVD4. Template matching was done with a dictionary undersampled by 16 in the tissue property dimension. Quadratic interpolation5 recovers the relative low resolution in the tissue property dimension.
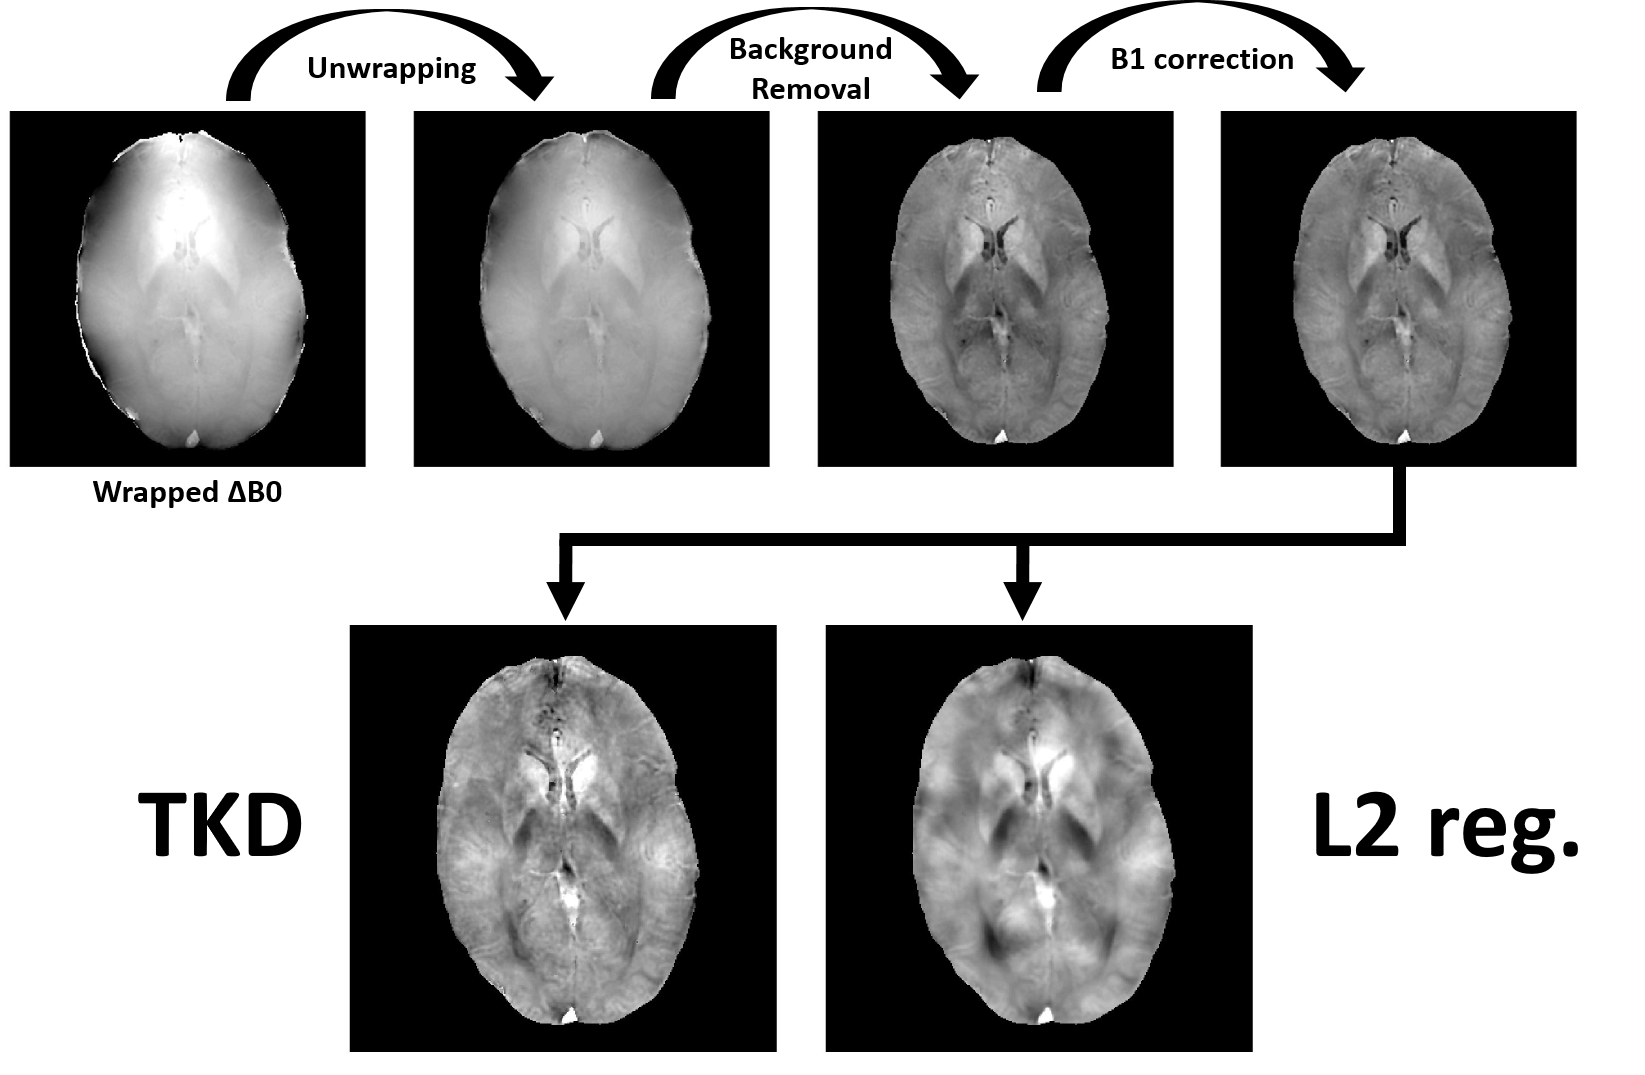
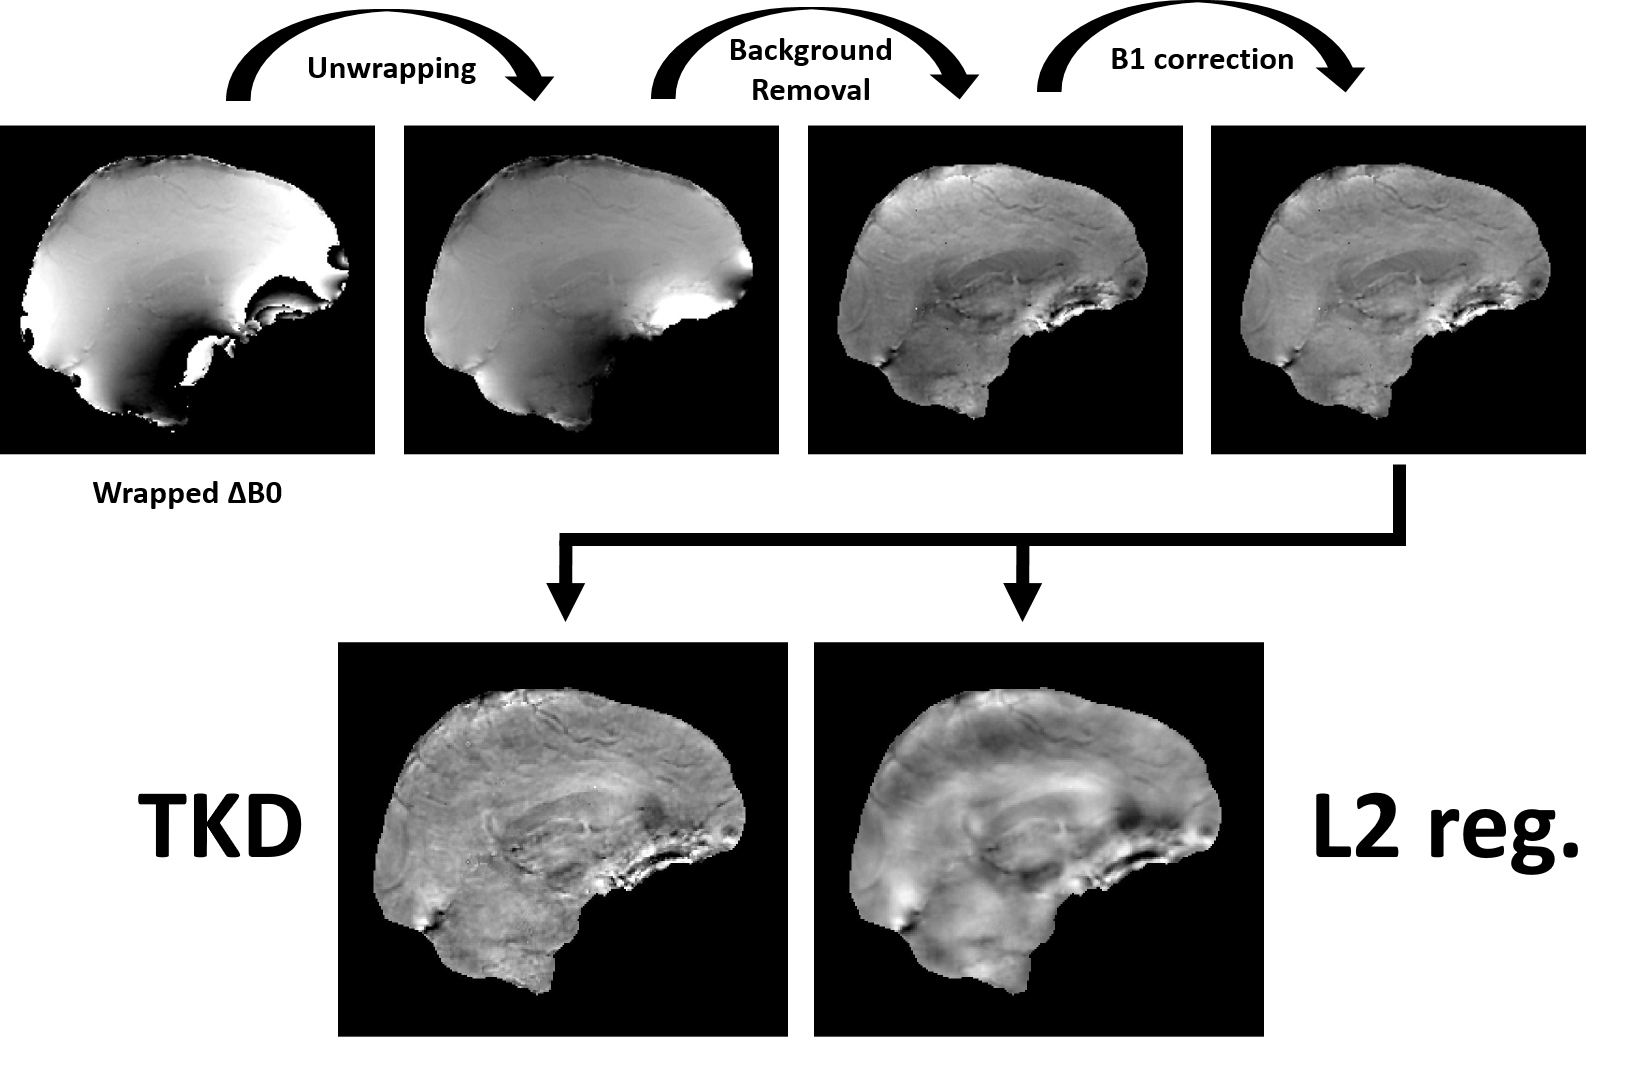
QSM analysis included Laplacian unwrapping with STI Suite6, removal of background phase with Laplacian Background Value7 (LBV), 3D polynomial fit to remove B1 effects, dipole kernel estimation and two QSM inversions: truncated k-space division8 (TKD) and closed-form L2 regularization9. QSM processing was done in Matlab with the tools available from https://martinos.org/~berkin/1645_Bilgic.pdf
Results
Figure 2 and 3 illustrate the outputs from the individual stages of QSM processing pipeline starting from the wrapped off-resonance maps to the final QSM maps from the two kernel inversion algorithms. The output image from the QSM pre-processing (top row of Figure 2 and 3) has significant susceptibility contrast for both datasets. As expected, TKD inversion brings more noise and less smoothing compared to closed-form L2 regularization.Discussion and Conclusions
In this work, it is demonstrated that the local field inhomogeneity due to susceptibility is encoded in the MRFqRF off-resonance maps. After the background removal, the susceptibility contrast is revealed, even though it is not as sharp as typical contrast available from 7T. The through-time encoding of off-resonance and quadratic interpolation after the template matching makes the off-resonance maps stable and precise, which then makes QSM processing possible. Thus, inclusion of this simple QSM processing provides one more contrast for MRFqRF.It should be noted that the relatively low standard deviation is not due to the coarse step size forcing the signal evolutions to be matched on the same dictionary entry for repeated reconstructions. Quadratic interpolation after matching with low resolution dictionary brings the high resolution back and ensures an accurate match.
There are remaining issues to be resolved such as the wraps in the frontal regions due to strong gradients from the air tissue interfaces. These could be mitigated with a short TR implementation of MRFqRF which would widen the on-resonance band. It should be noted that B1 correction partially helps with frontal lobe inhomogeneity especially for the axial acquisition.
This is the first example of simple QSM processing of MRF data at 3T, bringing immediate additional value for MRF acquisition. It is essentially for free and comes alongside with perfectly co-registered T1/T2/T2*/off-resonance maps. With an optimized acquisition it could even be considered as an alternative to standard QSM since one can bypass the error-prone unwrapping step from the analysis pipeline.
Acknowledgements
This work is supported by Siemens Healthcare.References
1. Ma D, Gulani V, Seiberlich N, et al. Magnetic resonance fingerprinting. Nature 2013;495: 187–192.
2. Wang C, Coppo S, Mehta B, et al. Magnetic resonance fingerprinting with quadratic RF phase for measurement of T2* simultaneously with δf ,T1, and T2. Magn Reson Med 2019 81(3):1849-1862.
3. Boyacioglu R, Wang C, Ma D et al. 3D Magnetic Resonance Fingerprinting with Quadratic RF Phase. ISMRM proceedings 2019, p806.
4. Yang M, Ma D, Jiang Y, et al. Low rank approximation methods for MR fingerprinting with large scale dictionaries. Magn Reson Med 2018 79(4):2392-2400.
5. McGivney D, Boyacioglu R, Jiang Y, et al. Towards Continuous Tissue Property Resolution in MR Fingerprinting using a Quadratic Inner Product Model. ISMRM proceedings 2019, p4526.
6. Li W, Wu B, Liu C. Quantitative susceptibility mapping of human brain reflects spatial variation in tissue composition. Neuroimage. 2011;55:1645–1656.
7. Zhou D, Liu T, Spincemaille P, et al. Background field removal by solving the Laplacian boundary value problem. NMR in Biomed, 2014 27(3):312-319.
8. Wharton S, Schäfer A, Bowtell R. Susceptibility mapping in the human brain using threshold-based k-space division. Magn Reson Med. 2010 May;63(5):1292-304.
9. Bilgic B, Chatnuntawech I, Fan AP, et al. Fast image reconstruction with L2-regularization. J Magn Reson Imaging. 2014 Jul;40(1):181-91.
Figures