0516
Fat suppression using a rosette trajectory for low field magnetic resonance imaging1Case Western Reserve University, Cleveland, OH, United States, 2University of Michigan, Ann Arbor, MI, United States, 3National Heart, Lung, and Blood Institute, National Institutes of Health, Bethesda, MD, United States
Synopsis
Fat/water separation at low field strengths can be difficult due to the small difference between resonance frequencies. Rosette trajectories have previously been shown to be effective for spectral separation and fat suppression, and the approach is not dependent on a large frequency difference. Here, a rosette trajectory is used to significantly suppress fat signal in water images, and to produce separate fat images at 0.55T. B0 maps are calculated from two of the rosette echoes, and are used to improve the fat/water separation. Initial examples are shown in an oil/water phantom, and in the heart and abdomen.
Introduction
Fat suppression at low field strengths can be challenging due to the small separation in resonance frequencies between fat and water protons. At 0.55T, the fat proton resonance frequency is downshifted by approximately 80Hz. This small separation requires precise, narrow-band frequency selection for species-selective excitation techniques such as fat saturation pulses, and can be unreliable.Rosette trajectories have previously been shown to be effective for spectral separation and fat suppression1,2. During the acquisition, the phase of the off-resonance (fat) species evolves relative to the on-resonance species (water). By carefully timing the multiple echoes in each readout, the center of k-space can be collected such that the fat signal destructively interferes with itself, significantly reducing the signal from fat in the resulting on-resonance images. Post-acquisition demodulation of the data to the fat frequency makes it possible to produce a fat image as well as a water image. B0 maps can be calculated by pairing two of the acquisition echoes and further used to correct the fat/water images.
A rosette-based fat suppression approach is attractive for low-field imaging because it does not require a large frequency difference between water and fat species. It also takes advantage of the ability to use long readout times, benefiting from the long T2* and the reduced field inhomogeneity at lower field3. In this work, a rosette trajectory is used for fat/water separation at 0.55T in an oil/water phantom and for in vivo abdominal and cardiac imaging.
Methods
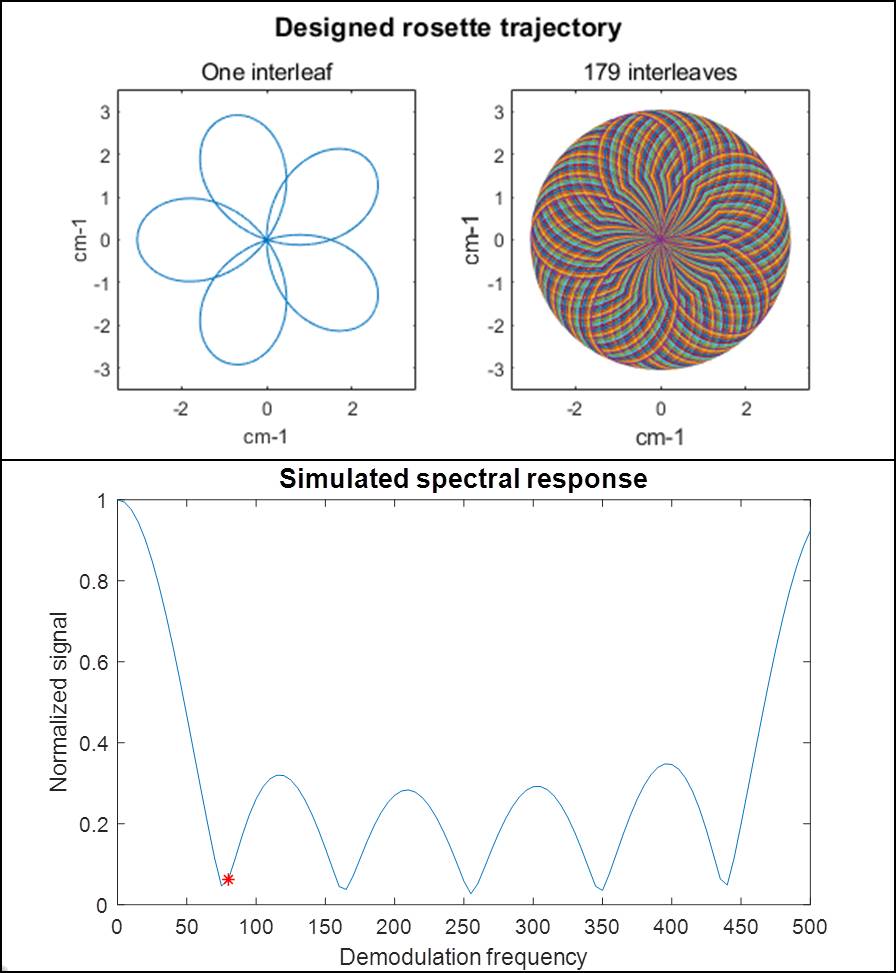
A five-lobe rosette trajectory was designed to suppress signals at an off-resonance frequency of 80Hz. The trajectory is comprised of 179 interleaves with a linear rotation angle ordering, assuming the following parameters: maximum gradient strength = 10mT/m, maximum slew rate = 45 T/m/s, dwell time = 2.5μs, FOV = 300x300 mm2, in-plane resolution = 1.56x1.56 mm2. The trajectory was used in a balanced steady-state free precession (bSSFP) sequence with the following scan parameters: flip angle = 70°, TR/TE = 12.26/1.04 ms, slice thickness = 8 mm. All scanning was performed on an MRI system modified to operate at 0.55T (prototype MAGNETOM Aera, Siemens, Erlangen, Germany).Data were acquired in an oil/water phantom, and in the heart (short axis view) and abdomen (one axial slice) in an IRB-approved study. Images were collected during free-breathing and without ECG-gating. Data were gridded4 to form the water image, and demodulated to -80Hz and gridded to form the fat image. A B0 correction was performed by calculating the phase difference between two of the rosette lobe echoes, and was further used to define the appropriate demodulation frequency for improved separation of the two species.
A Cartesian gradient echo Dixon-type acquisition was also acquired for comparison, with the following parameters: FOV = 360x270 mm2, matrix size = 256x144 (interpolated to 1.41x1.41 mm2 in-plane resolution), bandwidth = 592 Hz/pixel, flip angle = 20°, 15 segments, 11 heartbeats while breath-holding.
Results
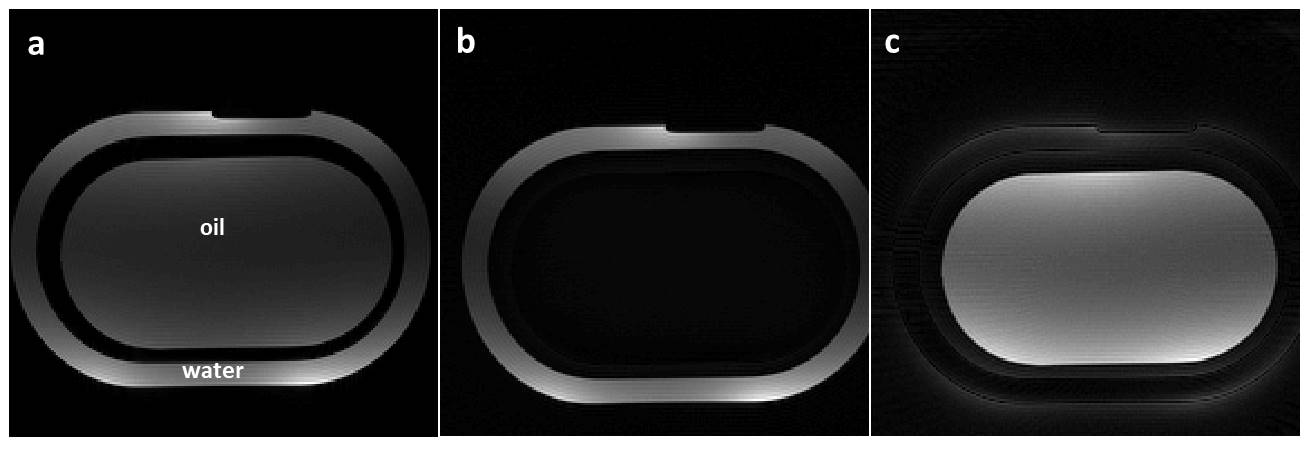
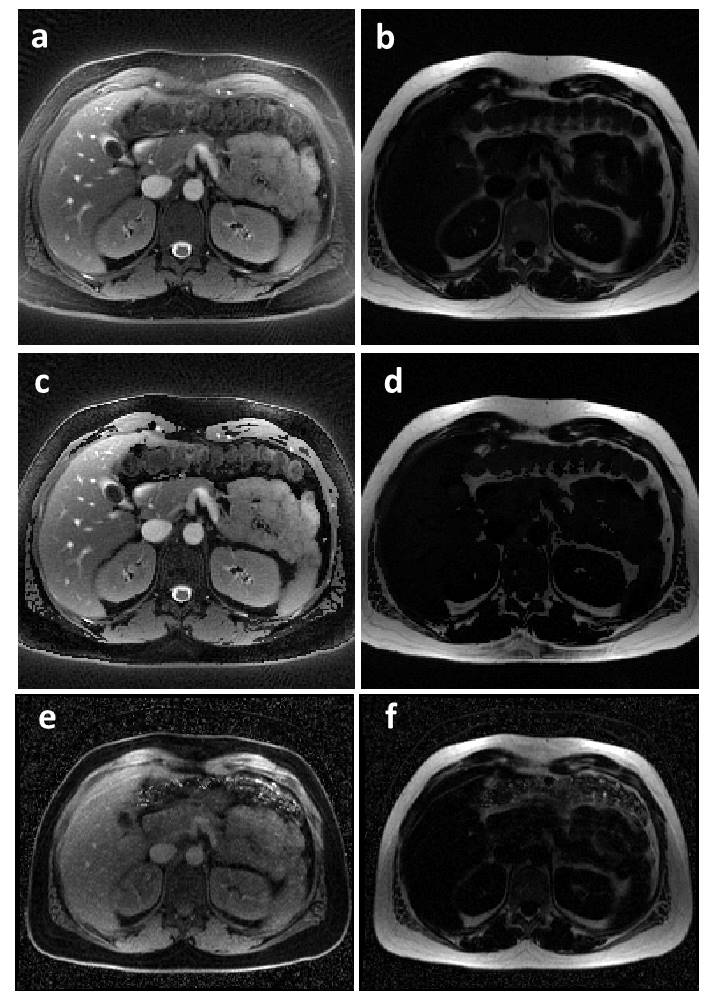
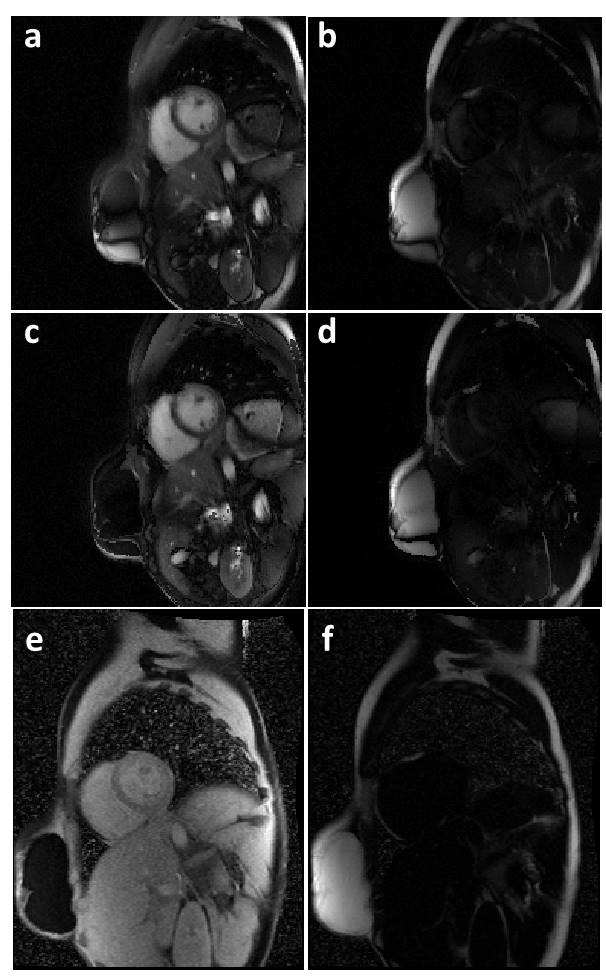
The optimized rosette trajectory for fat/water separation at 0.55T resulted in a simulated suppression of signal at 80Hz to 6.2% of its original intensity (Figure 1). Imaging in an oil/water phantom showed significant reduction in the fat signal using the proposed trajectory (Figure 2) and good separation of the two species. Imaging in the abdomen (Figure 3) showed good fat/water separation in the central portion of the abdomen, although there was some residual fat signal around the periphery. Similarly, the rosette performed well in suppressing fat signal immediately around the heart (Figure 4). B0 correction using the field map from the rosette trajectory further improved fat suppression in the water images in both the abdomen and the heart (Figures 3 and 4, see a,b vs. c,d). However, there was still some residual signal in the breast, along the back, and along the chest wall, as can be clearly seen by comparing the water and fat images from the rosette trajectory to those collected using a Dixon-type acquisition (Figures 3 and 4, c,d vs. e,f).Discussion
A rosette trajectory was used to effectively acquire fat-suppressed images at 0.55T in an oil/water phantom and in vivo. By demodulating the data by the fat off-resonance frequency, separate fat images could also be produced without acquiring additional data. A B0 correction can be performed to help compensate for static field inhomogeneities. While this initial rosette trajectory did reduce fat signal significantly, residual peripheral fat signal remained in the water images. This may be due in part to imperfect or local shimming, and phase wrapping in the calculated B0 maps. Note that while the trajectory was calculated for fat suppression at 0.55T, it is not yet optimized for B0 mapping. Additionally, one assumption of the model used here is that each pixel contains only fat or water, resulting in masking-like edges in the corrected images. Improved B0 mapping and a model that allows for mixed voxels may provide improved corrections.Conclusion
A rosette trajectory can be used for effective fat suppression for imaging at 0.55T. Separate water and fat images can be produced without acquiring additional data. Initial images are shown in an oil/water phantom, and in vivo for abdominal and cardiac imaging.Acknowledgements
We would like to acknowledge the assistance of Siemens Healthcare in the modification of the MRI system for operation at 0.55T under an existing cooperative research agreement (CRADA) between NHBLI and Siemens Healthcare.References
1. Noll DC. Multishot rosette trajectories for spectrally selective mr imaging. IEEE Trans. Med. Imaging 1997;16:372–377 doi: 10.1109/42.611345.
2. Liu Y, Hamilton J, Griswold M, Seiberlich N. Fat/Water Separation and T1 and T2 Quantification Using MRF with a Rosette Trajectory in the Heart and Liver. In: Proc. Intl. Soc. Mag. Reson. Med. 27. Montreal; 2019. p. 4376.
3. Campbell-Washburn AE, Ramasawmy R, Restivo MC, et al. Opportunities in Interventional and Diagnostic Imaging by Using High-Performance Low-Field-Strength MRI. Radiology 2019;293:384–393.
4. Fessler JA. Michigan image reconstruction toolbox (MIRT). https://web.eecs.umich.edu/~fessler/code/.
Figures