0513
Fat fraction mapping using bSSFP Signal Profile Asymmetries for Robust multi-Compartment Quantification (SPARCQ)
Giulia MC Rossi1,2, Tom Hilbert1,2,3, Adèle LC Mackowiak1,2, Katarzyna Pierzchała4,5, Tobias Kober1,2,3, and Jessica AM Bastiaansen1
1Department of Diagnostic and Interventional Radiology, Lausanne University Hospital and University of Lausanne, Lausanne, Switzerland, 2Advanced Clinical Imaging Technology, Siemens Healthcare AG, Lausanne, Switzerland, 3LTS5, Ecole Polytechnique Fédérale de Lausanne (EPFL), Lausanne, Switzerland, 4Laboratory for Functional and Metabolic Imaging, Ecole Polytechnique Fédérale de Lausanne (EPFL), Lausanne, Switzerland, 5Center for Biomedical Imaging (CIBM), Ecole Polytechnique Fédérale de Lausanne (EPFL), Lausanne, Switzerland
1Department of Diagnostic and Interventional Radiology, Lausanne University Hospital and University of Lausanne, Lausanne, Switzerland, 2Advanced Clinical Imaging Technology, Siemens Healthcare AG, Lausanne, Switzerland, 3LTS5, Ecole Polytechnique Fédérale de Lausanne (EPFL), Lausanne, Switzerland, 4Laboratory for Functional and Metabolic Imaging, Ecole Polytechnique Fédérale de Lausanne (EPFL), Lausanne, Switzerland, 5Center for Biomedical Imaging (CIBM), Ecole Polytechnique Fédérale de Lausanne (EPFL), Lausanne, Switzerland
Synopsis
A novel quantitative framework for detection of different tissue compartments based on bSSFP signal profile asymmetries (SPARCQ) is reported. SPARCQ uses a dictionary-based weight optimization algorithm to estimate voxel-wise off-resonance frequency and relaxation time ratio spectra from acquired bSSFP signal profiles. From the obtained spectra, quantitative parameters (i.e. fractions of the components of interest, thermal equilibrium magnetization) can be extracted. Validation and proof-of-concept are provided for voxel-wise water-fat separation and fat fraction mapping. Accuracy and repeatability of SPARCQ are demonstrated with phantom and in vivo experiments.
Introduction
Balanced steady-state free-precession (bSSFP) signal profiles (i.e. steady-state transverse magnetization over a range of RF pulse phases) were shown to have different shapes depending on the underlying tissue composition1. Furthermore, it was reported that asymmetries in these signal profiles indicate the presence of multiple tissue components (e.g. different types of tissue) in single voxels2,3. The aim of this work was to develop a novel quantitative method that exploits bSSFP signal profile asymmetries for robust multi-compartment quantification (SPARCQ) and to provide a validation for voxel-wise water-fat separation and fat fraction mapping.Methods
The prototype SPARCQ acquisition consists of multiple phase-cycled bSSFP acquisitions (N=37), with constant RF pulse phase increments equidistantly distributed according to:$$\phi_j=\frac{2\pi}{N-1}(j-1),\;\;\;\;\;\;j=1,2,...,N\;\;\;\;\;\;\;\;\bf{(Eq. 1)}$$
For each phase cycle, k-space is acquired using a fully sampled Cartesian trajectory, with TR/TE = 3.4/1.7 ms, RF excitation angle α = 35°, an isotropic resolution of (2mm)3 and receiver bandwidth of 930 Hz/px. Magnitude and phase images are reconstructed directly on the scanner.
SPARCQ reconstruction framework. First, a complex-valued 2D dictionary of bSSFP signal profiles is constructed using Bloch simulations. The two dimensions are composed of the relaxation time ratio Λ (T1/T2) and the off-resonance frequency df (Fig. 1a). Second, an optimization algorithm is used to express each acquired signal profile (sacq) as a weighted sum of the simulated signals in the dictionary (D) as follows: $$\hat{\bf{w}}=argmin_{\bf{w}}\parallel\bf{D}\cdot\bf{w}-\bf{s}_{acq}\parallel_{2}^{2}+\lambda\parallel\triangle w\parallel_{2}^{2},\:\:\it{subject}\:to\:\bf{w}\geq0\:\:\: \:(Eq. 2)$$ yielding a weight matrix (2D representation of $$$\hat{\bf{w}}$$$), containing information on the voxel content (Fig.1b). Distributions of Λ and df are obtained by projecting the weight matrix along its dimensions (Fig. 1c-d). Third, parameters (i.e. fractions of the components of interest and thermal equilibrium magnetization M0) are voxel-wise extracted from the obtained spectra (i.e. distributions of weights) (Fig. 1e). Finally, M0-weighted separated images for each component are obtained by multiplying the corresponding fraction map with the M0 map.
Phantom experiments at 3T and 9.4T. A dedicated fat-water phantom was created4 composed of six 50 mL Falcon tubes with different nominal fat fractions immersed in a 3%wt agar solution (Fig. 2A). First, the exact content of each vial was determined by integrating the peak areas in high-resolution 1H NMR spectra obtained by unlocalized spectroscopy in a horizontal-bore 9.4T magnet (Magnex Scientific, Oxford, UK) with a Direct Drive spectrometer (Agilent, Palo Alto, CA, USA). A custom-made RF hybrid probe (two 10mm diameter proton surface coils in quadrature mode) was positioned over the phantom for transmission and reception. Additionally, whole-phantom acquisitions were performed on a clinical 3T scanner (MAGNETOM Prismafit, Siemens Healthcare, Erlangen, Germany) using a commercially available body coil and the suggested prototype sequence. Fat fractions estimated with SPARCQ - in manually drawn circular ROIs corresponding to the six vials - at 3T were compared with gold-standard fat fractions determined via unlocalized spectroscopy at 9.4T.
Volunteer experiments were performed on the knees of six healthy volunteers on the same clinical 3T scanner using a commercially available 15-channel Tx/Rx knee coil (Quality Electrodynamics, Mayfield, OH, USA). The acquisition protocol consisted of a scan-rescan acquisition with repositioning with the suggested prototype sequence. Additionally, a Dixon acquisition was performed with a standard turbo spin echo (TSE) Dixon sequence. Parametric maps and water-fat-separated images were obtained with SPARCQ and compared with water-fat-separated images obtained with Dixon. A Bland-Altman analysis was performed on the mean fat fractions obtained with SPARCQ in five elliptical ROIs in five different tissues.
Results
In phantoms, distributions of the estimation error, i.e. difference between the voxel-wise fat fractions estimated with SPARCQ and the measured fat fractions at 9.4T in the corresponding vial are shown in Fig. 2B. For all the vials, a median error of less than 5% was obtained, with a median error <1% for vials with 0%,40% and 60% fat.In volunteers, df spectra obtained from the weight matrix (Fig. 3) showed the expected frequency components. Parametric maps (Fig. 4A) and water-fat-separated images (Fig. 4B) showed the expected contrast between fatty and non-fatty tissues. Despite the difference in contrast in water-fat-separated images obtained with SPARCQ (M0-weighting) and with Dixon (T2*-weighting) (Fig. 4B), SPARCQ fat and Dixon fat images were in good agreement. In water images, hyperintensities were observed in the same liquid structures. The Bland-Altmann analysis on the fat fraction maps in the scan-rescan experiment (Fig. 5) revealed very low bias b = 0.0002 and a good coefficient of repeatability CR = 0.0695.
Discussion
The SPARCQ framework provided accurate and repeatable quantification of water and fat. This may facilitate fat suppression in bSSFP acquisitions and provide useful information for various clinical applications (e.g. assessment of liver steatosis5 and prognosis of heart failure6,7). The method relies on the extraction of voxel-wise Λ and df spectra from bSSFP signal profiles, suggesting the potential of SPARCQ for other multi-compartment applications. An optimization of the acquisition protocol (~33s/phase cycle) towards scan time should be considered (e.g. phase cycles reduction, compressed sensing with regularization along phase cycles8,9) as well as strategies to increase the robustness of the algorithm (e.g. joint sparsity constraint10).Conclusion
The SPARCQ framework was proposed as a novel quantitative method for detection of different tissue compartments, and its potential was demonstrated for water-fat separation.Acknowledgements
This study was supported by funding from the Swiss National Science Foundation (grant number PZ00P3_167871), the Emma Muschamp foundation, and the Swiss Heart foundation.References
- Hargreaves, B. Fast Gradient Echo Sequences Including Balanced SSFP. 7.
- Miller, K. L. Asymmetries of the balanced SSFP profile. Part I: Theory and observation. Magn. Reson. Med. 63, 385–395 (2010).
- Miller, K. L., Smith, S. M. & Jezzard, P. Asymmetries of the balanced SSFP profile. Part II: White matter. Magn. Reson. Med. 63, 396–406 (2010).
- Bush, E. C. et al. Fat-Water Phantoms for Magnetic Resonance Imaging Validation: A Flexible and Scalable Protocol. J. Vis. Exp. 57704 (2018) doi:10.3791/57704.
- Reeder, S. B., Cruite, I., Hamilton, G. & Sirlin, C. B. Quantitative assessment of liver fat with magnetic resonance imaging and spectroscopy. J. Magn. Reson. Imaging 34, 729–749 (2011).
- Kellman, P., Hernando, D. & Arai, A. E. Myocardial Fat Imaging. Curr. Cardiovasc. Imaging Rep. 3, 83–91 (2010).
- Wu, C.-K. et al. Evolutional change in epicardial fat and its correlation with myocardial diffuse fibrosis in heart failure patients. J. Clin. Lipidol. 11, 1421–1431 (2017).
- Hilbert, T. et al. True constructive interference in the steady state (trueCISS): True CISS. Magn. Reson. Med. 79, 1901–1910 (2018).
- Roeloffs, V., Rosenzweig, S., Holme, H. C. M., Uecker, M. & Frahm, J. Frequency‐modulated SSFP with radial sampling and subspace reconstruction: A time‐efficient alternative to phase‐cycled bSSFP. Magn. Reson. Med. 81, 1566–1579 (2019).
- Nagtegaal, M., Koken, P., Amthor, T. & Doneva, M. Fast multi‐component analysis using a joint sparsity constraint for MR fingerprinting. Magn. Reson. Med. mrm.27947 (2019) doi:10.1002/mrm.27947.
- Hargreaves, B. A. et al. Dual-acquisition phase-sensitive fat–water separation using balanced steady-state free precession. Magn. Reson. Imaging 24, 113–122 (2006).
- Smith, T. B. & Nayak, K. S. MRI artifacts and correction strategies. Imaging Med. 2, 445–457 (2010).
Figures
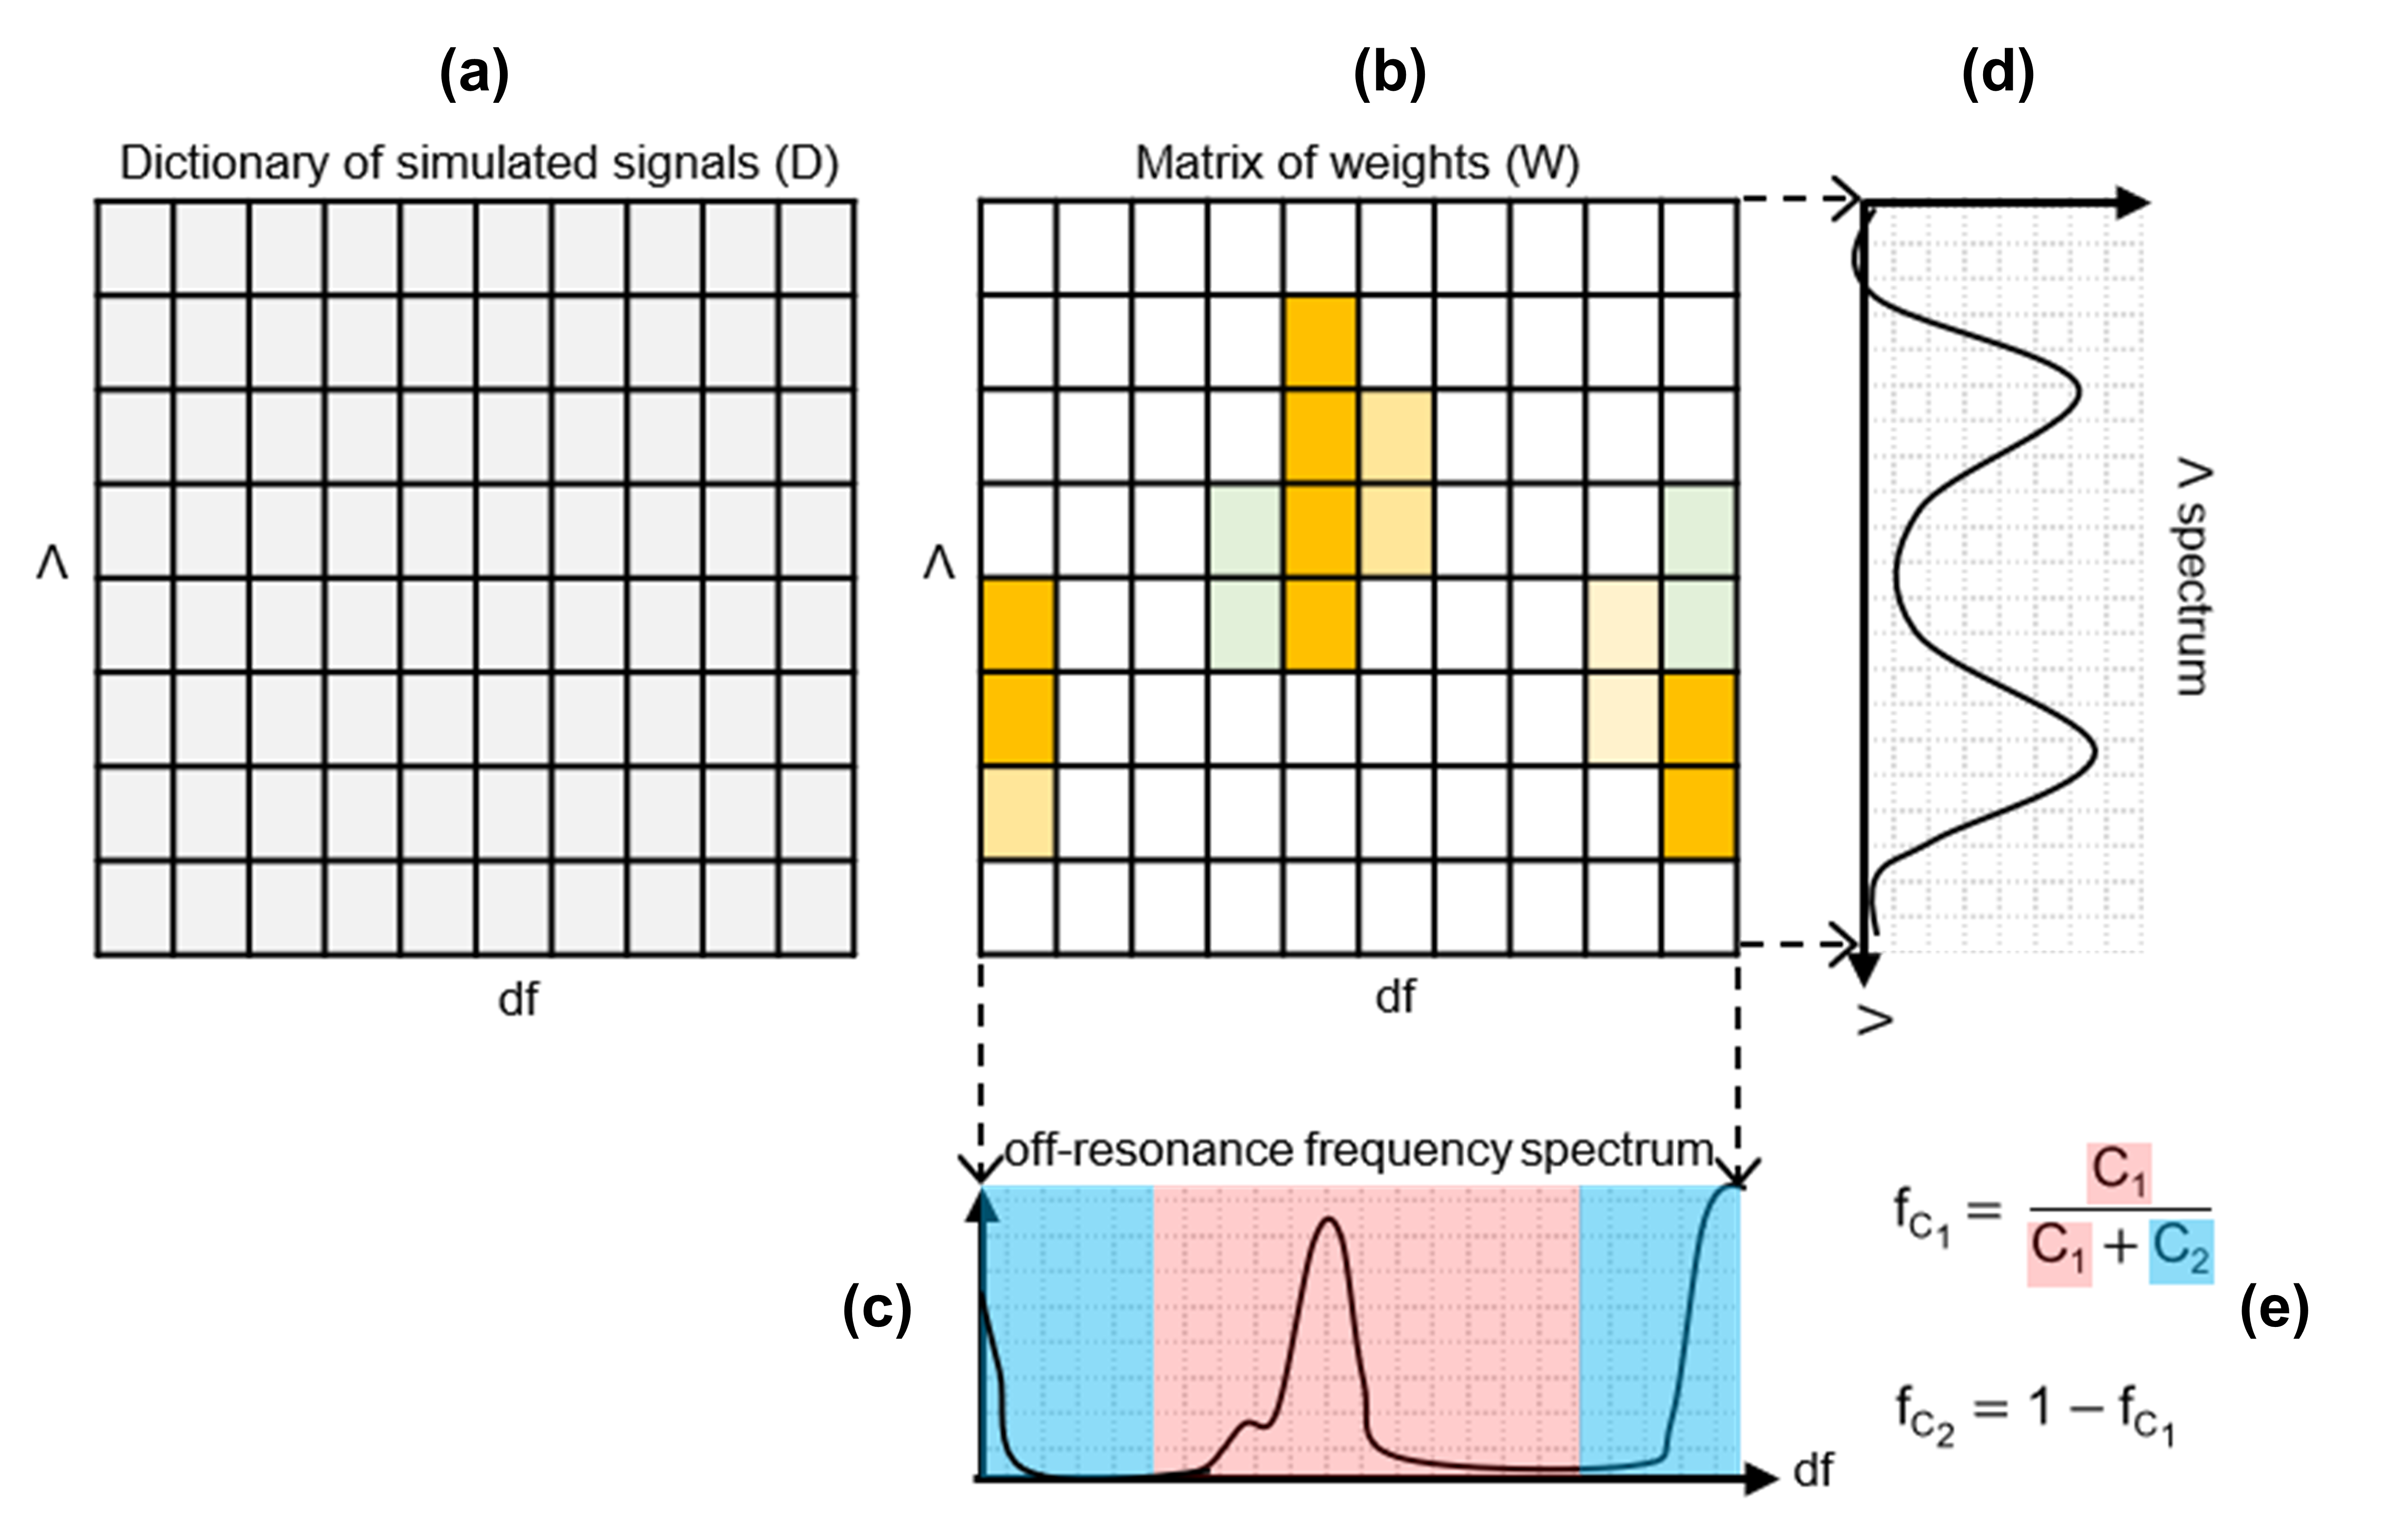
Figure 1. Estimation of relaxation
time ratio (Λ) and off-resonance frequency (df) spectra, and extraction of quantitative parameters. Each weight in (b) gives the contribution of the relative
dictionary entry in (a) to the
acquired signal. Λ and df spectra are
obtained by projecting the matrix of weights along its axis (c-d). For a 2-component system, the
fraction of one component is computed as the integral over the frequency range
assigned to it (C1, red) divided by the sum of the integrals over
the frequency range assigned to the first (C1, red) and second
component (C2, blue) (e).
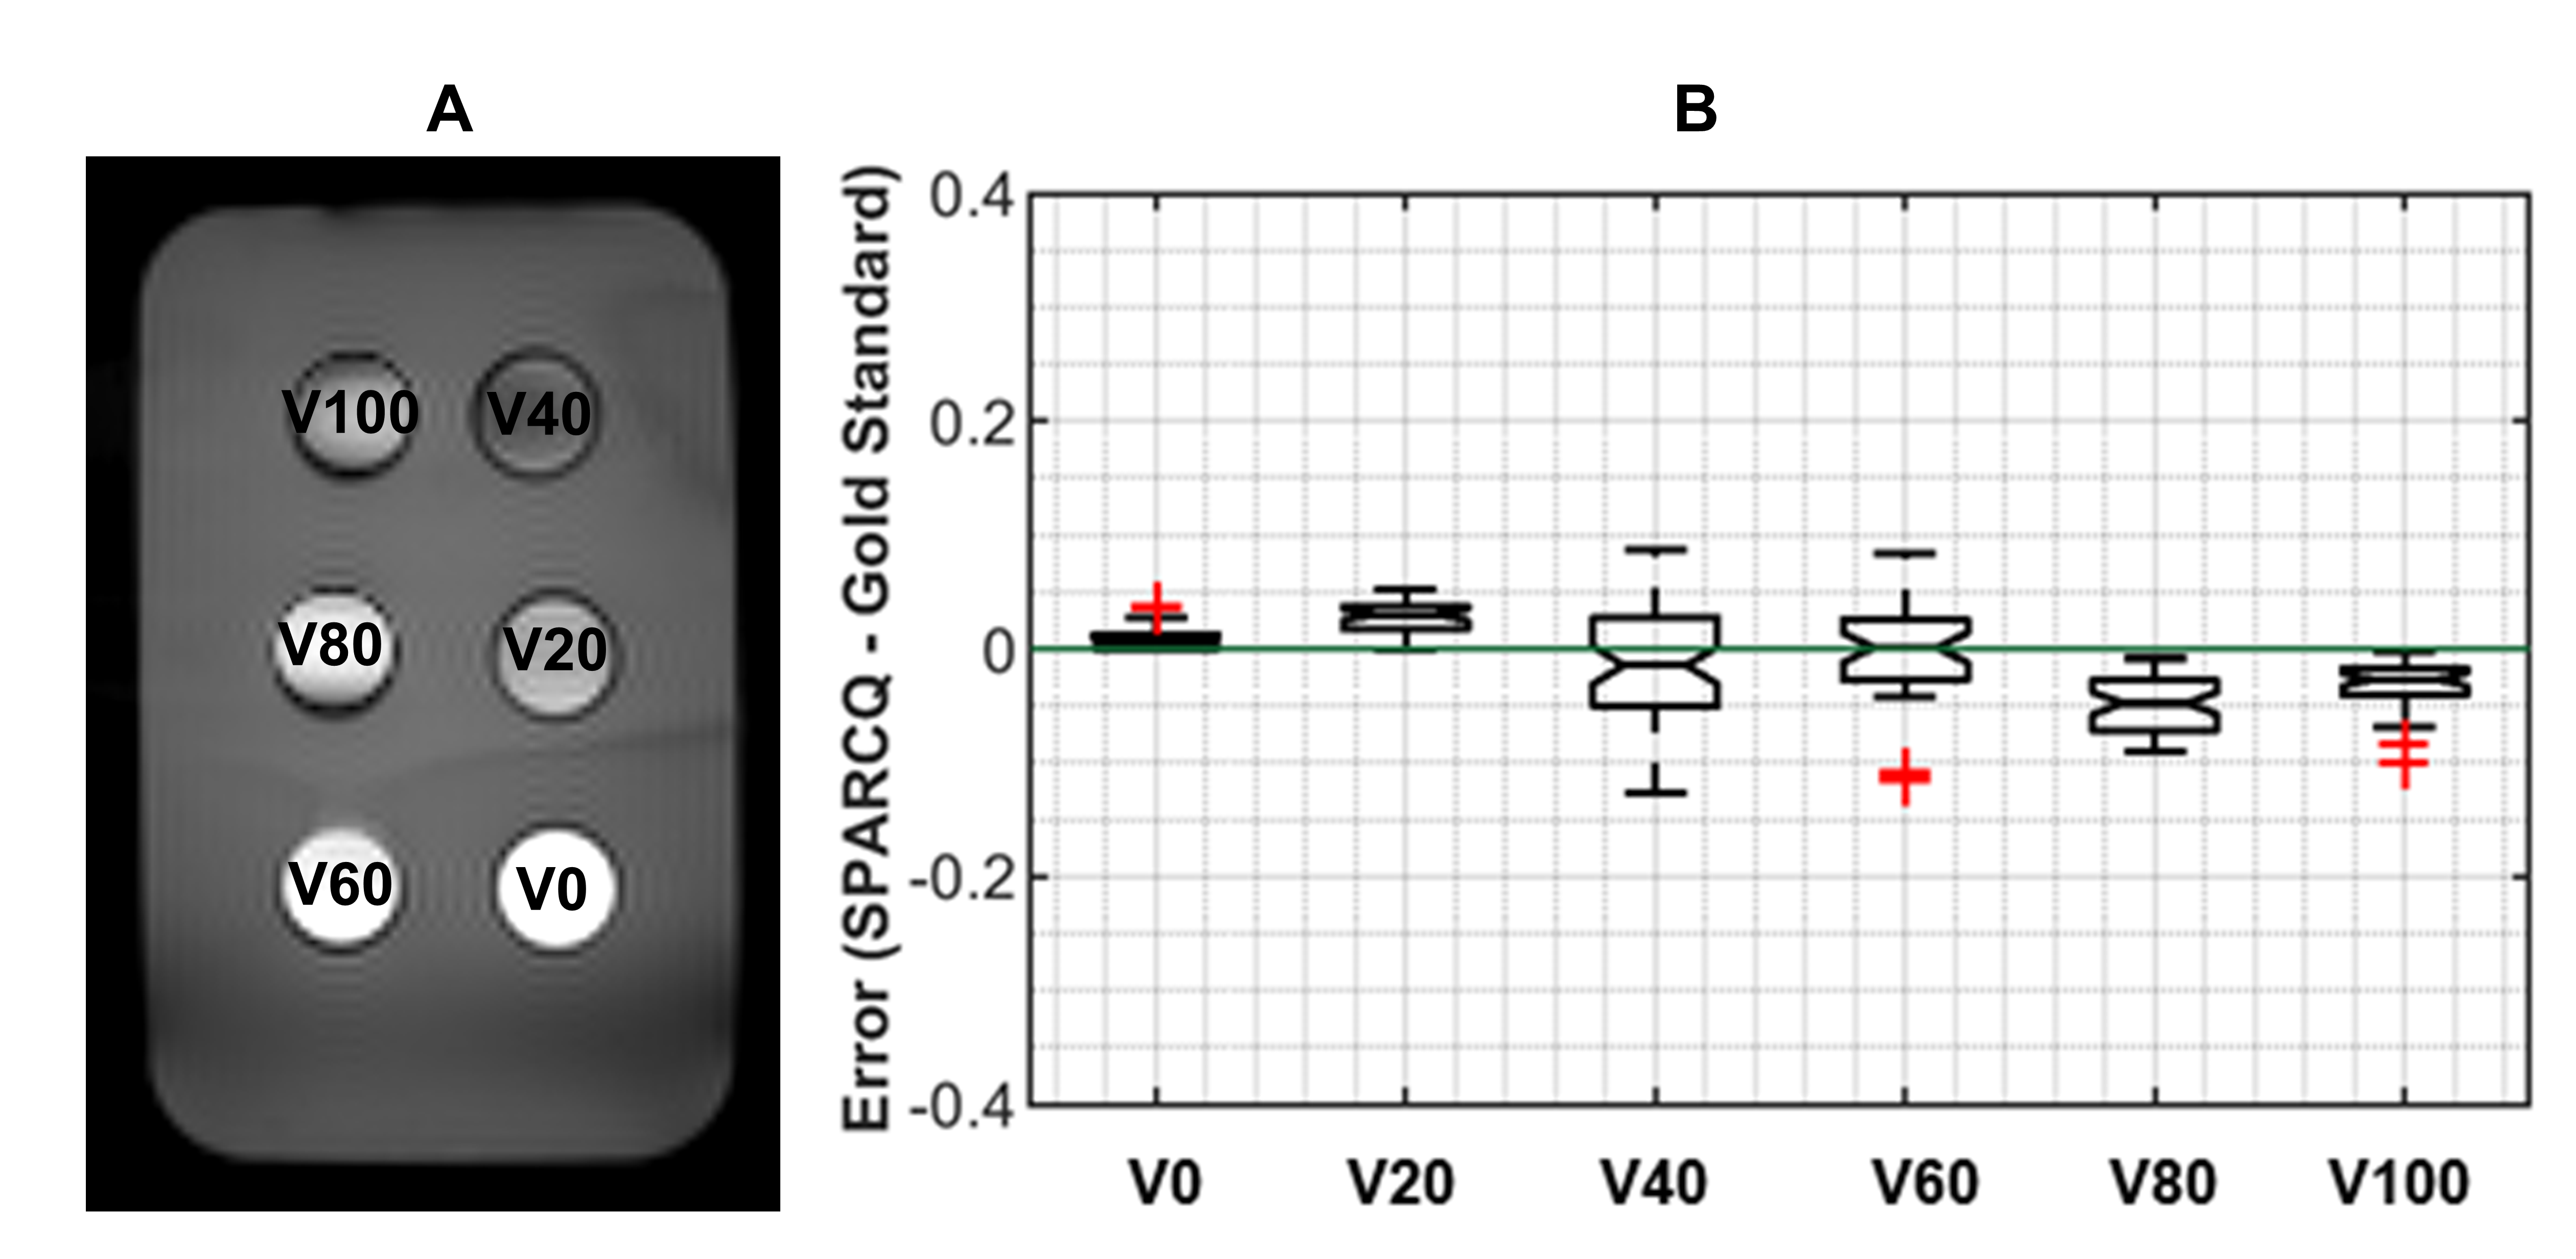
Figure 2. Accuracy of SPARCQ. A: Axial slice of the fat-water phantom ($$$\phi$$$ = 180°).
Fat fractions were estimated with SPARCQ in ROIs corresponding to the six
vials. B: Distributions of the
estimation error, defined as the difference between the voxel-wise fat
fractions estimated with SPARCQ and the perceived fat fractions at 9.4T in the
corresponding vial.
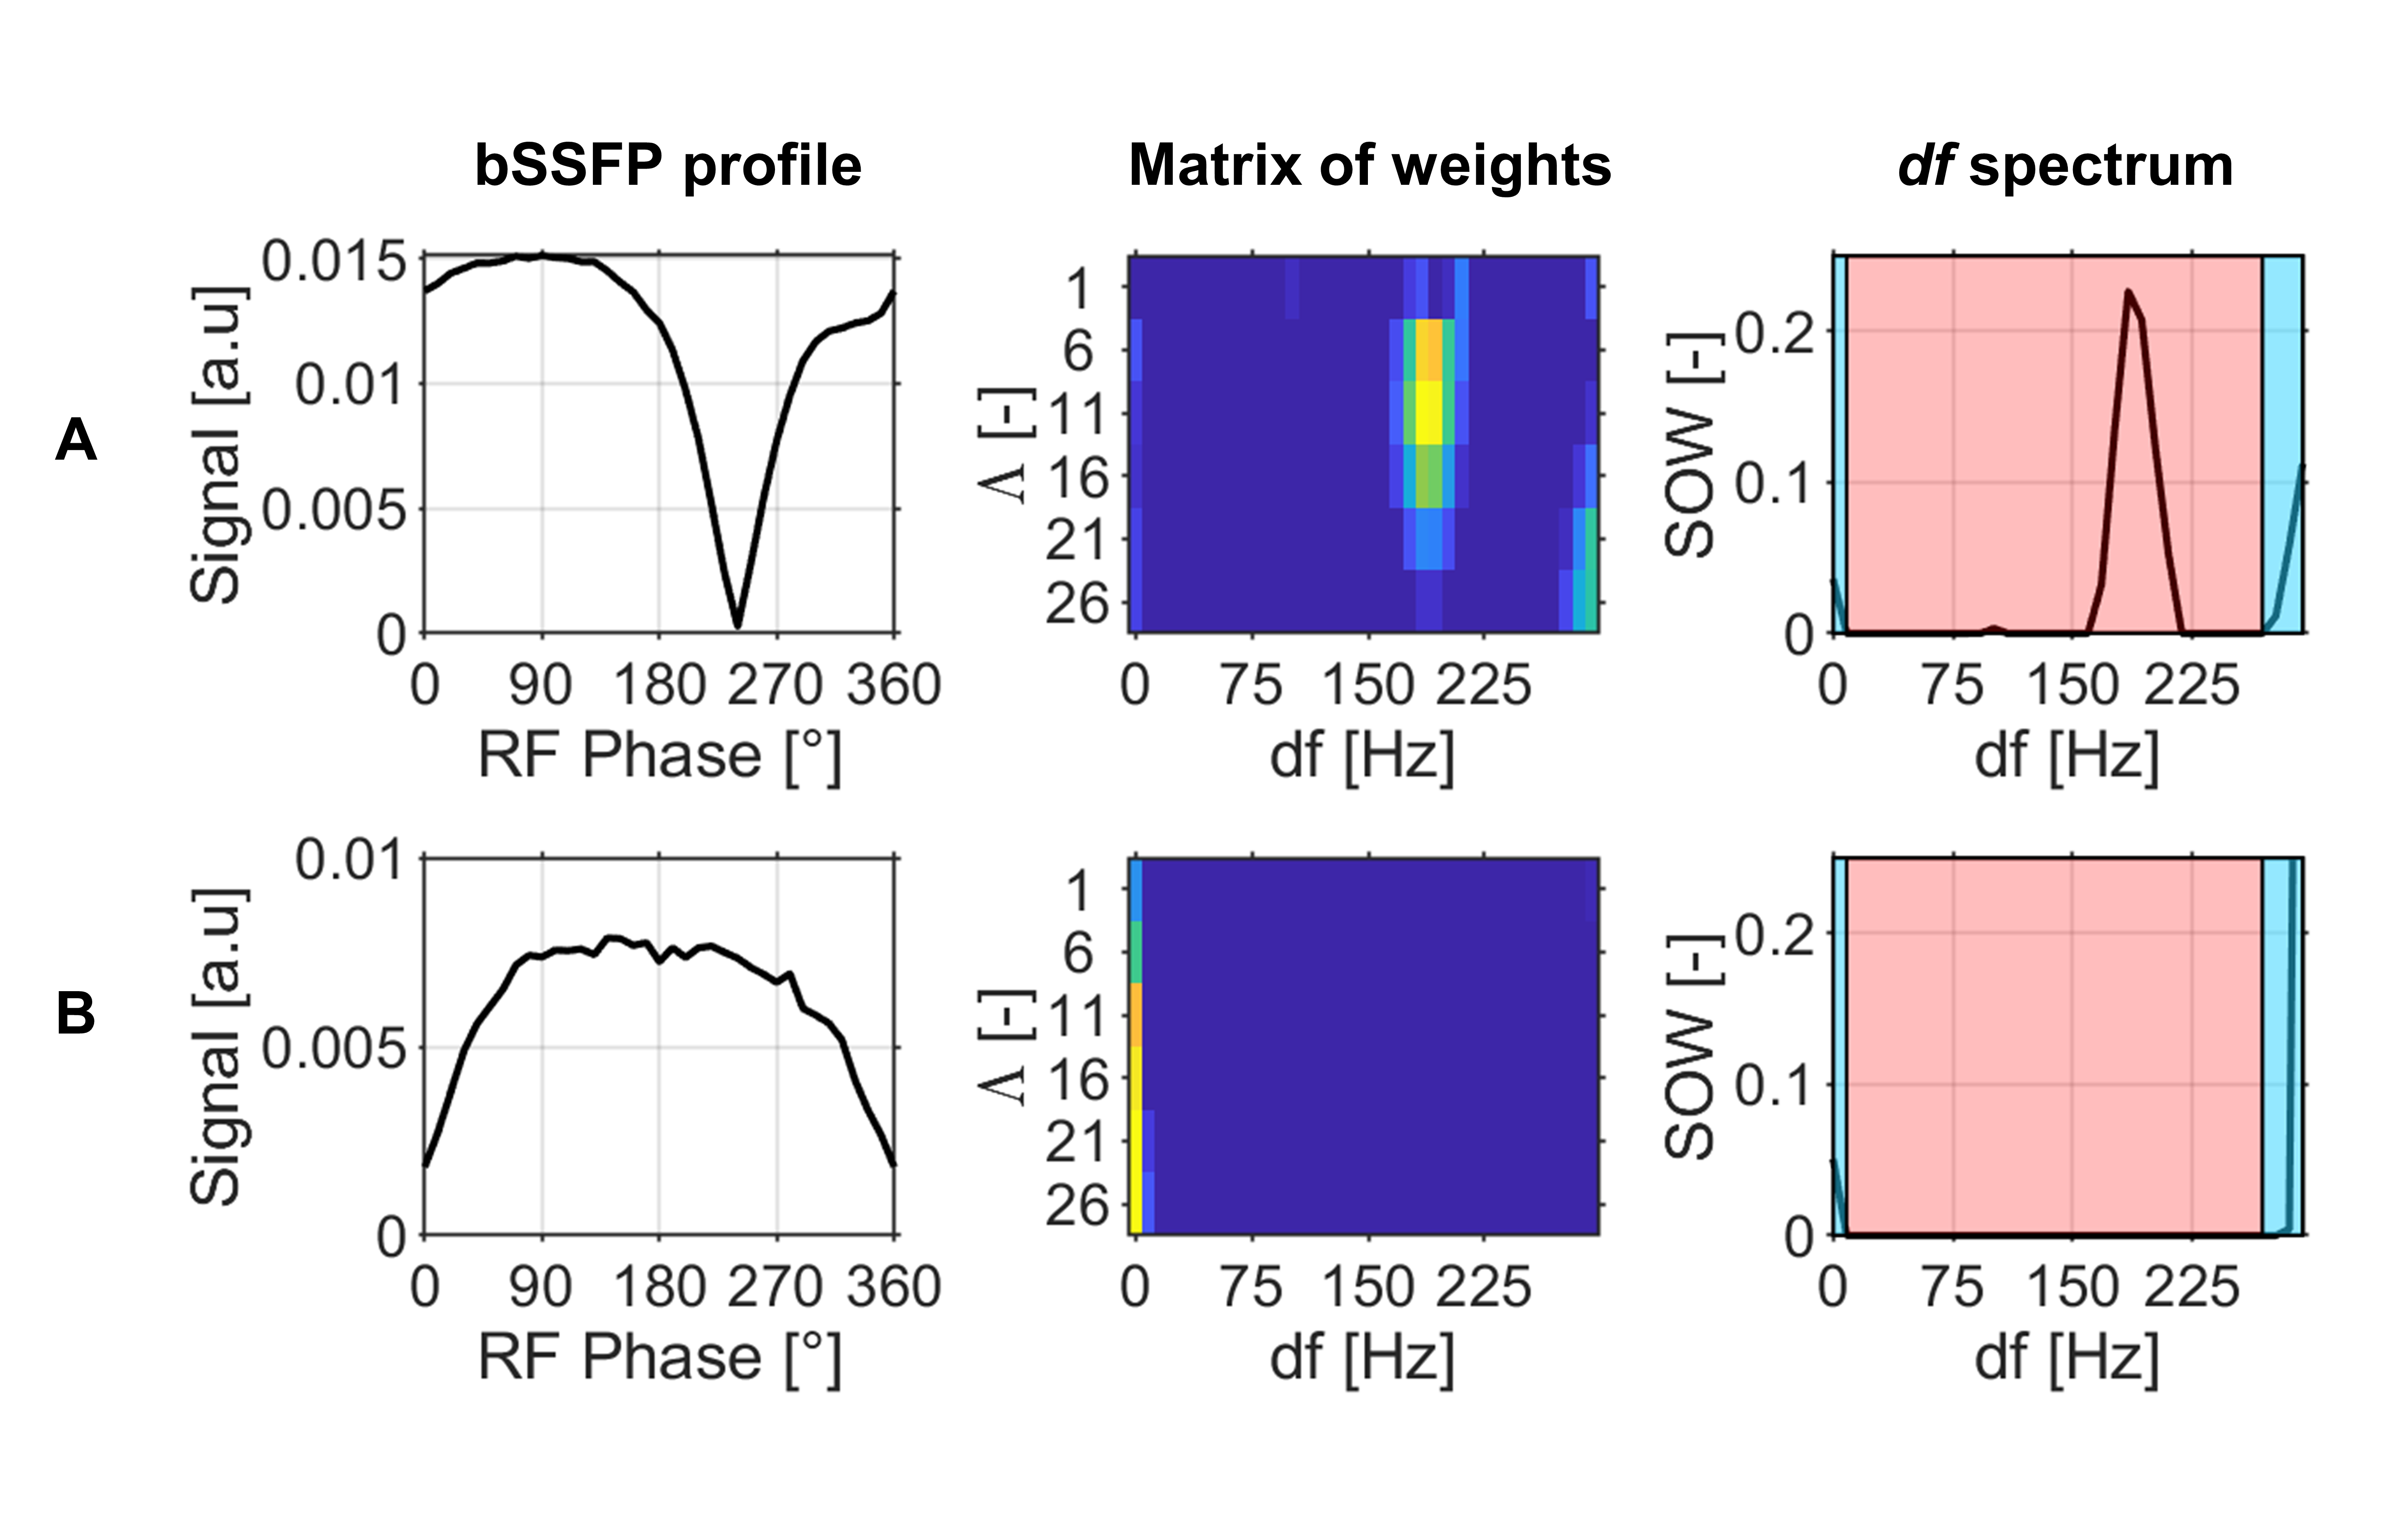
Figure 3. Example of fitting results in two voxels belonging to
different tissues. Acquired bSSFP signal profile (left), optimized matrix of weights (middle) and off-resonance frequency
spectrum (right) for a voxel
belonging to fatty (bone marrow, A)
and non-fatty (muscle, B) tissue. The df spectrum (right) is obtained by projecting the
matrix of weights (middle) along
the df axis (SOW: sum of weights). In
bone marrow (A), multiple frequency
components are detected (on-resonant water, off-resonant fat). In muscle (B), a single frequency component
(on-resonant water) is detected.
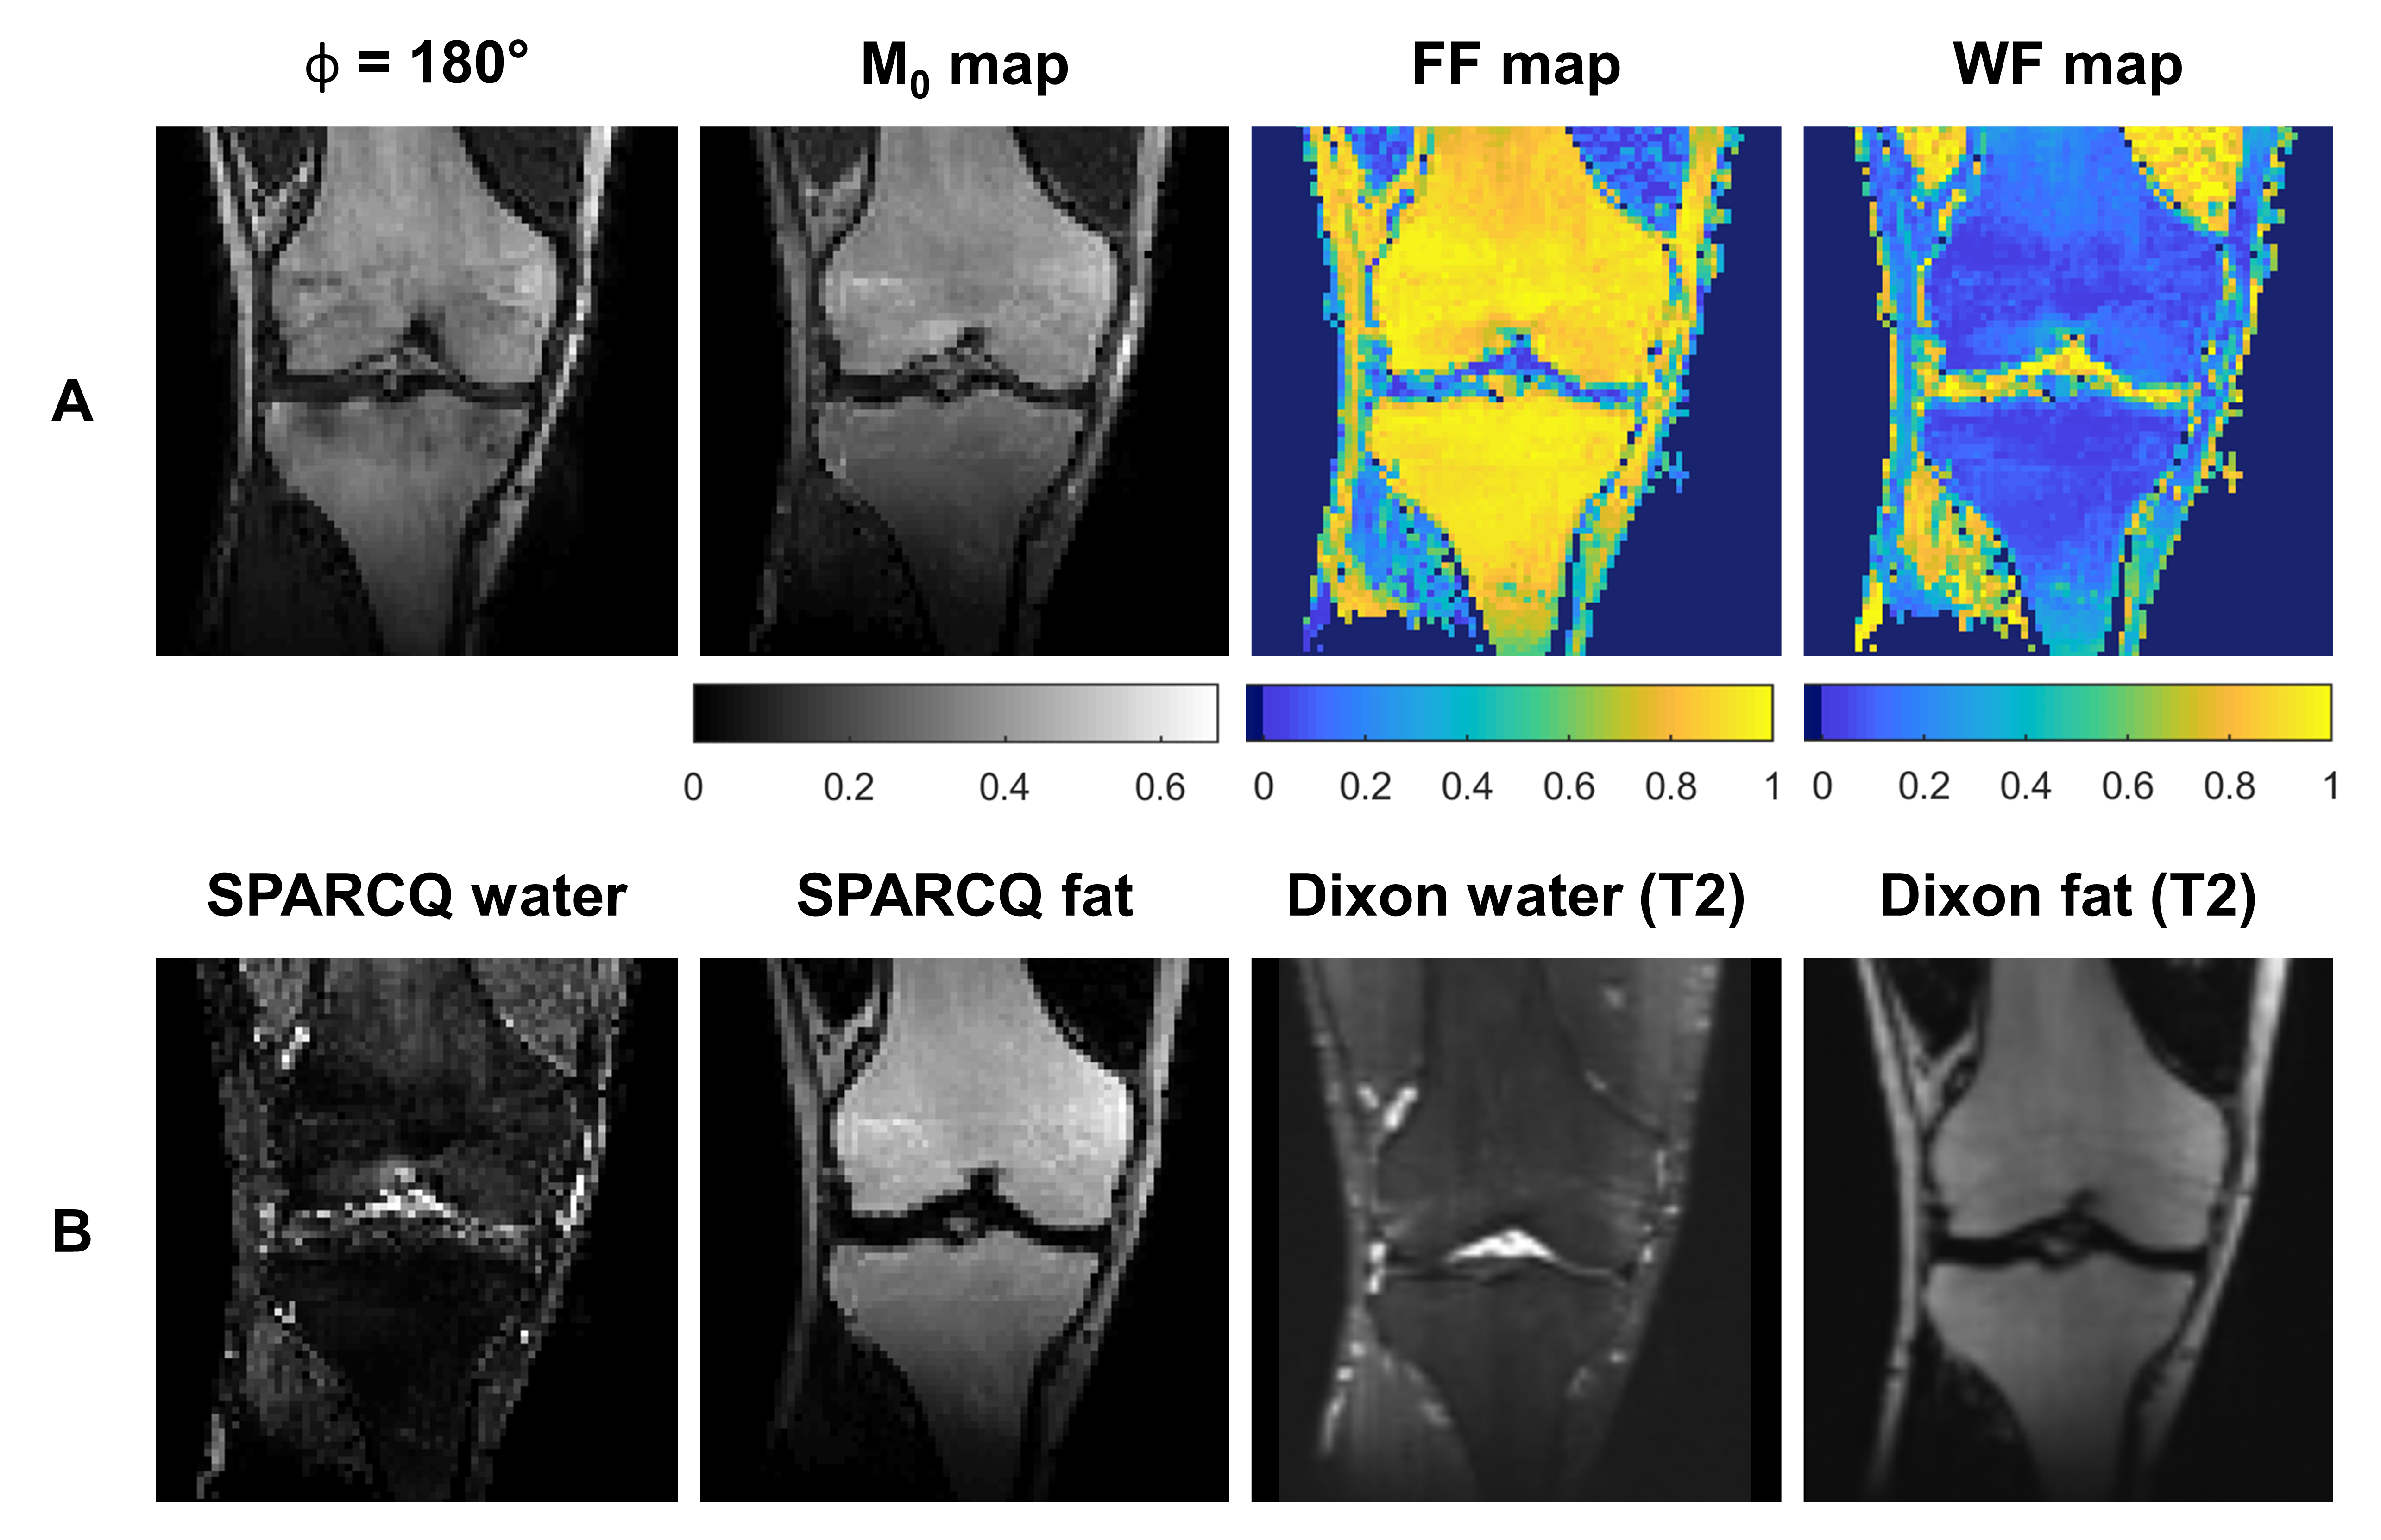
Figure 4. Parametric maps and water-fat-separated images. Example
images of one volunteer. A: Parametric
maps of the thermal equilibrium magnetization (M0),
fat fraction (FF), and water fraction (WF) obtained with SPARCQ in a coronal view. B: M0-weighted water-fat-separated images obtained with SPARCQ and
T2*-weighted water-fat-separated images obtained with TSE Dixon (TR/TE =
3470/100 ms, resolution (2mm)3, receiver bandwidth 601 Hz/px, turbo
factor 18; in-phase, out-of-phase, water and fat images were reconstructed on
the scanner).
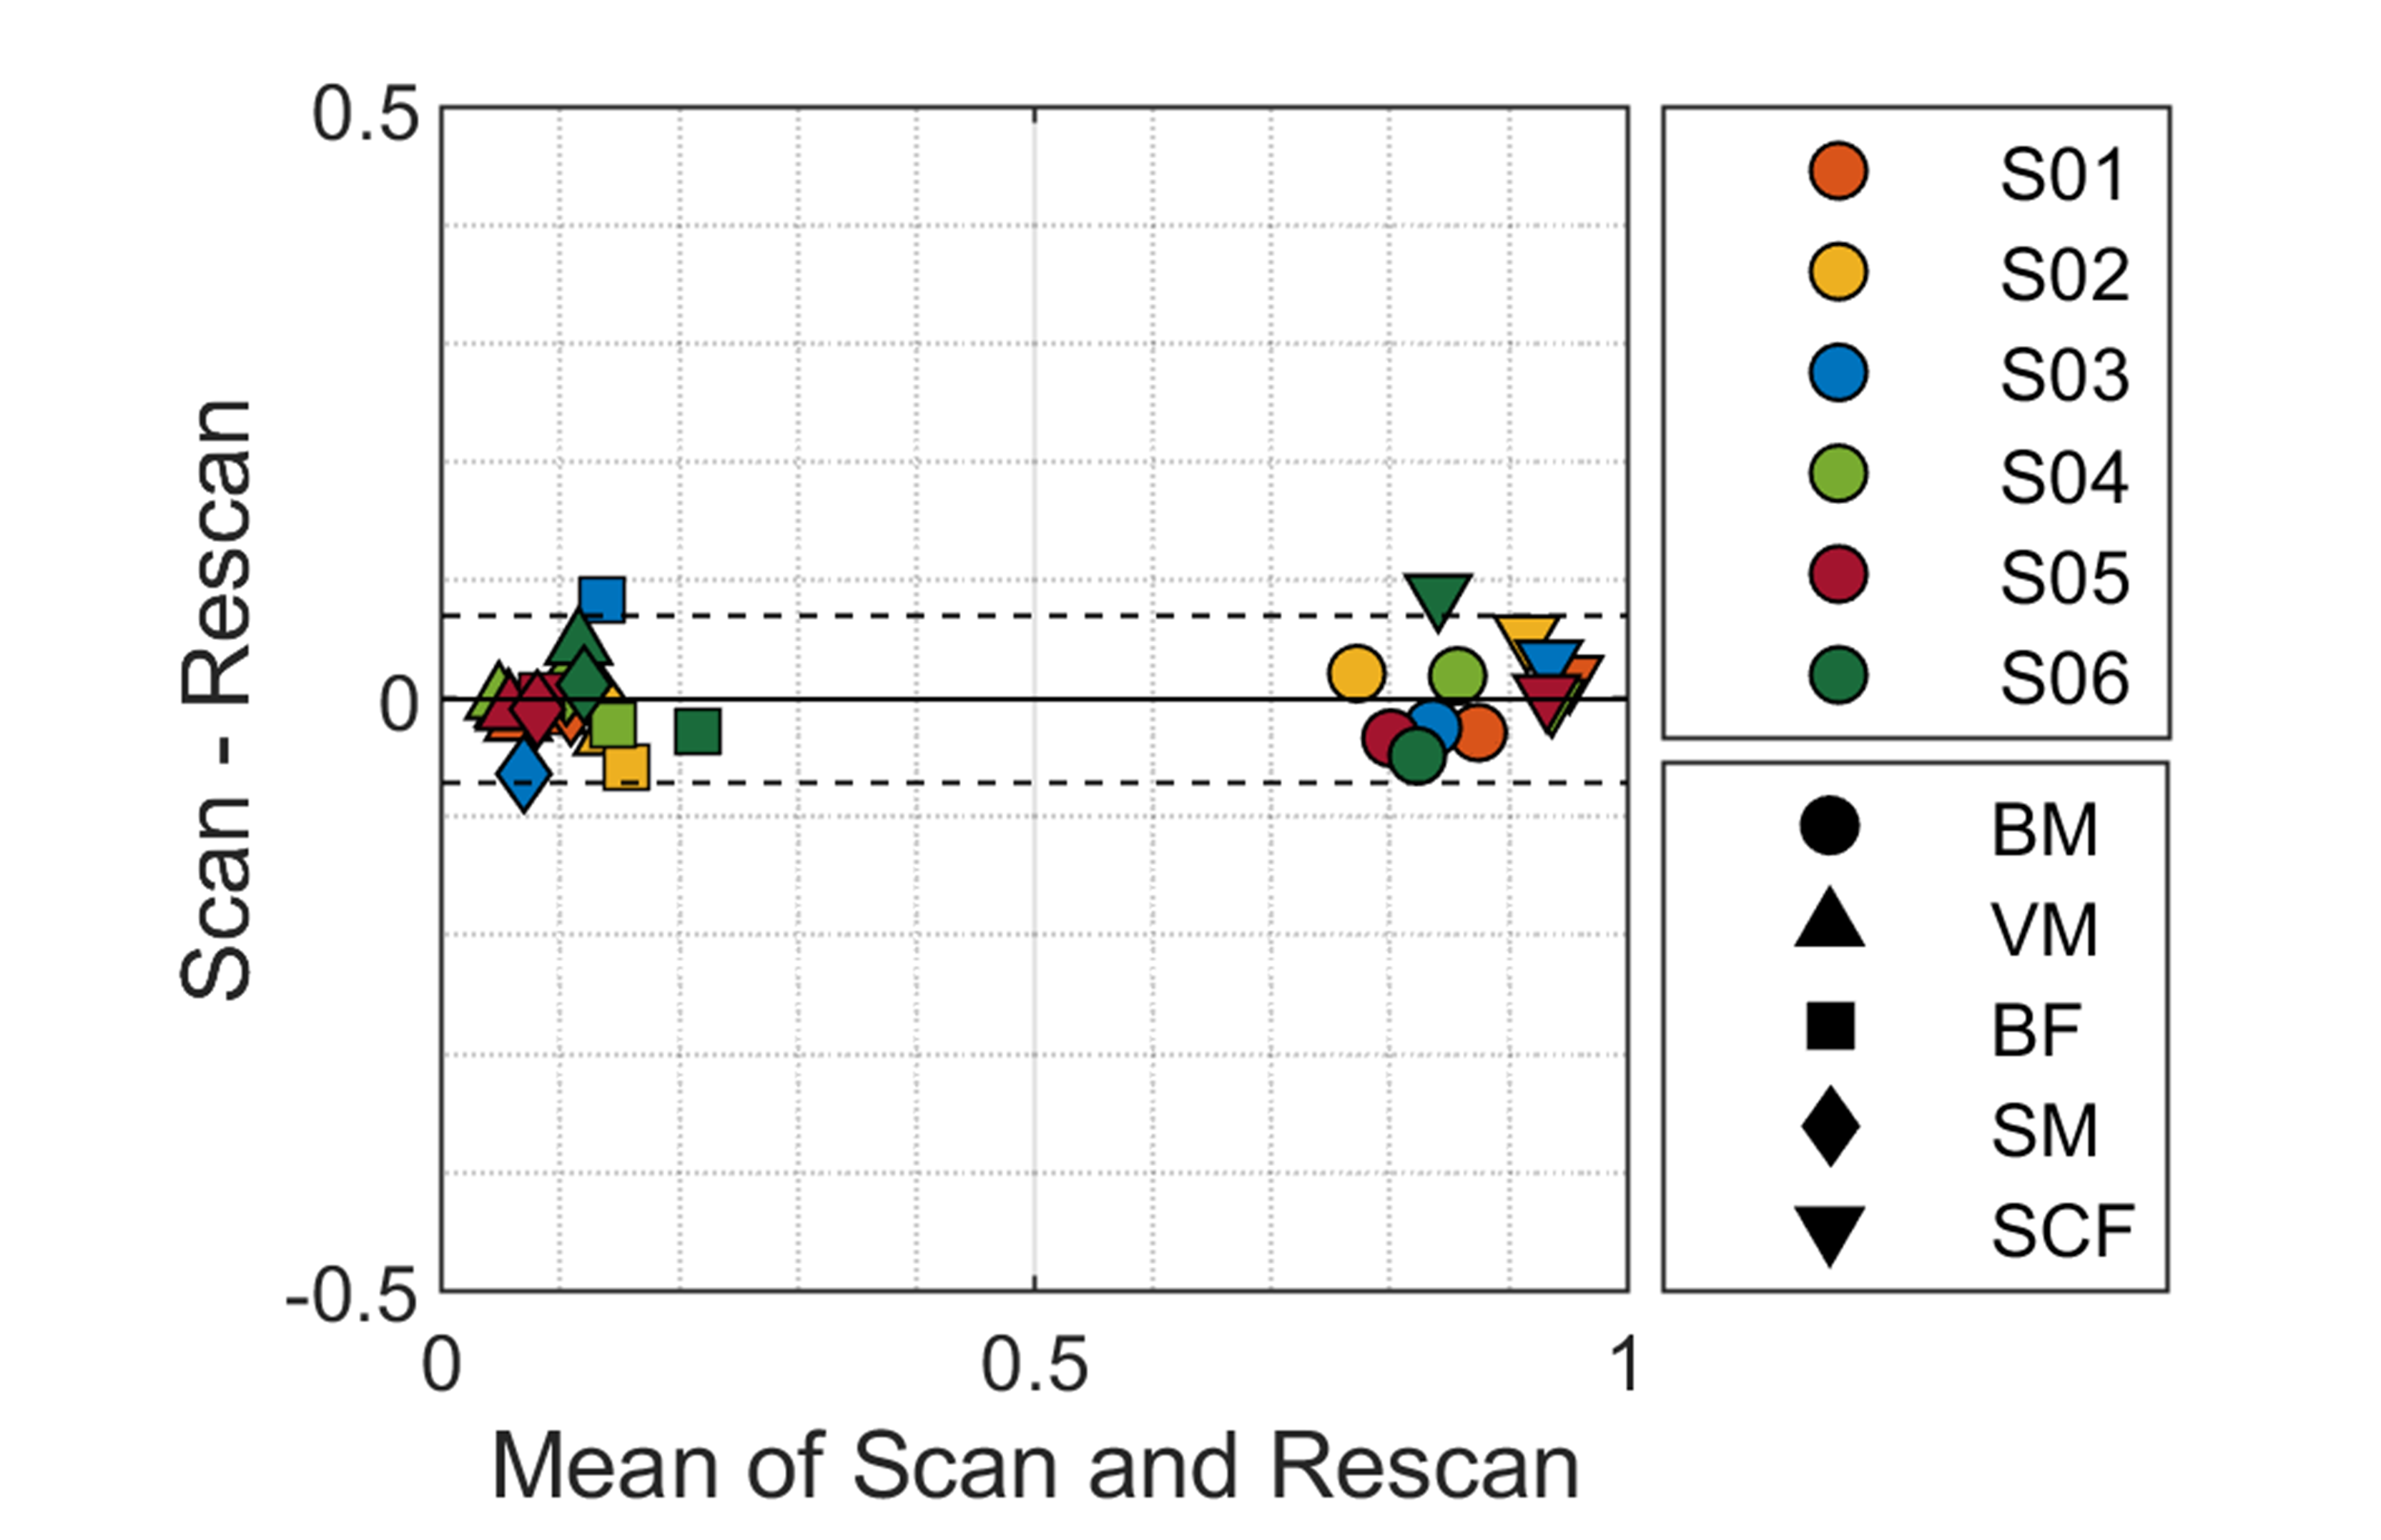
Figure 5. Scan-rescan
repeatability of the fat fractions estimated with SPARCQ. Bland-Altmann analysis of scan-rescan repeatability
in 6 volunteers (1 volunteer = 1 color) for 5 regions of interest (1 marker
type = 1 region). BM: bone marrow, VM: vastus medialis, BF: biceps femoralis, SM: semimembranous muscle, SCF: subcutaneous fat. Limits of
agreement: LOA = 0.0002 ± 1.96*0.0704. Coefficient of repeatability:
CR = 0.0695.