0512
Towards Absolute Quantification of Macromolecular Proton Content using Cross-Relaxation Imaging1Radiology, University of Wisconsin, Madison, WI, United States, 2Radiology, University of Washington, Seattle, WA, United States, 3Medical Physics, University of Wisconsin, Madison, WI, United States
Synopsis
Macromolecular proton fraction (MPF), the key two-pool MT model parameter, was established as a robust myelin-sensitive index, with clinical relevance in demyelinating diseases. However, as MPF assesses macromolecules relative to tissue water, its specificity to myelin is limited. i.e., MPF changes may occur independent of myelin, e.g., in the setting of inflammation and edema. Further, relating MPF to macromolecules may be ambiguous due to unequal concentrations of protons in macromolecular and water compartments. We demonstrate implications of these effects for MPF interpretation using phantom and ex-vivo experiments and propose a new macromolecular measure that explicitly accounts for tissue water effects.
INTRODUCTION
Two-pool modeling of magnetization transfer (MT) effect in biological tissue yields several parameters uniquely characterizing its macromolecular and water compartments1. The key parameter of interest, macromolecular proton fraction (MPF), was established as a robust myelin-sensitive index2-4, with demonstrated clinical relevance in demyelinating diseases, including multiple sclerosis (MS)5-7. However, as MPF only assesses macromolecules relative to tissue water, its specificity to myelin is necessarily limited, i.e., changes in MPF may occur independent of myelin status, e.g., in the setting of inflammation and edema8, which alter tissue water content and vary with disease course and therapy9. Further, relating MPF to macromolecular content may be ambiguous due to unequal molar concentrations of protons in macromolecular and water compartments10. In this work, we demonstrate implications of these effects for MPF interpretation using controllable phantom and ex-vivo experiments and propose a new measure of macromolecular content that explicitly accounts for tissue water effects.THEORY
$$$MPF$$$ is defined as a ratio of macromolecular ($$$M_b$$$) to total ($$$M_0$$$) (i.e., macromolecular+free water ($$$M_w$$$)) proton magnetizations:$$MPF=M_b/M_0\\ M_0=M_b+M_w.$$Equivalently, in terms of compartment-specific molar proton concentrations $$$C_b,C_w$$$ and volumes $$$V_b,V_w$$$10,$$MPF=C_bV_b/(C_bV_b+C_wV_w).$$The sought proportionality of $$$MPF$$$ to $$$V_b$$$ is confounded by its dependence on $$$V_w$$$ and ratio of $$$C_b$$$ to $$$C_w$$$. To circumvent these limitations, we propose to measure macromolecular protons with respect to a standard reference, e.g., magnetization of pure water ($$$M_{ref}$$$). The new parameter, macromolecular proton content ($$$MPC$$$),$$MPC=M_b/M_{ref},$$can be calculated as$$MPC=PD_T\cdot{MPF}.$$Here, $$$PD_T=M_0/M_{ref}$$$ and reflects the total (macromolecules + water) proton density. Using standard $$$PD$$$ map from variable flip angle (VFA), spoiled gradient echo (SPGR) single-pool $$$PD/T_1$$$ mapping11 as an estimate of $$$PD_T$$$ may not be accurate, because it does not account for macromolecular protons. Instead, we utilize modified cross-relaxation imaging (mCRI) method12, which estimates $$$MPF$$$ and other two-pool MT parameters accounting for total magnetization in its equation, given in general form as:$$I=S_0\cdot{F}_{ST}(MPF,k,R_{1w},T_{2b}),$$where $$$S_0$$$ is total magnetization weighted by instrumental scaling $$$\beta$$$, receiver sensitivity $$$C$$$, and $$$R_2^*$$$ decay:$$S_0=\beta{C}e^{-R_2^*T_E}M_0.$$It follows that $$$PD_T$$$ can be obtained by demodulating by pre-measured $$$C$$$ and $$$R_2^*$$$ maps,$$S_{0,D}=\frac{S_0}{Ce^{-R_2^*T_E}},$$and normalizing result by its average in pure water (e.g., in water vial):$$PD_T=S_{0,D}/<S_{0,D}>.$$METHODS
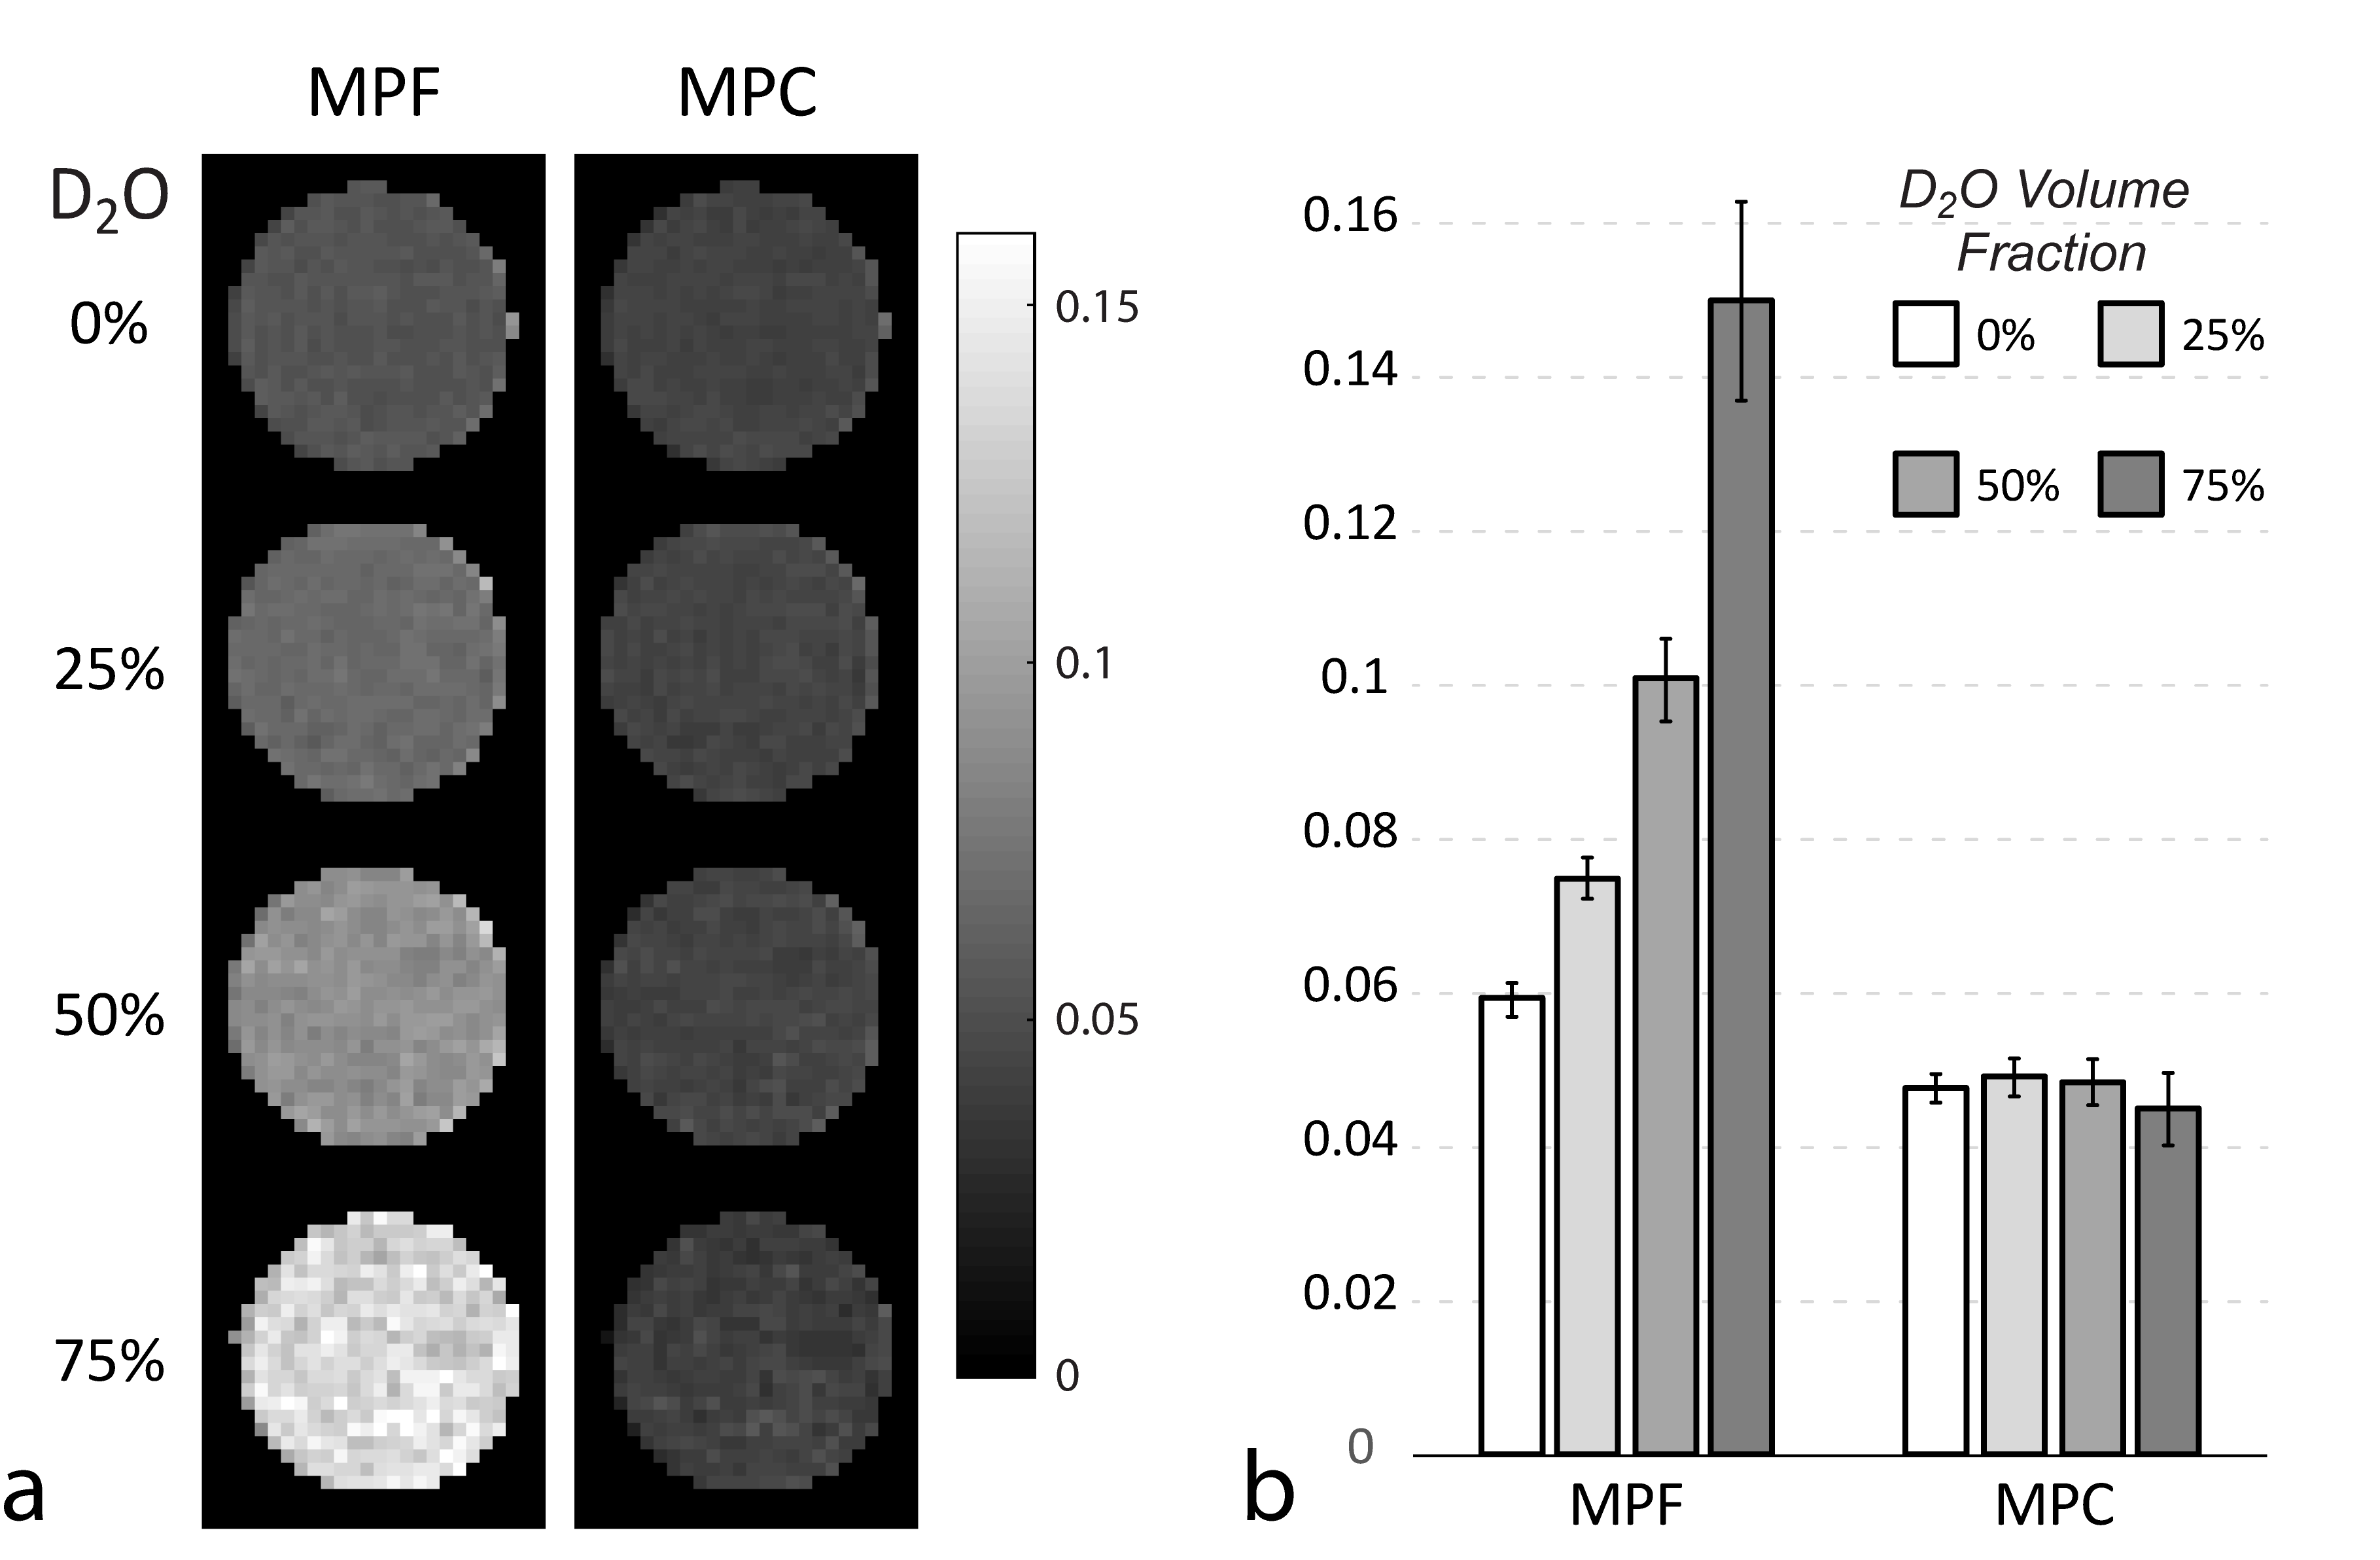
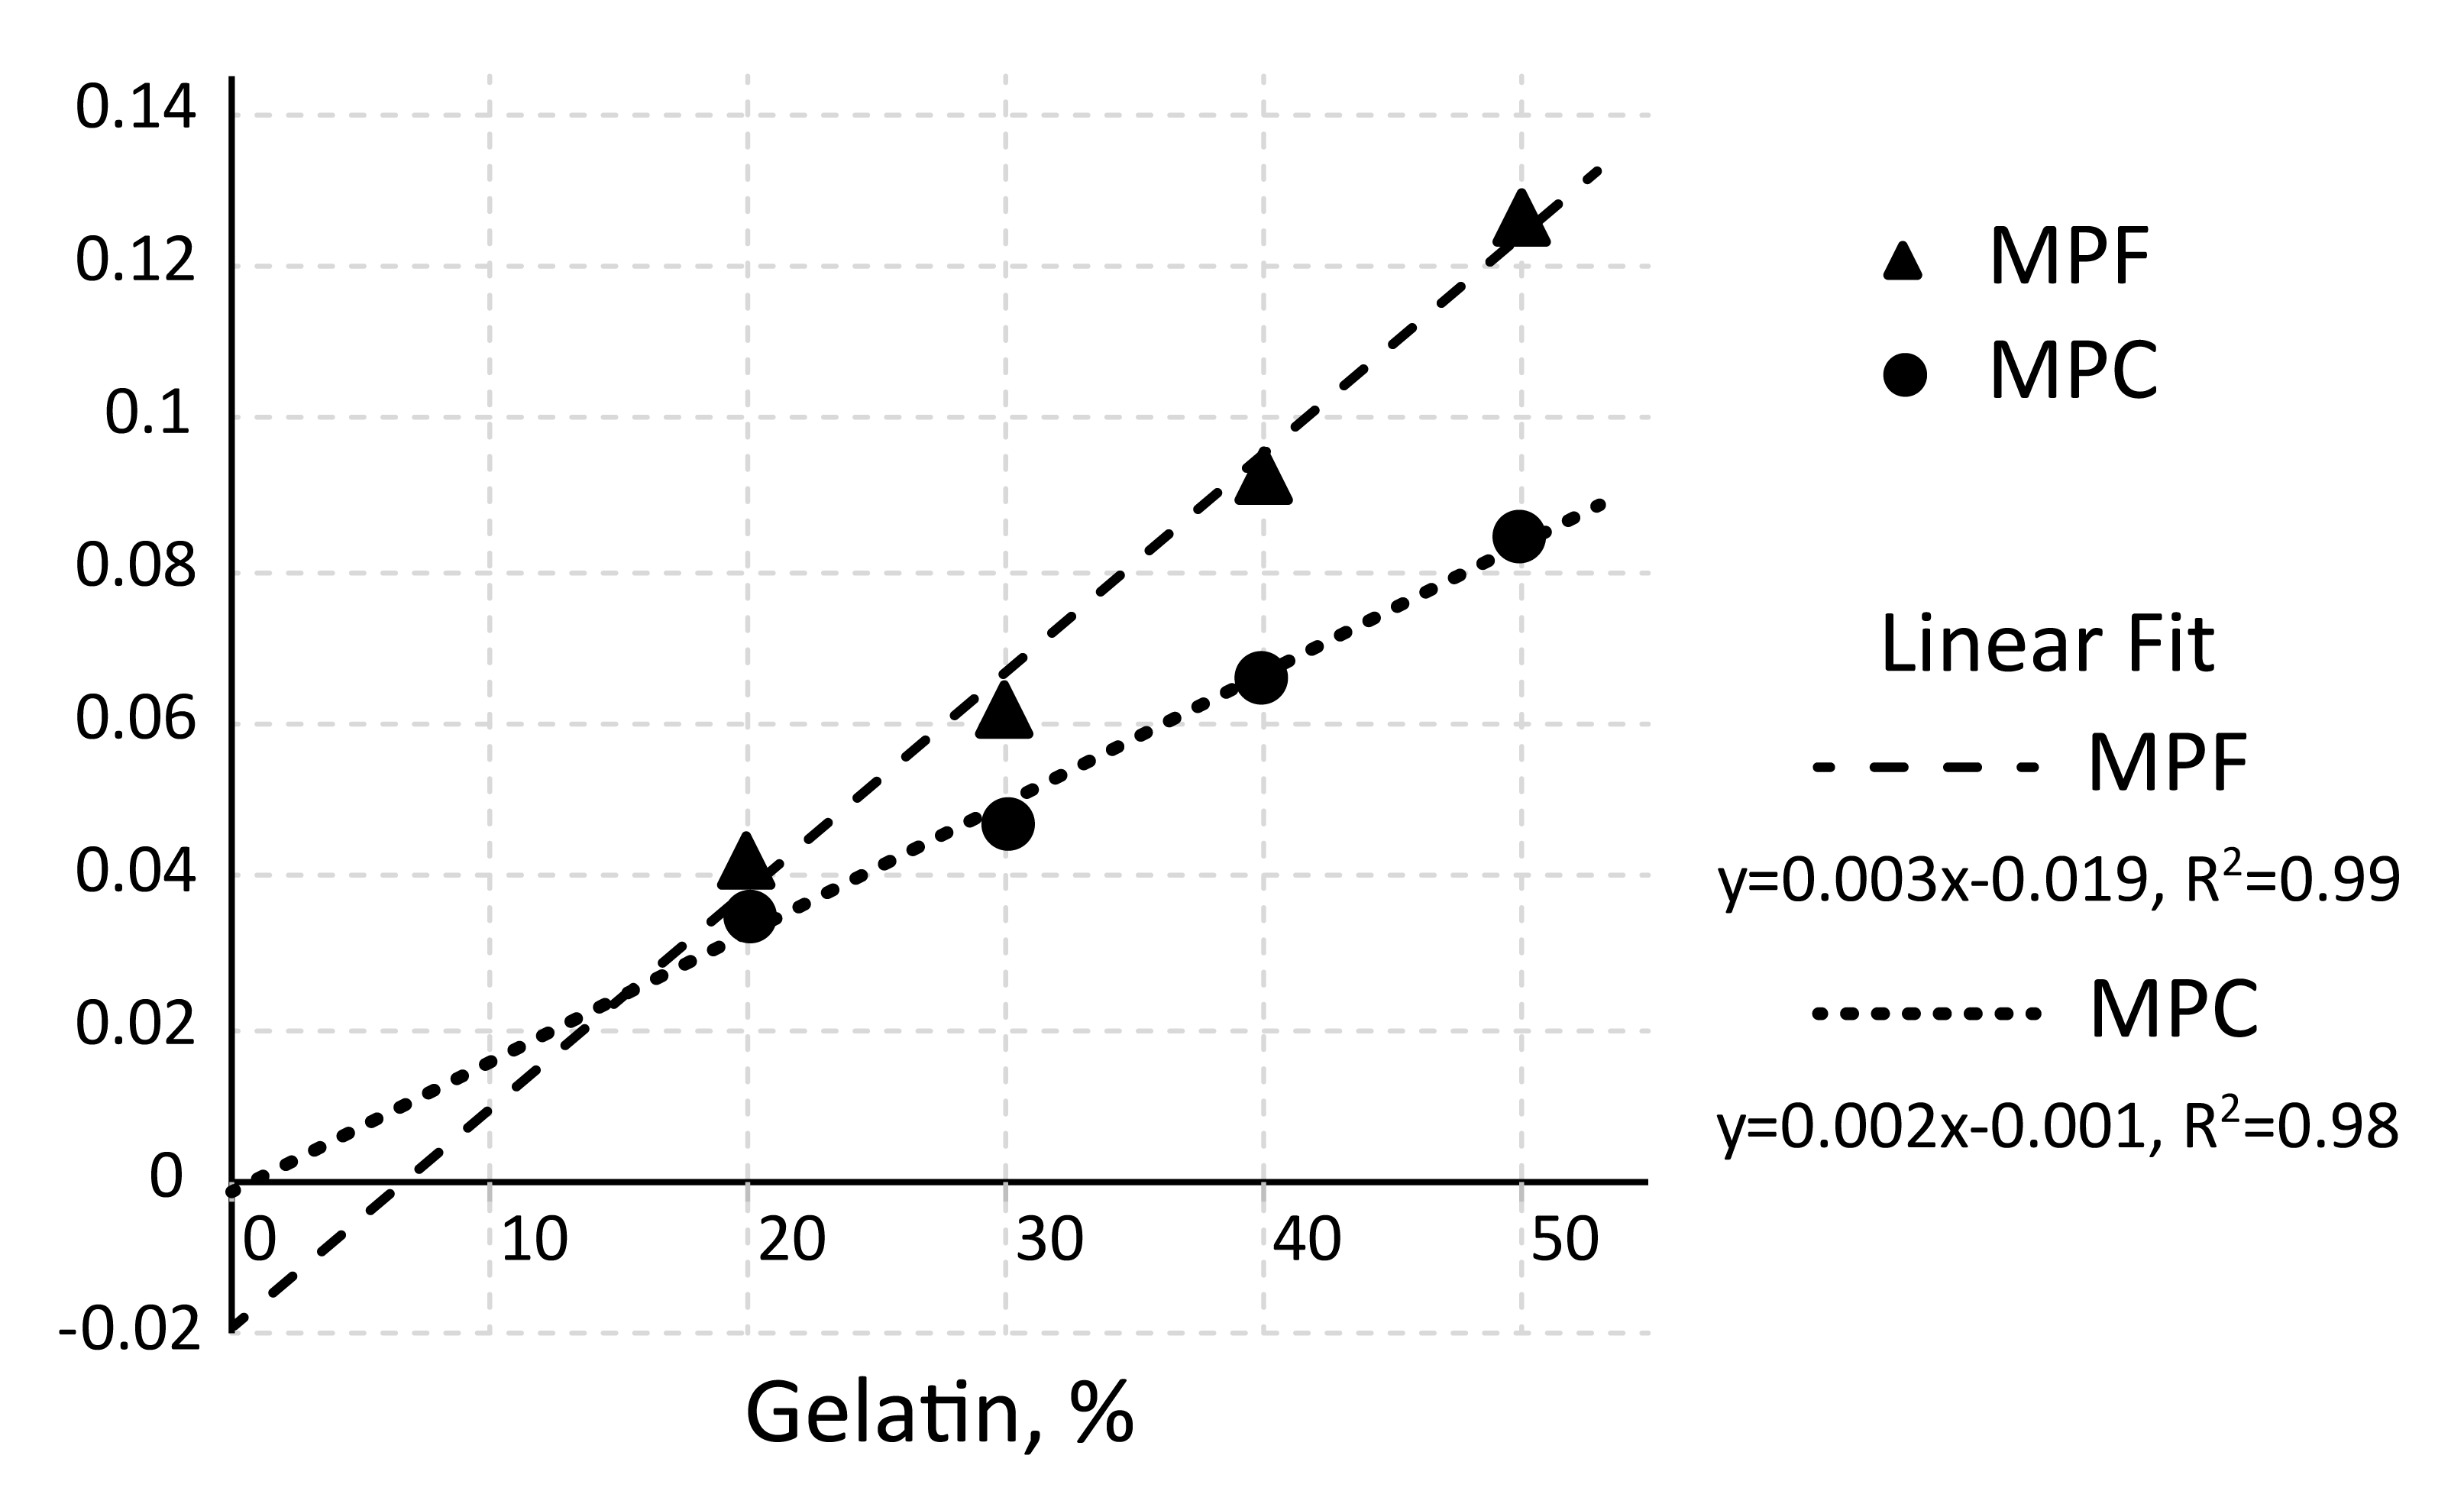
The experiments were performed in gelatin phantoms and ex-vivo tissue. One phantom set was created by dissolving gelatin in H2O at 20,30,40,50% concentrations (by weight). The second set of 30% gelatin phantoms was created using mixtures of H2O and MRI-invisible D2O of varying proportions (D2O=0,25,50,75%). One hemisphere of fixed canine brain slab was soaked in 40%/60% D2O/H2O mix until reaching diffusion equilibrium with tissue water (controlled by monitoring MRI signal until its stabilization, ~1h) to modulate tissue water compartment. The other hemisphere was placed into water and served as the control. Experiments were performed on 3.0T GE MR750 (Waukesha, WI). The objects were scanned along with water vial as a reference using 8ch coil. mCRI acquisition protocol included B1 mapping with AFI13 and four VFA SPGR and eight MT-SPGR scans with different combinations of off-resonance frequency and MT saturation powers as described before12. A reference scan from each set was repeated with body coil. The receiver sensitivity $$$C$$$ was obtained using body coil normalization14 with correction of residual sensitivity by 2nd order polynomial15. $$$R_2^*$$$ effects were ignored due to short $$$T_E$$$=1.7ms. The fit was performed with full mCRI model12. Ten WM and ten GM structures were manually labelled in D2O-treated hemisphere of the ex-vivo sample; ROIs placed in the contralateral structures of non-treated hemisphere served as paired controls. The differences were evaluated using paired t-test, with statistical significance set at p=0.05.RESULTS
Figure 1 illustrates correction in H2O+D2O+30% gelatin phantoms. MPF increases dramatically with increasing D2O proportion (decreasing water content) demonstrating its limitation for tissue water-independent assessment of macromolecules. Low sensitivity of MPC to H2O+D2O proportions indicates its higher specificity to macromolecular content. Both MPF and MPC vary linearly with gelatin concentration in H2O phantoms (Fig. 2). Yet, the analysis of intercepts indicates a weaker agreement with absolute macromolecular content for MPF as compared to MPC, potentially due to different proton molar fractions in gelatin and water. Figure 3 shows results of ex-vivo experiments. MPF values in WM/GM were significantly different (p<1e-5) between control and D2O-treated hemispheres (percent errors relative to the control 31.20%/25.98% for WM/GM, respectively). At the same time, MPC differences (1.34%/2.44%) were not statistically significant (p=0.38/0.11). Correction by standard PD map from VFA SPGR fit11 led to more pronounced and statistically significant differences in MPC (5.29%/4.71%, p<0.003), indicating improved accuracy of mCRI-based mapping for tissue water correction.CONCLUSIONS
Our results confirm theoretical sensitivity of MPF to water compartment properties. As such, its interpretation may be ambiguous in settings of inflammation and edema and other pathological substrates modulating tissue composition (e.g., gliosis and cellular infiltrations). The proposed MPC compensates the tissue water effects using mCRI-based estimate of proton density and external water standard for normalization. For in-vivo applications, the normalization may be based on the cerebrospinal fluid signal, which provides internal, temperature-consistent reference in standard PD mapping16. MPC may be useful as a measure of brain remyelination in trials of anti-inflammatory MS therapies and stroke studies, in which normalization of water content due to resolution of edema is known to affect other tissue water-sensitive outcome measures of brain repair9,17.Acknowledgements
The work was supported by NIH (R01EB027087, R21NS109727) and GE Healthcare. We thank Dr. Ian Duncan (UW-Madison) for providing the fixed brain samples.References
1. Henkelman RM, Huang X, Xiang QS, Stanisz GJ, Swanson SD, Bronskill MJ. Quantitative interpretation of magnetization transfer. Magn Reson Med 1993;29(6):759-766.
2. Dula AN, Gochberg DF, Valentine HL, Valentine WM, Does MD. Multiexponential T2, magnetization transfer, and quantitative histology in white matter tracts of rat spinal cord. Magn Reson Med 2010;63(4):902-909.
3. Samsonov A, Alexander AL, Mossahebi P, Wu YC, Duncan ID, Field AS. Quantitative MR imaging of two-pool magnetization transfer model parameters in myelin mutant shaking pup. Neuroimage 2012;62(3):1390-1398.
4. Khodanovich MY, Sorokina IV, Glazacheva VY, Akulov AE, Nemirovich-Danchenko NM, Romashchenko AV, Tolstikova TG, Mustafina LR, Yarnykh VL. Histological validation of fast macromolecular proton fraction mapping as a quantitative myelin imaging method in the cuprizone demyelination model. Scientific reports 2017;7:46686.
5. Davies GR, Tozer DJ, Cercignani M, Ramani A, Dalton CM, Thompson AJ, Barker GJ, Tofts PS, Miller DH. Estimation of the macromolecular proton fraction and bound pool T2 in multiple sclerosis. Mult Scler 2004;10(6):607-613.
6. Schmierer K, Tozer DJ, Scaravilli F, Altmann DR, Barker GJ, Tofts PS, Miller DH. Quantitative magnetization transfer imaging in postmortem multiple sclerosis brain. J Magn Reson Imaging 2007;26(1):41-51.
7. Yarnykh VL, Bowen JD, Samsonov A, Repovic P, Mayadev A, Qian P, Gangadharan B, Keogh BP, Maravilla KR, Jung Henson LK. Fast whole-brain three-dimensional macromolecular proton fraction mapping in multiple sclerosis. Radiology 2015;274(1):210-220.
8. Levesque I, Sled JG, Narayanan S, Santos AC, Brass SD, Francis SJ, Arnold DL, Pike GB. The role of edema and demyelination in chronic T1 black holes: a quantitative magnetization transfer study. J Magn Reson Imaging 2005;21(2):103-110.
9. Zivadinov R, Reder AT, Filippi M, Minagar A, Stuve O, Lassmann H, Racke MK, Dwyer MG, Frohman EM, Khan O. Mechanisms of action of disease-modifying agents and brain volume changes in multiple sclerosis. Neurology 2008;71(2):136-144.
10. West KL, Kelm ND, Carson RP, Gochberg DF, Ess KC, Does MD. Myelin volume fraction imaging with MRI. Neuroimage 2018;182:511-521.
11. Volz S, Noth U, Deichmann R. Correction of systematic errors in quantitative proton density mapping. Magn Reson Med 2012;68(1):74-85.
12. Mossahebi P, Yarnykh VL, Samsonov A. Analysis and correction of biases in cross-relaxation MRI due to biexponential longitudinal relaxation. Magn Reson Med 2014;71(2):830-838.
13. Yarnykh VL. Actual flip-angle imaging in the pulsed steady state: a method for rapid three-dimensional mapping of the transmitted radiofrequency field. Magn Reson Med 2007;57(1):192-200.
14. Neeb H, Ermer V, Stocker T, Shah NJ. Fast quantitative mapping of absolute water content with full brain coverage. Neuroimage 2008;42(3):1094-1109.
15. Likar B, Viergever MA, Pernus F. Retrospective correction of MR intensity inhomogeneity by information minimization. Ieee Transactions on Medical Imaging 2001;20(12):1398-1410.
16. Nguyen TD, Spincemaille P, Gauthier SA, Wang Y. Rapid whole brain myelin water content mapping without an external water standard at 1.5T. Magn Reson Imaging 2017;39:82-88.
17. Khodanovich MY, Kisel AA, Akulov AE, Atochin DN, Kudabaeva MS, Glazacheva VY, Svetlik MV, Medvednikova YA, Mustafina LR, Yarnykh VL. Quantitative assessment of demyelination in ischemic stroke in vivo using macromolecular proton fraction mapping. Journal of cerebral blood flow and metabolism, 2018;38(5):919-931.
Figures