0510
Unsupervised Deep Learning-based Magnetization Transfer Contrast (MTC) MR Fingerprinting and CEST MRI1Department of Electrical Engineeering, Korea Advanced Institute of Science and Technology, Daejeon, Korea, Republic of, 2Russell H Morgan Department of Radiology and Radiological Science, Johns Hopkin University, Baltimore, MD, United States, 3F.M. Kirby Research Center for Functional Brain Imaging, Kennedy Krieger Institute, Baltimore, MD, United States
Synopsis
Most currently used MTC/CEST imaging protocols depend on the acquisition of qualitative weighted images, limiting the detection sensitivity to quantitative parameters, their exchange rate and concentration. Here, we propose a fast, quantitative 3D MTC/CEST imaging framework based on a combined 1) time-interleaved parallel RF transmission, 2) compressed sensing, 3) MR fingerprinting, and 4) deep-learning techniques. Typically, supervised deep learning requires a massive amount of labeled images for training, which is limited particularly in MTC/CEST MRI field. However, the proposed unsupervised learning architecture requires only small amounts of unlabeled MTC/CEST data.
Introduction
Applications of conventional CEST have focused mostly on the use of MTR asymmetry (MTRasym) analysis1-2. However, CEST signals measured by MTRasym analysis are unavoidably contaminated by upfield nuclear Overhauser enhancement (NOE) and asymmetric MTC signals, thus limiting the assessment of pure CEST effects3-5. Therefore, accurate MTC quantification at a certain CEST frequency is essential in such a subtraction-based method. The most promising MTC quantification methods currently required fitting of MTC signals acquired from repeated and serial imaging acquisition with varied saturation powers and frequency offsets using the solution of the Bloch equation6-8. However, the fitting method is sometimes challenging to deploy in clinical practice due to the high computational cost and the difficulty of fitting parameter selection. In this study, we developed a fast, quantitative MTC/CEST imaging technique combined with 1) time-interleaved parallel RF transmission (pTX), 2) MR fingerprinting (MRF), 3) compressed sensing (CS), and 4) unsupervised deep-learning techniques. Typically, supervised deep learning requires a huge amount of labeled training data, which is impractical in MTC/CEST MRI field. Instead, we focused on fully-unsupervised learning from limited amounts of data without prior knowledge (label-free).Methods
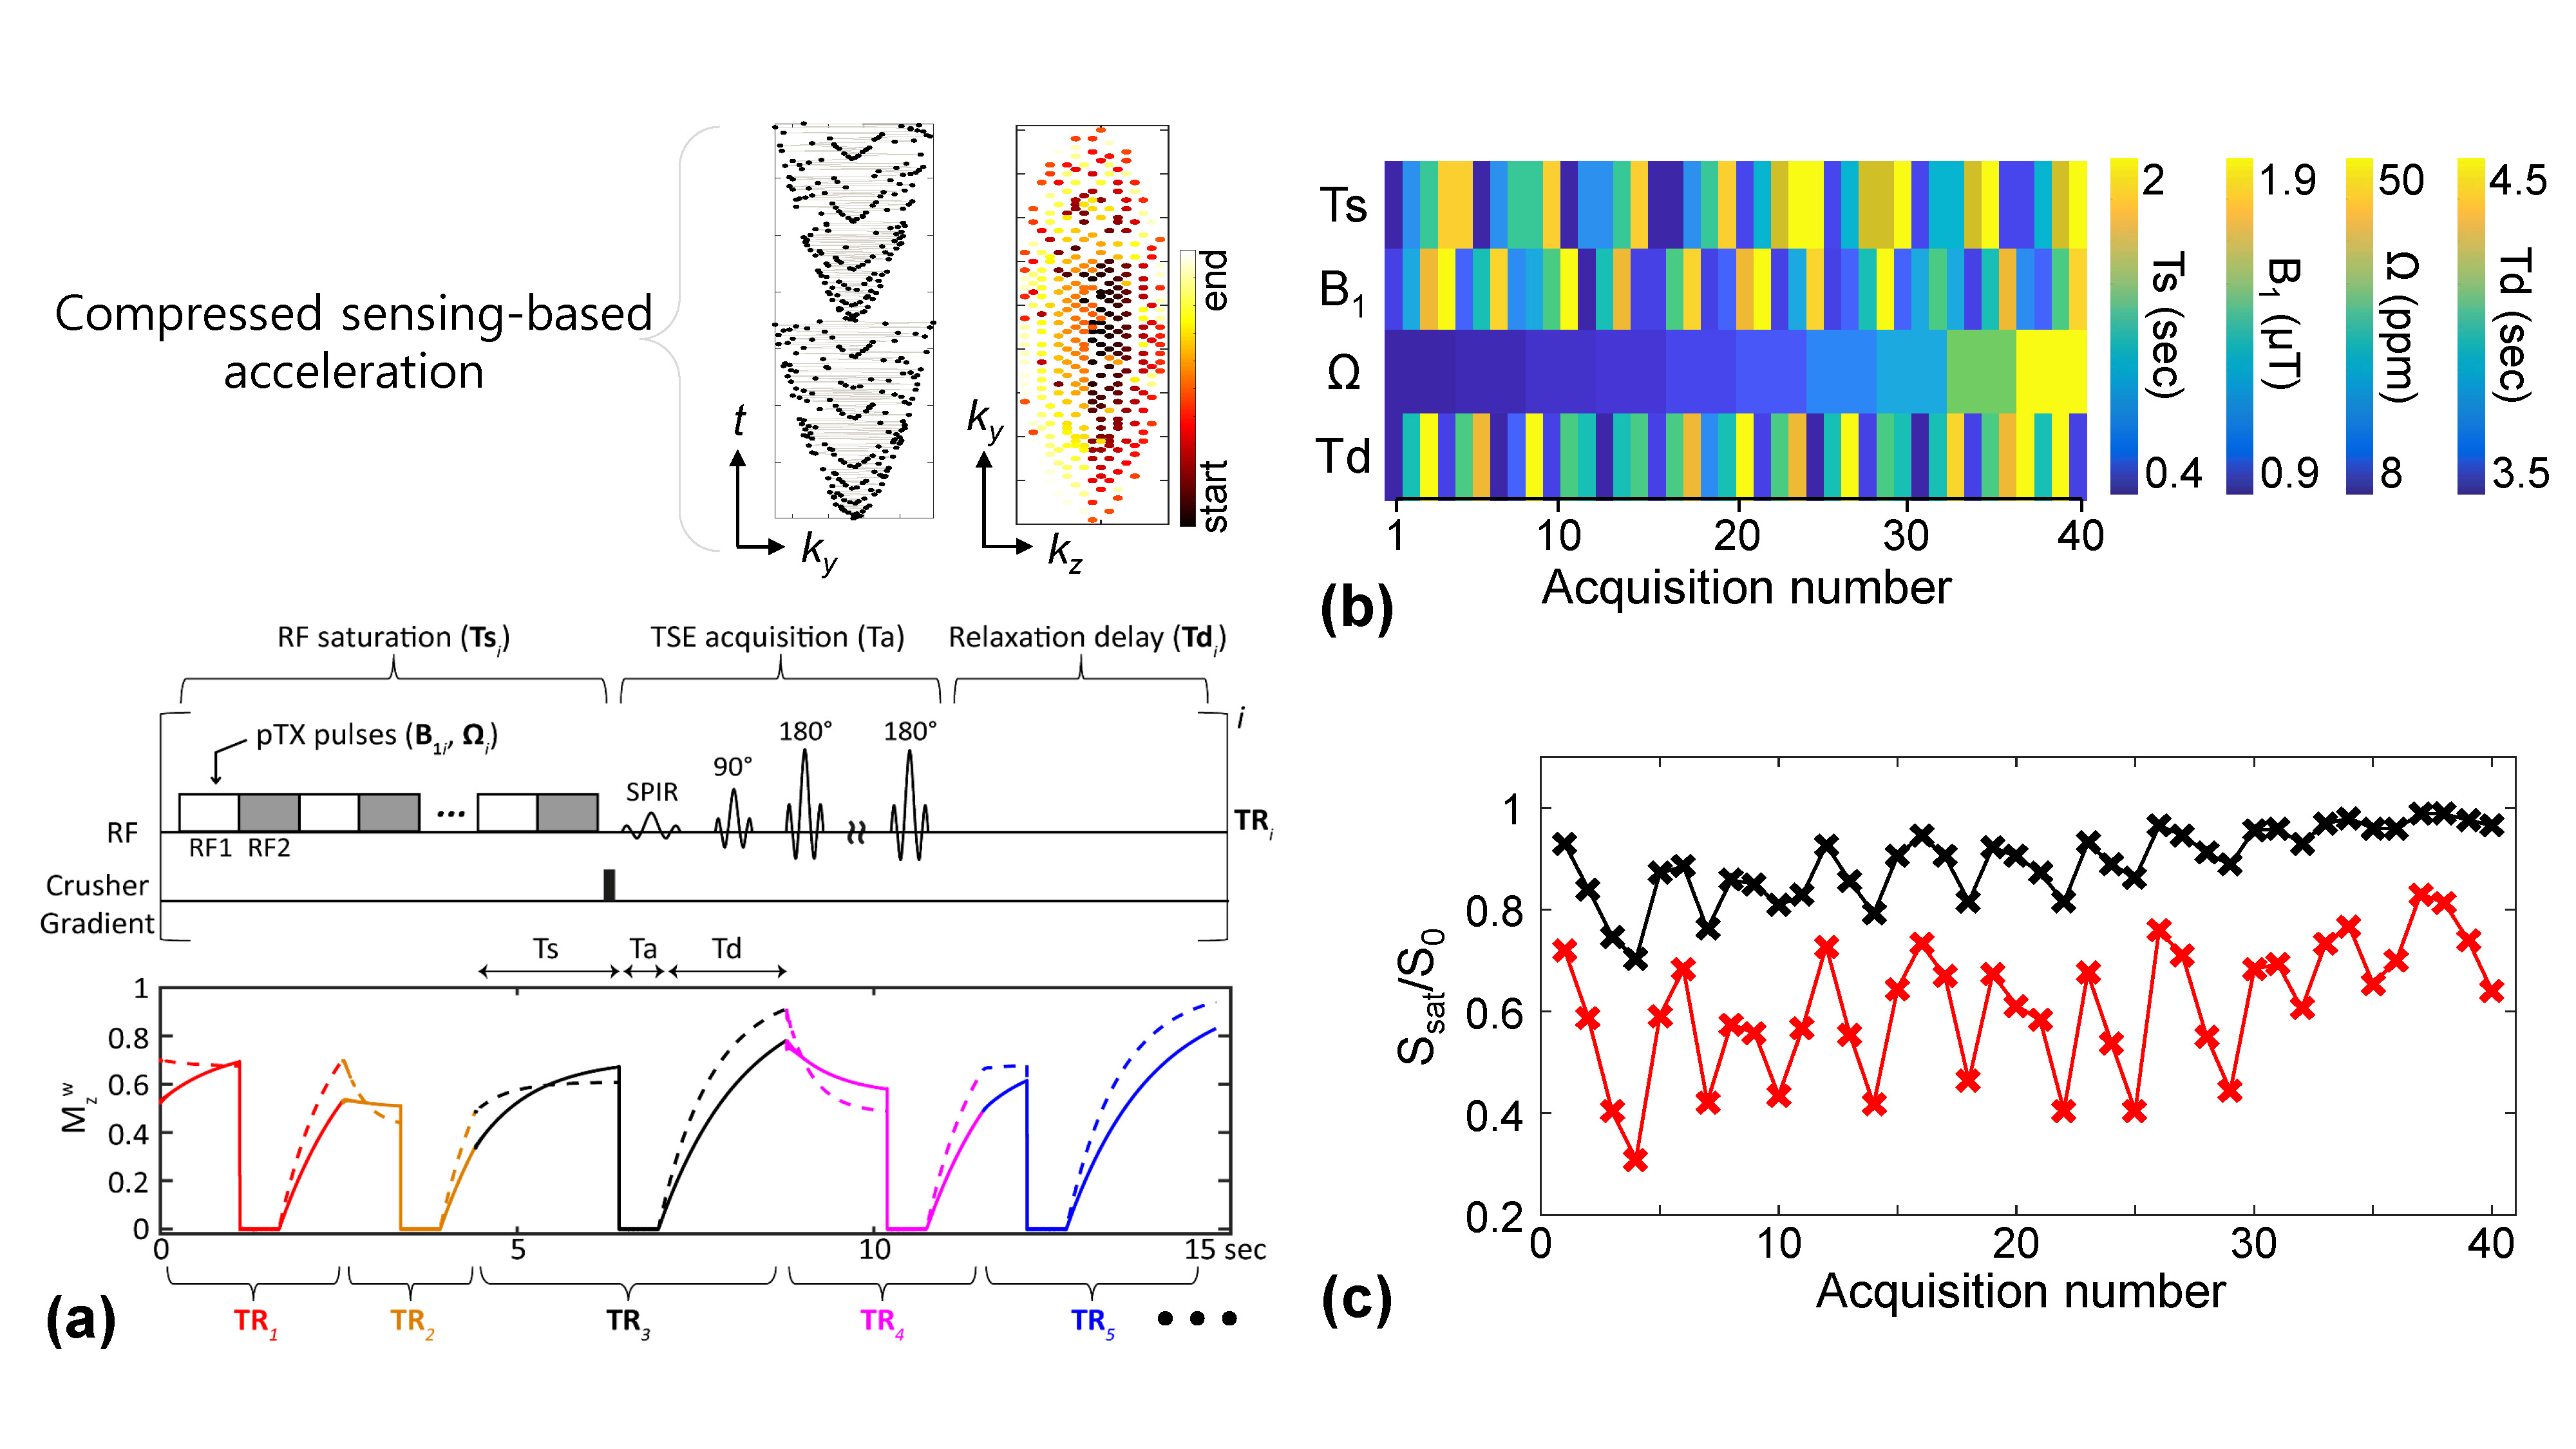
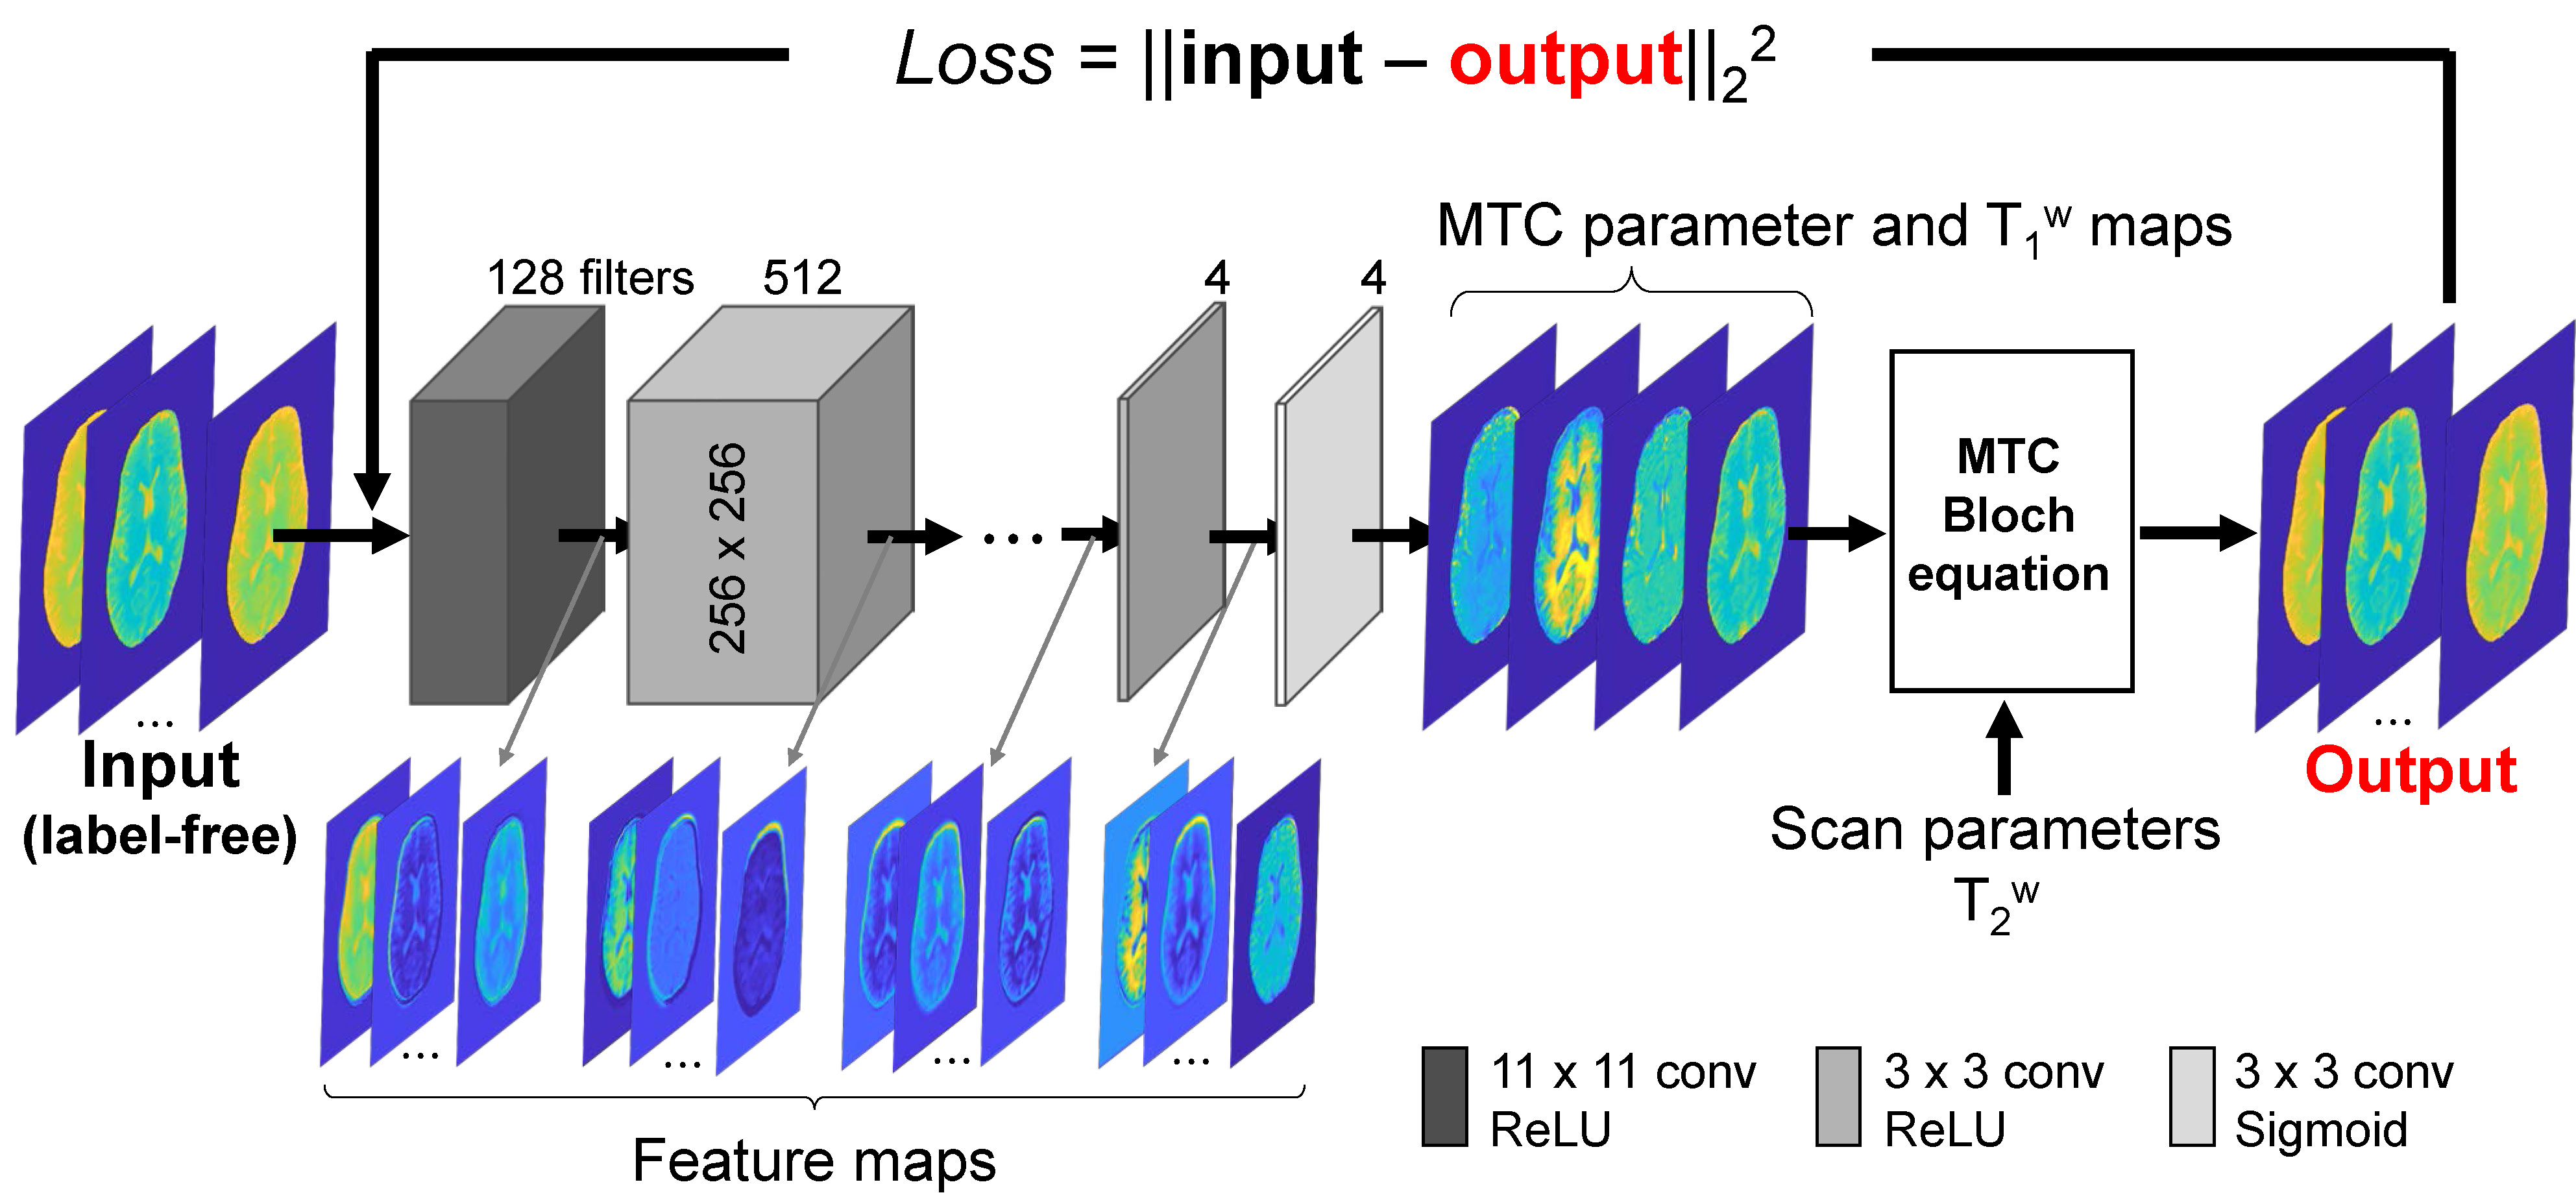
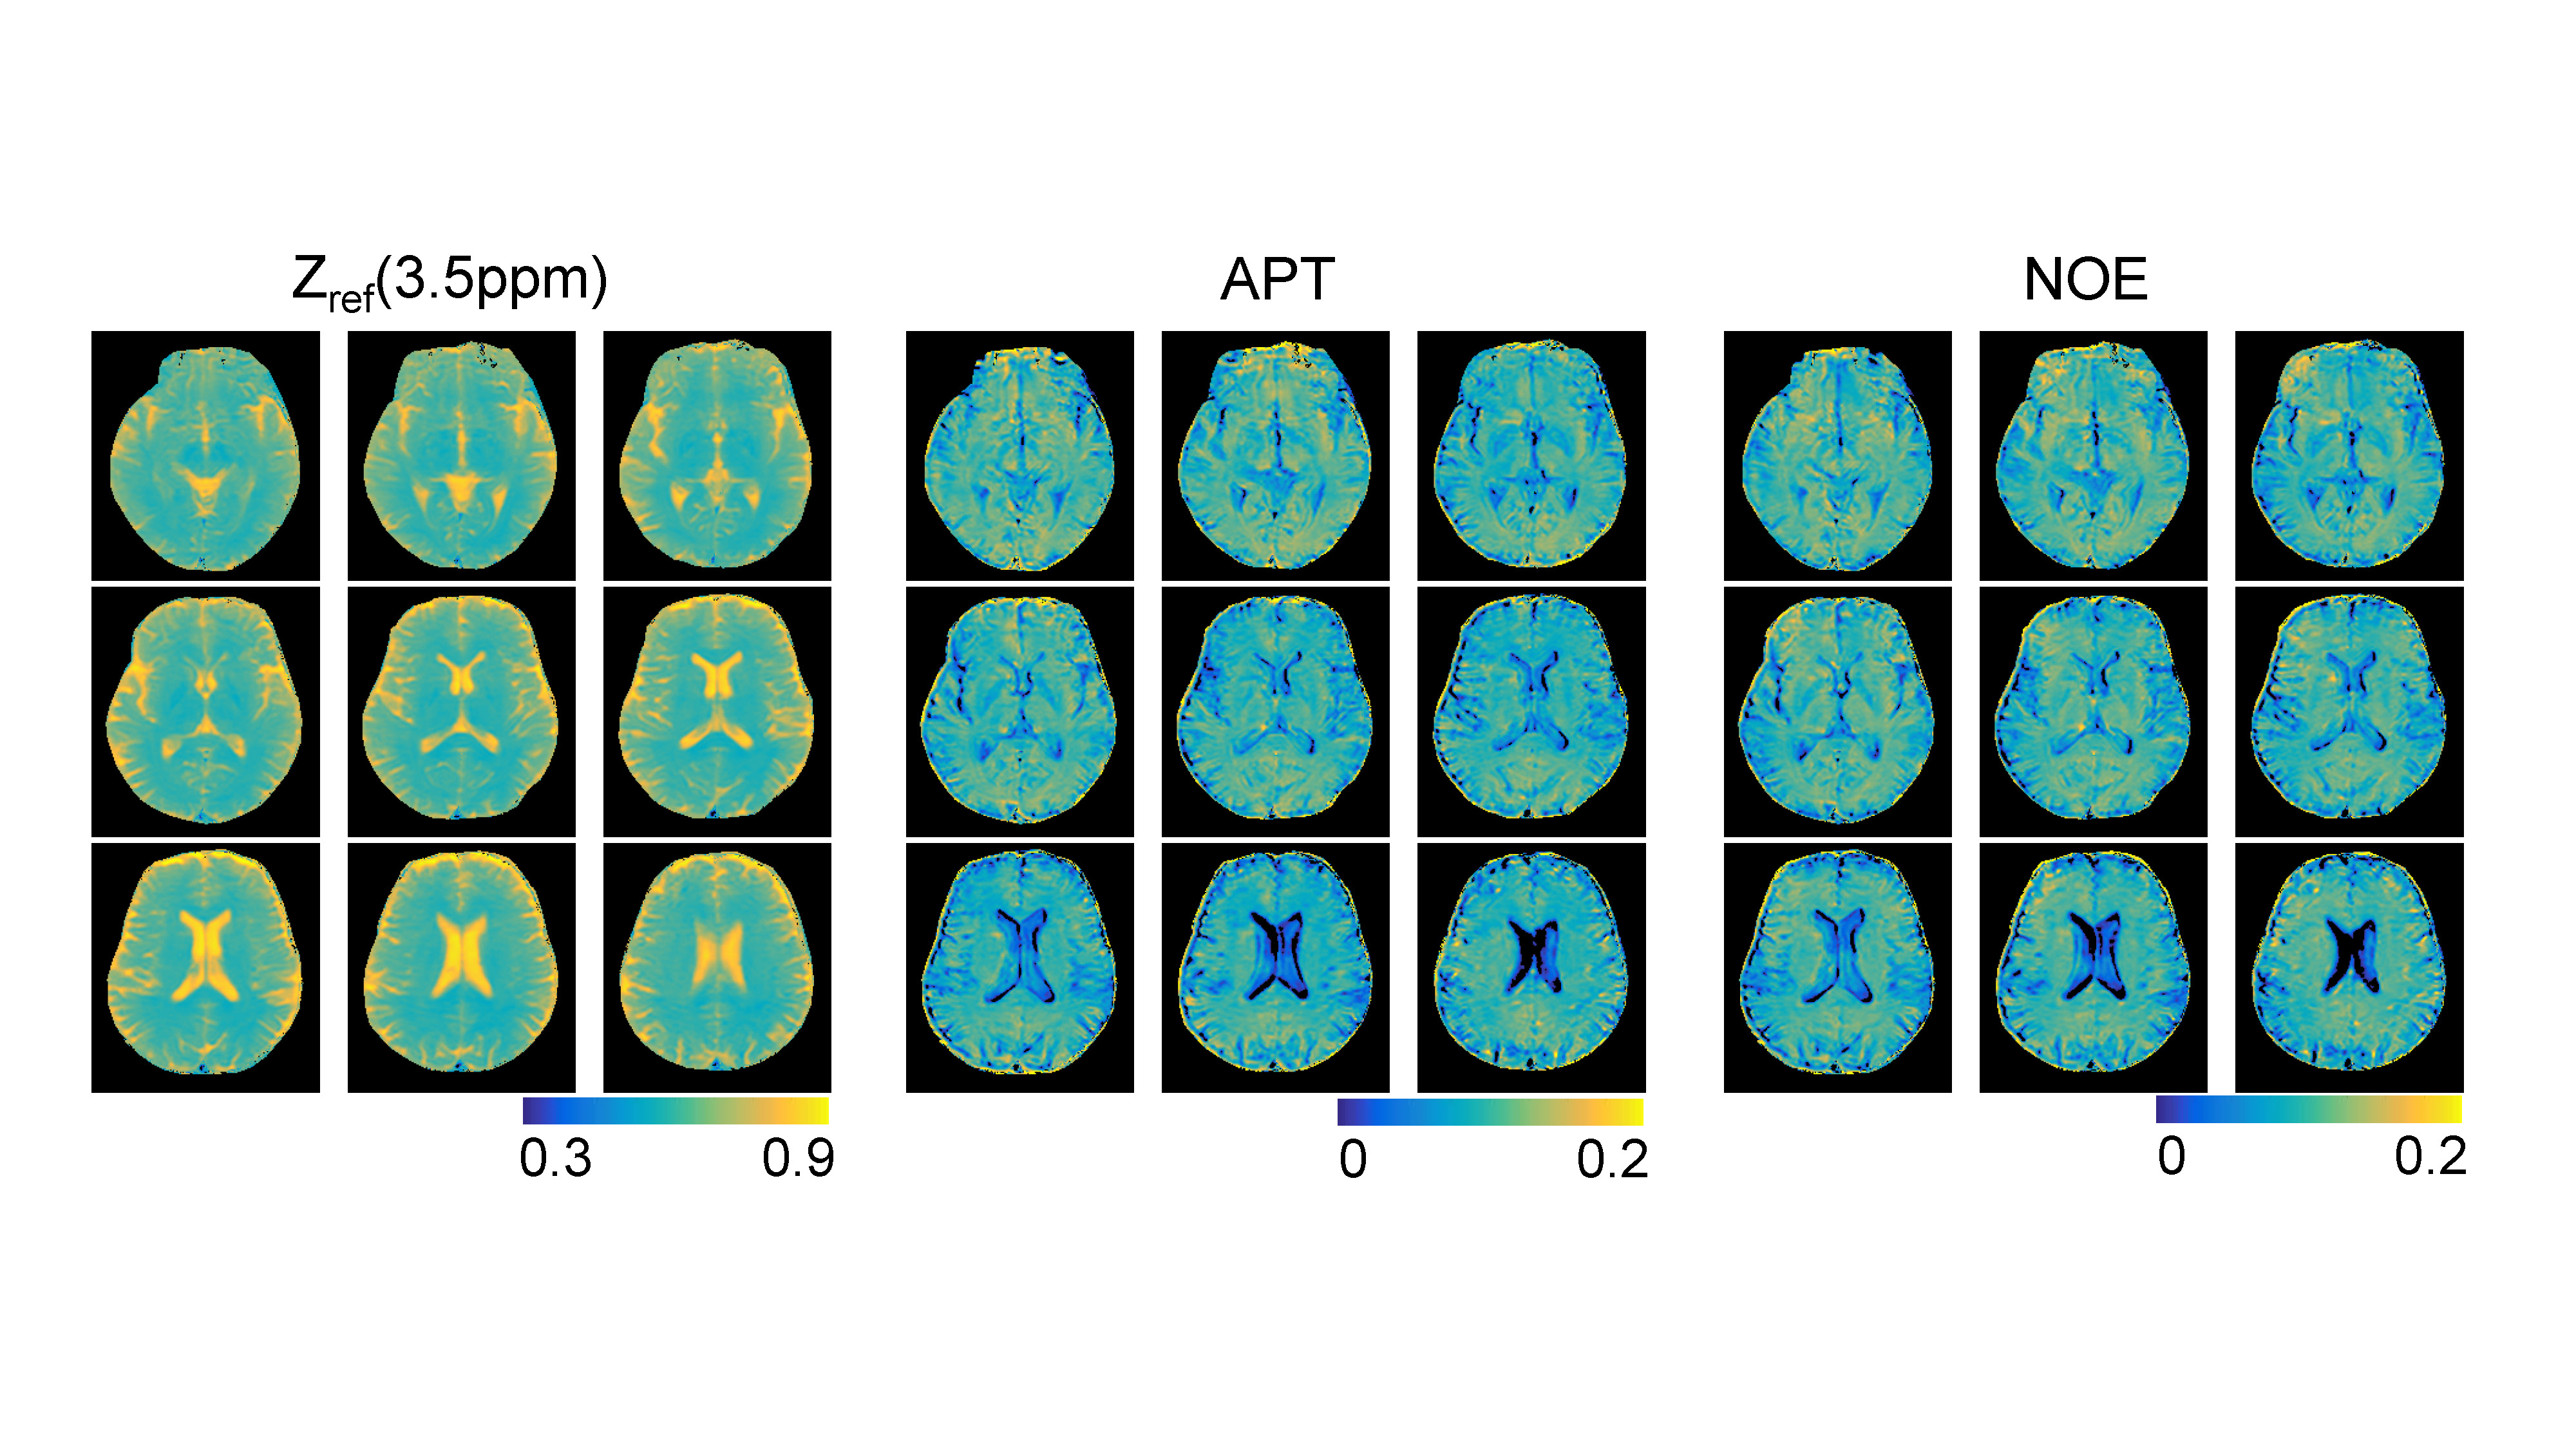
In the 3D MRF framework (Fig. 1), RF saturation times (Ts), powers (B1), frequency offsets (Ω), and relaxation delay times (Td) were pseudo-randomly applied throughout the acquisition9-11, generating unique MTC signal evolutions for different tissue properties. Continuous RF saturation (100% duty cycle) was achieved using the pTX technique, which can achieve highly sensitive saturation effects on clinical scanners and increase the degree of freedom for Ts. For CS acceleration (4-fold), the variable-density sampling with an elliptical centric k-space ordering pattern was used. For in-vivo studies, seven healthy volunteers (repeated three times on the same day) were scanned on a 3T MRI scanner after informed consent was obtained in accordance with the IRB requirement. In order to predict quantitative MTC parameters from MRF images, the unsupervised deep learning scheme was designed to train a convolutional neural network (CNN) architecture (Fig. 2). The label-free MTC-MRF images (‘Input’ in Fig. 2) were fed to the architecture, which outputs initial MTC (exchange rate: kmw, concentration: M0m, T2 relaxation: T2m) and water T1 (T1w) parameter maps. Next, MTC-MRF images (‘Output’ in Fig. 2) were synthetically generated by solving a two-pool Bloch equation using the initial MTC parameters, MRF scan information, and additionally acquired water T2 (T2w) map. The CNN weights were trained to extract features from the input images which predict MTC parameters by minimizing the mean square difference (loss function) between the original MTC-MRF and synthesized MTC-MRF images. Amide proton transfer (APT) and NOE images with RF saturation power of 1.2 μT were calculated by subtracting synthesized MTC images (Zref) from B0-corrected, experimentally measured images (Zlab) at ±3.5 ppm, respectively (Z = Ssat/S0, where Ssat and S0 are the signal intensities measured with and without RF saturation, respectively).Results and Discussion
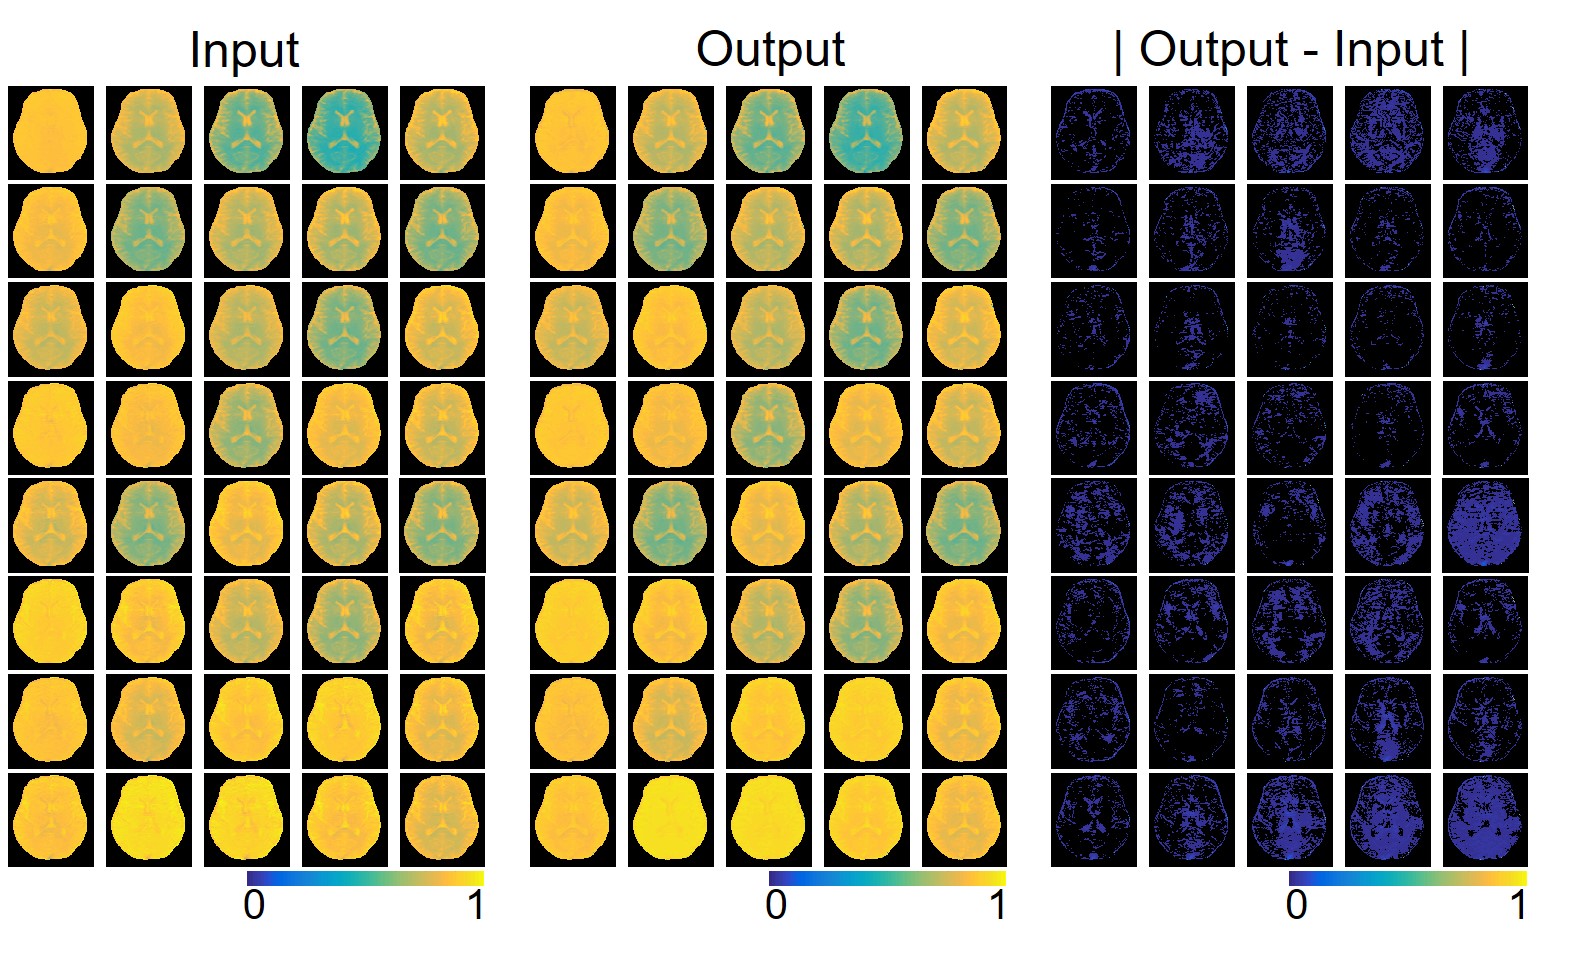
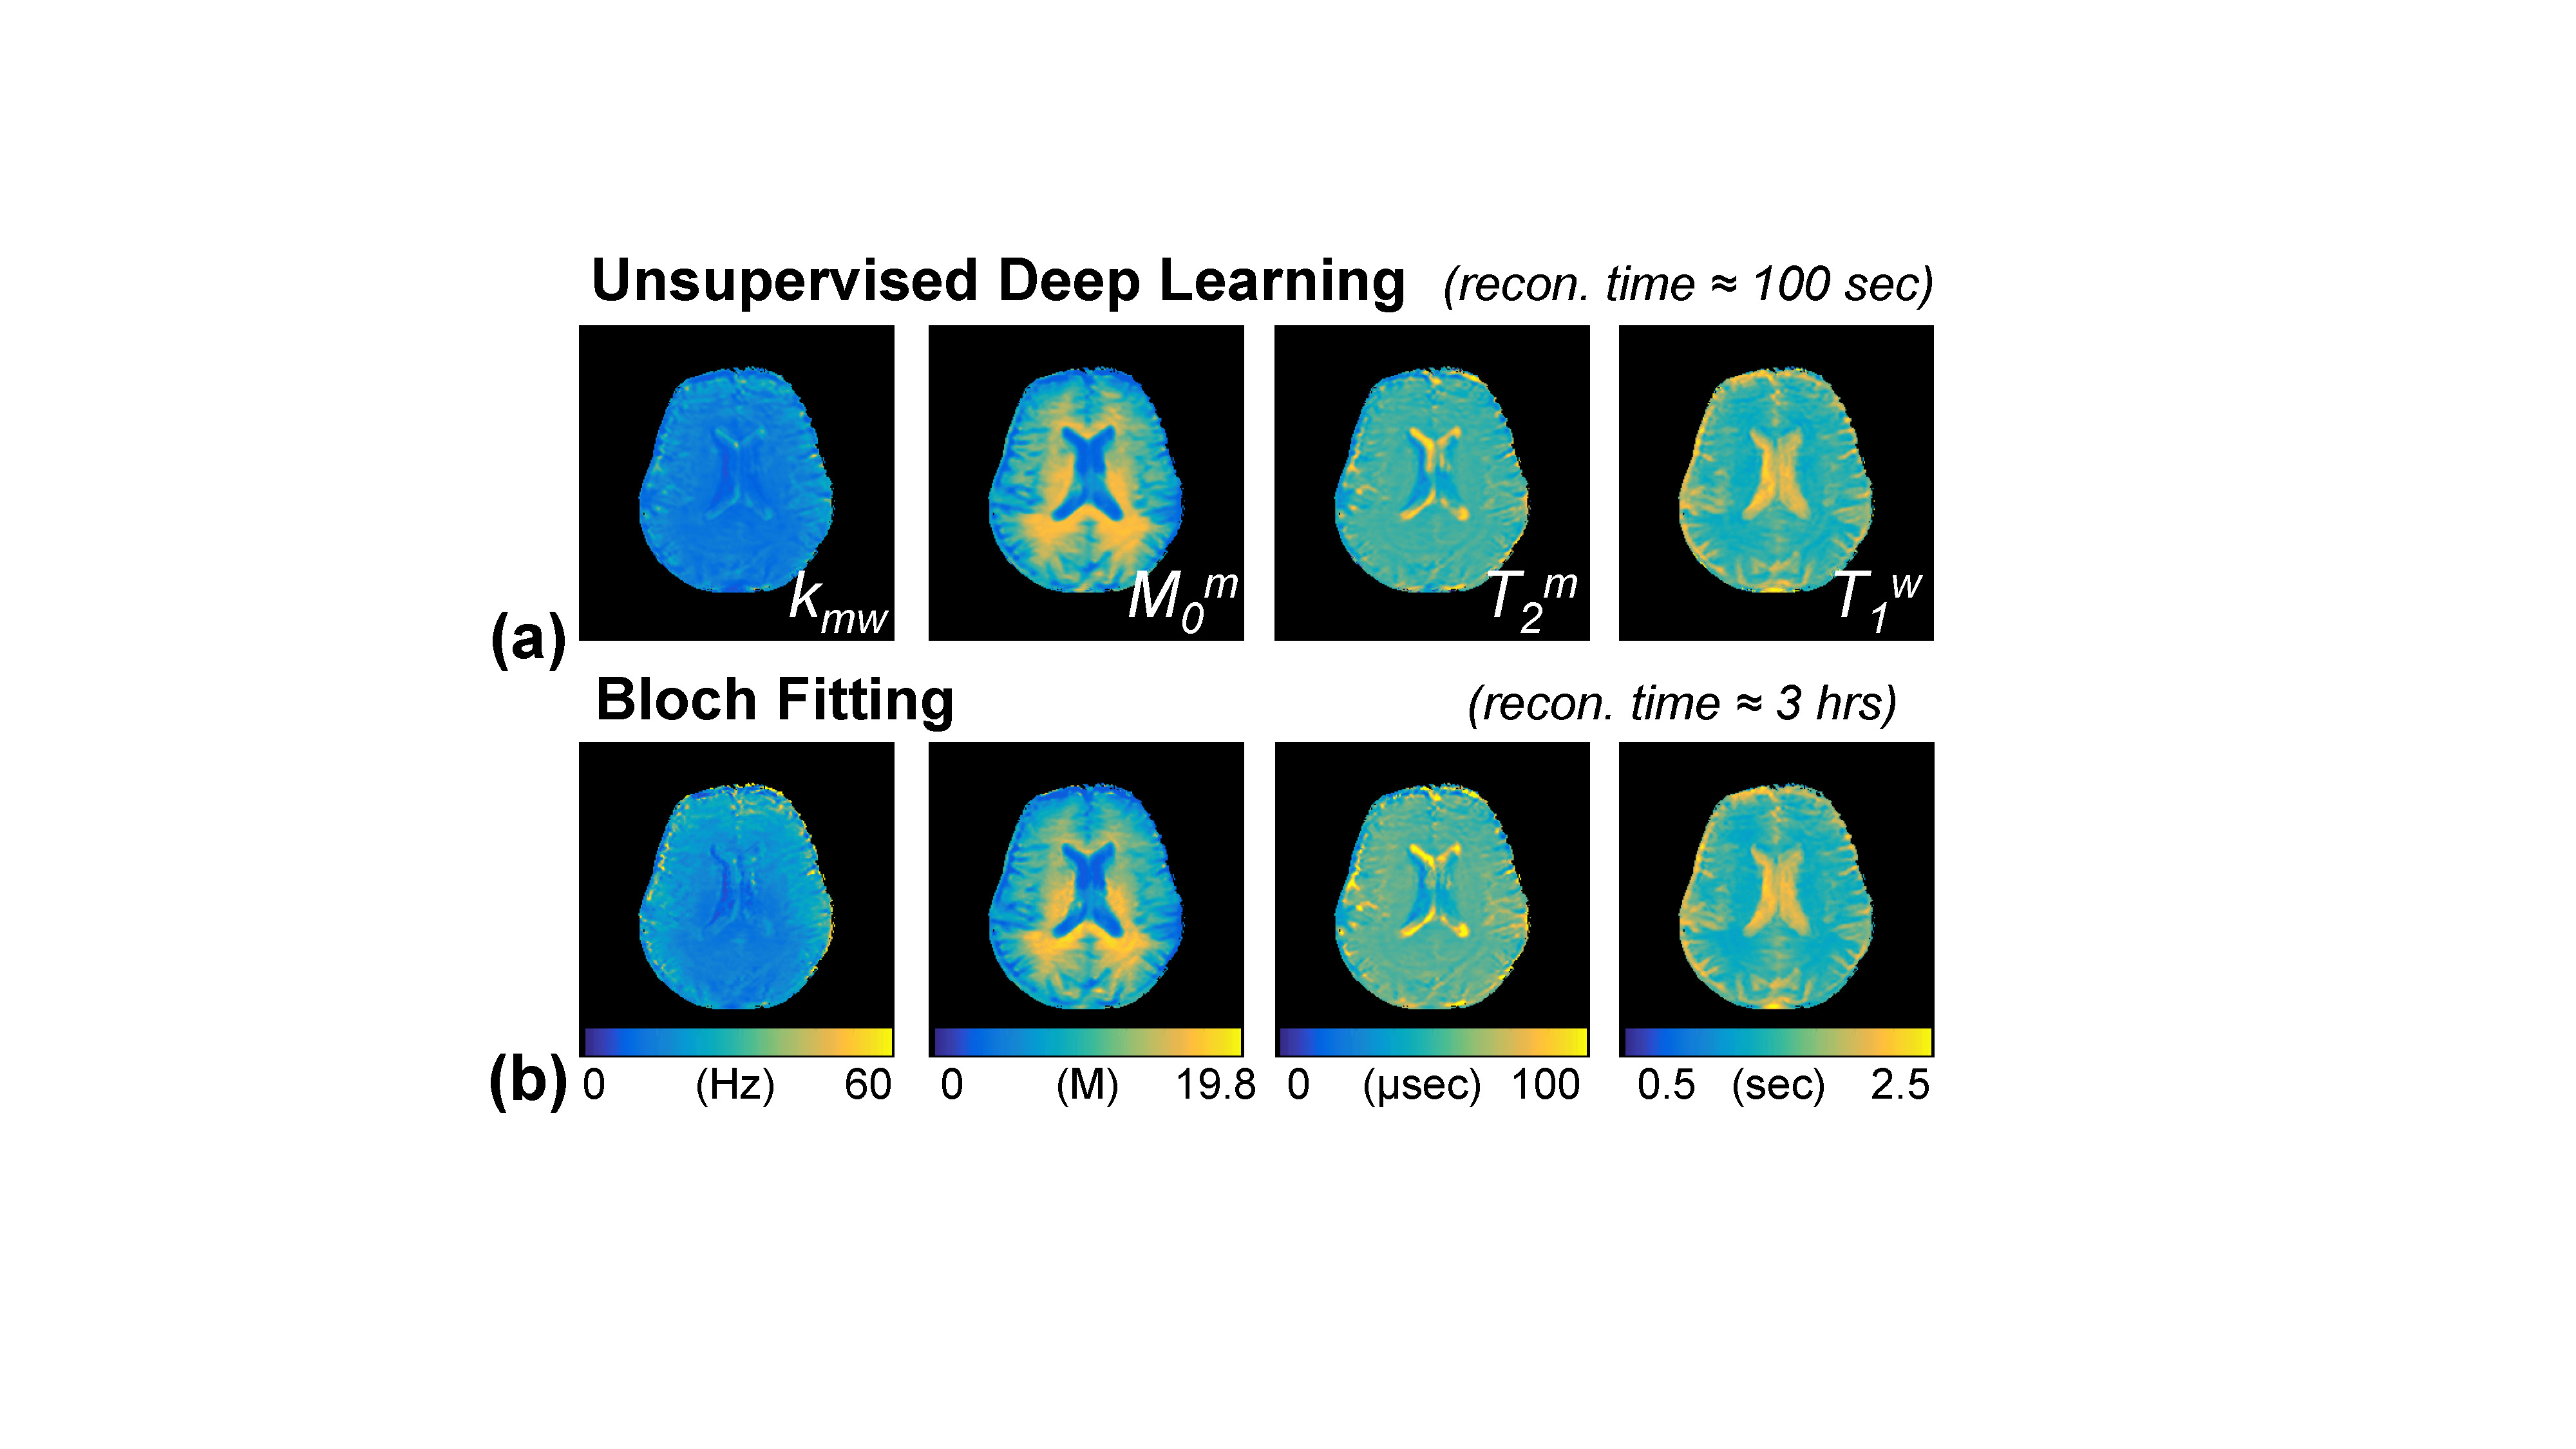
Excellent agreement was observed for the original (input) and synthesized MTC-MRF (output) images with 40 dynamic scans by the unsupervised deep learning as shown in Fig. 3. The average root-mean-square-error (RMSE) and structural similarity (SSIM) values were 0.026 and 0.985, respectively. The estimation of the MTC parameters satisfied all the 40 RF saturation conditions that would guarantee unique solution of the ill-posed inverse Bloch equation problem. Quantitative MTC parameter maps obtained from the unsupervised deep learning and conventional Bloch equation fitting methods are shown in Fig. 4 (center slice of a total of 9 image slices shown). The MTC parameter values estimated by unsupervised deep learning method were in excellent agreement with values estimated by using conventional Bloch fitting approach, but dramatically reduced computation time (100 sec vs. 3 hrs for 4D images: 256 x 256 x 9 x 40). In addition, the estimated parameters were in good agreement with previous observations6,7. Synthesized MTC at 3.5 ppm, downfield APT, and upfield NOE images are shown in Fig. 5. Broad signals from faster exchanging protons, such as amine and guanidinium protons, can make contributions at the APT frequency12-14. However, slower exchanging protons dominate at low B1 and faster ones dominate at high B1 because the saturation efficiency depends on the exchange rate. Therefore, slow-exchanging amide protons are the main contribution at 3.5 ppm under B1 of 1.2 μT.Conclusions
We developed a highly sensitive (via pTX), accelerated (via CS), and quantitative (via MRF and deep learning) 3D MTC imaging technique and applied to CEST and NOE imaging. The proposed deep learning architecture was designed to solve inverse problem of the MTC Bloch equation. While conventional CNN-based methods require massive labeled (for ground truth) datasets which are time-consuming and labor-intensive, the proposed unsupervised deep learning architecture incorporated with the Bloch equation-based model learns a set of unique feature that can describe the MTC-MRF input, and allows only small amounts of unlabeled data for learning. Given that the considerable time efficiency compared to conventional Bloch fitting, unsupervised deep learning-based MRF could be a powerful tool for quantitative MTC/CEST imaging.Acknowledgements
No acknowledgement found.References
1. Zhou J, Payen J, Wilson DA, Traystman RJ, van Zijl PCM. Using the amide proton signals of intracellular proteins and peptides to detect pH effects in MRI. Nature Med 2003;9:1085-1090.
2. Togao O, Yoshiura T, Keupp J, Hiwatashi A, Yamashita K, Kikuchi K, Suzuki Y, Suzuki SO, Iwaki T, Hata N, Mizoguchi M, Yoshimoto K, Sagiyama K, Takahashi M, Honda H. Amide proton transfer imaging of adult diffuse gliomas: correlation with histopathological grades. Neuro Oncol 2014;16:441-448.
3. Zaiss M, Xu J, Goerke S, Khan IS, Singer RJ, Gore JC, Gochberg DF, Bachert P. Inverse Z-spectrum analysis for spillover-, MT-, and T1 -corrected steady-state pulsed CEST-MRI - application to pH-weighted MRI of acute stroke. NMR Biomed 2014;27:240-252.
4. van Zijl, P.C.M., Yadav, N.N., 2011. Chemical exchange saturation transfer (CEST): What is in a name and what isn't? Magn. Reson. Med. 65, 927-948.
5. Xu, J., Zaiss, M., Zu, Z., Li, H., Xie, J., Gochberg, D.F., Bachert, P., Gore, J.C., 2014. On the origins of chemical exchange saturation transfer (CEST) contrast in tumors at 9.4 T. NMR Biomed 27, 406-416.
6. Sled, J.G., Pike, G.B., 2001. Quantitative imaging of magnetization transfer exchange and relaxation properties in vivo using MRI. Magn. Reson. Med. 46, 923-931.
7. Stanisz, G.J., Odrobina, E.E., Pun, J., Escaravage, M., Graham, S.J., Bronskill, M.J., Henkelman, R.M., 2005. T-1, T-2 relaxation and magnetization transfer in tissue at 3T. Magn. Reson. Med. 54, 507-512.
8. Henkelman, R.M., Huang, X., Xiang, Q.S., Stanisz, G.J., Swanson, S.D., Bronskill, M.J., 1993. Quantitative interpretation of magnetization transfer. Magn Reson Med 29, 759-766.
9. Ma, D., Gulani, V., Seiberlich, N., Liu, K., Sunshine, J.L., Duerk, J.L., Griswold, M.A., 2013. Magnetic resonance fingerprinting. Nature 495, 187-192.
10. Cohen O, Huang S, McMahon MT, Rosen MS, Farrar CT. Rapid and quantitative chemical exchange saturation transfer (CEST) imaging with magnetic resonance fingerprinting (MRF). Magn Reson Med 2018;80:2449-2463.
11. Heo HY, Han Z, Jiang S, Schar M, van Zijl PCM, Zhou J. Quantifying amide proton exchange rate and concentration in chemical exchange saturation transfer imaging of the human brain. Neuroimage 2019;189:202-213.
12. Haris M, Nanga RPR, Singh A, Cai K, Kogan F, Hariharan H, Reddy R. Exchange rates of creatine kinase metabolites: feasibility of imaging creatine by chemical exchange saturation transfer MRI. NMR Biomed 2012;25:1305-1309.
13. Cai KJ, Haris M, Singh A, Kogan F, Greenberg JH, Hariharan H, Detre JA, Reddy R. Magnetic resonance imaging of glutamate. Nat Med 2012;18:302-306.
14. Zhang XY, Wang F, Li H, Xu J, Gochberg DF, Gore JC, Zu Z. Accuracy in the quantification of chemical exchange saturation transfer (CEST) and relayed nuclear Overhauser enhancement (rNOE) saturation transfer effects. NMR Biomed 2017;30:e3716.
Figures