0507
Tailored spectral-spatial saturation pulses for spatially uniform saturation in CEST imaging1Biomedical Engineering, Vanderbilt University, Nashville, TN, United States, 2Department of Bioengineering, University of California Berkeley, Berkeley, CA, United States, 3Radiology and Radiological Sciences, Vanderbilt University, Nashville, TN, United States
Synopsis
A tailored spectral-spatial saturation pulse was developed to produce a flat flip angle profile across the heart and achieve more uniform CEST saturation despite B1 inhomogeneity at 3 Tesla. The tailored saturation pulse train was simulated for a two-pool system to evaluate the z-spectrum at each spatial location in the heart, based on an in vivo 3 Tesla B1 map. Whereas CEST saturation generated with a conventional Gaussian pulse yielded CEST contrast of 2.60±1.59% across the ventricle, the tailored pulse produced more uniform saturation across the heart which resulted in both greater and more uniform CEST contrast of 4.64±0.34%.
Introduction
Chemical exchange saturation transfer (CEST) imaging [1] enables in vivo detection of intracellular metabolites. While compensation for B0 inhomogeneity is routine, CEST contrast is highly sensitive to B1 variations ([2]; see also abstract #5033) for which compensatory approaches are only recently emerging. Parallel transmit methods have been developed but require specialized hardware, while post-processing corrections [3,4] require steady saturation conditions and knowledge of chemical pool parameters, and their efficacy depends on the specific saturation and imaging parameters. Here we propose a new approach, which is to use a tailored spectral-spatial pulse to produce a flat flip angle profile in the presence of B1 inhomogeneity for more uniform saturation in the heart at 3T.Methods
RF Pulse Design: Figure 1 illustrates the tailored spectral-spatial pulse construction. The pulse comprises a train of identical spatially-selective subpulses played during trapezoidal gradients. The subpulse is designed by solving:$$\hat{\textbf{b}} = argmin_{\textbf{b}}{\|1-\textbf{Ab}\|_2+\lambda\|\textbf{b}\|_2}$$
where $$$\textbf{b}$$$ contains samples of the subpulse and $$$\textbf{A}$$$ is a system matrix of size $$$N_s\times N_t$$$, $$$ a_{ij}= S(\overrightarrow{x_i})e^{i\overrightarrow{x_i}\cdot\overrightarrow{k}(t_j)}$$$, Ns is the number of spatial locations, Nt is the number of time points, $$$S(\overrightarrow{x_i})$$$ is the measured B1 amplitude at spatial location $$$\overrightarrow{x_i}$$$, $$$\overrightarrow{k}(t_j)$$$ is the excitation k-space trajectory traced out by the trapezoid gradient waveform, and $$$\lambda\|\textbf{b}\|_2$$$is a Tikhonov regularization term. The gradient direction is also optimized, and the subpulse duration is determined by spectral sampling requirements. Once the subpulse is designed, it is duplicated and weighted by a Gaussian or other spectral envelope.
Given a measured 3T cardiac B1 map, an RF subpulse was computed with the following parameters: maximum duration = 250μs, maximum magnitude = 4G/cm, maximum slew rate = 14000G/cm/s, dwell time(dt) = 4µs, gx = 0.22G/cm and gy= 0.39G/cm. The subpulse was duplicated 145 times for a total pulse duration of 36ms. For comparison, a conventional 36 ms Gaussian pulse was also simulated. The pulses were scaled to a flip angle of 208°. The B1 map was measured in vivo on a Siemens 3T scanner using a Turbo FLASH sequence proceeded by a 50° saturation pulse. Other B1 mapping parameters were field of view (FOV) = 24.3×30cm2, matrix = 156×192, slice thickness = 8mm, TE = 2.12ms, TR = 3.07s.
Numerical Simulations: Z-spectra were calculated by solving the Bloch-McConnell equations [5] using the ode45 function in MATLAB, for a two-pool model with a bulk water pool (Pool a) and a myocardial creatine pool (Pool b). The simulation parameters were: B0 = 3T, T1a = 2s , T2a =120ms, Δωa=0 ppm, T1b =1.4s , T2b =50ms , Kba = 200Hz, Δωb=1.8ppm and pool size ratio (b/a) fb = 0.0018. Both pulses were repeated 25 times for saturation in the simulations, and the interpulse time delay was 21ms.
Results
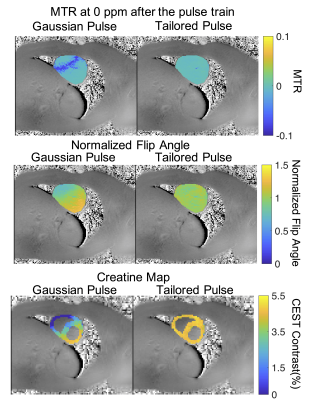
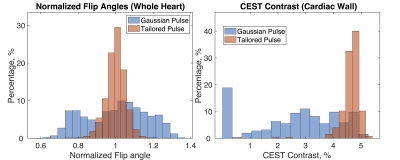
Figure 2 plots Z-spectra and MTRasym curves for two voxels at opposite edges of the heart, where Voxel 1 (orange arrow in Fig. 2a) has lower B1 than prescribed, and Voxel 2 (blue arrow) experiences B1 consistent with the prescribed flip angle. The effect of B1 inhomogeneity with conventional Gaussian saturation manifests as reduced creatine CEST contrast and reduced full width half max of water saturation at Voxel 1 (Fig 2b) compared to Voxel 2 (Fig 2c). However, use of a tailored pulse train at Voxel 1 (Fig 2b) restores equal CEST saturation to that observed at Voxel 2 (Fig 2c), resulting in identical creatine CEST contrast.The first row of Figure 3 shows that the tailored pulse train produces more uniform saturation at 0ppm across the heart: MTR = -0.0015±0.0036 (tailored) versus MTR = -0.0193±0.0247 (Gaussian). The second row shows normalized flip angle maps that demonstrate substantially enhanced spatial uniformity for the tailored pulse: the flip angle coefficients of variation were 0.05 (tailored) and 0.16 (Gaussian). The third row shows CEST contrast maps (%) of cardiac wall for each pulse. The CEST contrasts in the cardiac wall were 2.60±1.59% and 4.64±0.34% for the Gaussian and tailored pulses, respectively. Figure 4 shows normalized flip angle and CEST contrast histograms that illustrate the tighter distributions achieved with tailored saturation.
Discussion and Conclusion
In this work, we have designed and demonstrated a tailored spectral-spatial RF pulse with gradients which achieves a uniform saturation in the heart despite B1 inhomogeneity, compared with a conventional Gaussian pulse. In this preliminary study, the tailored and Gaussian pulses were brought into a two-pool Bloch-McConnell model and the results showed the advantage of the tailored pulse. Future work will include an in vivo experiment and further multi-pool simulations fully validate the tailored pulses.In conclusion, a tailored spectral-spatial RF pulse solved from a subject-specific B1 map may lead to more uniform saturation in CEST imaging.
Acknowledgements
This work was supported by NIH grants R21 EB 024311, R01 EB 016695, R01 HL128592, and UH2 EB028908.References
[1] Ward, K. M., A. H. Aletras, and Robert S. Balaban. "A new class of contrast agents for MRI based on proton chemical exchange dependent saturation transfer (CEST)." Journal of magnetic resonance 143.1 (2000): 79-87.
[2] Windschuh, Johannes, et al. "Correction of B1‐inhomogeneities for relaxation‐compensated CEST imaging at 7 T." NMR in biomedicine 28.5 (2015): 529-537.
[3] Sun, Phillip Zhe, Christian T. Farrar, and A. Gregory Sorensen. "Correction for artifacts induced by B0 and B1 field inhomogeneities in pH‐sensitive chemical exchange saturation transfer (CEST) imaging." Magnetic Resonance in Medicine: An Official Journal of the International Society for Magnetic Resonance in Medicine 58.6 (2007): 1207-1215.
[4] Singh, Anup, et al. "On B1 inhomogeneity correction of in vivo human brain glutamate chemical exchange saturation transfer contrast at 7T." Magnetic resonance in medicine 69.3 (2013): 818-824.
[5] Roeloffs, Volkert, et al. "Towards quantification of pulsed spinlock and CEST at clinical MR scanners: an analytical interleaved saturation–relaxation (ISAR) approach." NMR in Biomedicine 28.1 (2015): 40-53.
Figures


