0505
Unveiling the fate of glycolytic substrates using multi-spectral CEST: proof of concept with 2DG in the rat brain1Molecular Imaging Research Center (MIRCen), Commissariat à l’Energie Atomique et aux Energies Alternatives (CEA), Fontenay-aux-Roses, France, 2UMR 9199, Neurodegenerative Diseases Laboratory, Centre National de la Recherche Scientifique (CNRS), Université Paris-Sud, Université Paris-Saclay, Fontenay-aux-Roses, France
Synopsis
2-Deoxy-D-glucose (2DG), an analogue of glucose similarly transported but with metabolism blocked after the first phosphorylation into 2DG-6-phosphate (2DG6P), has already been used to study glycolytic metabolism using gluCEST. However, origin of glucoCEST signal is still an open question important to be addressed. In this study, we measured for the first time variations of CEST signal in the rat brain at different resonance frequencies following 2DG injection. The richness of CEST signal can help assessing the fate of glycolytic substrates and would constitute a first step toward quantitative measurement of glucose metabolism using CEST method.
Introduction
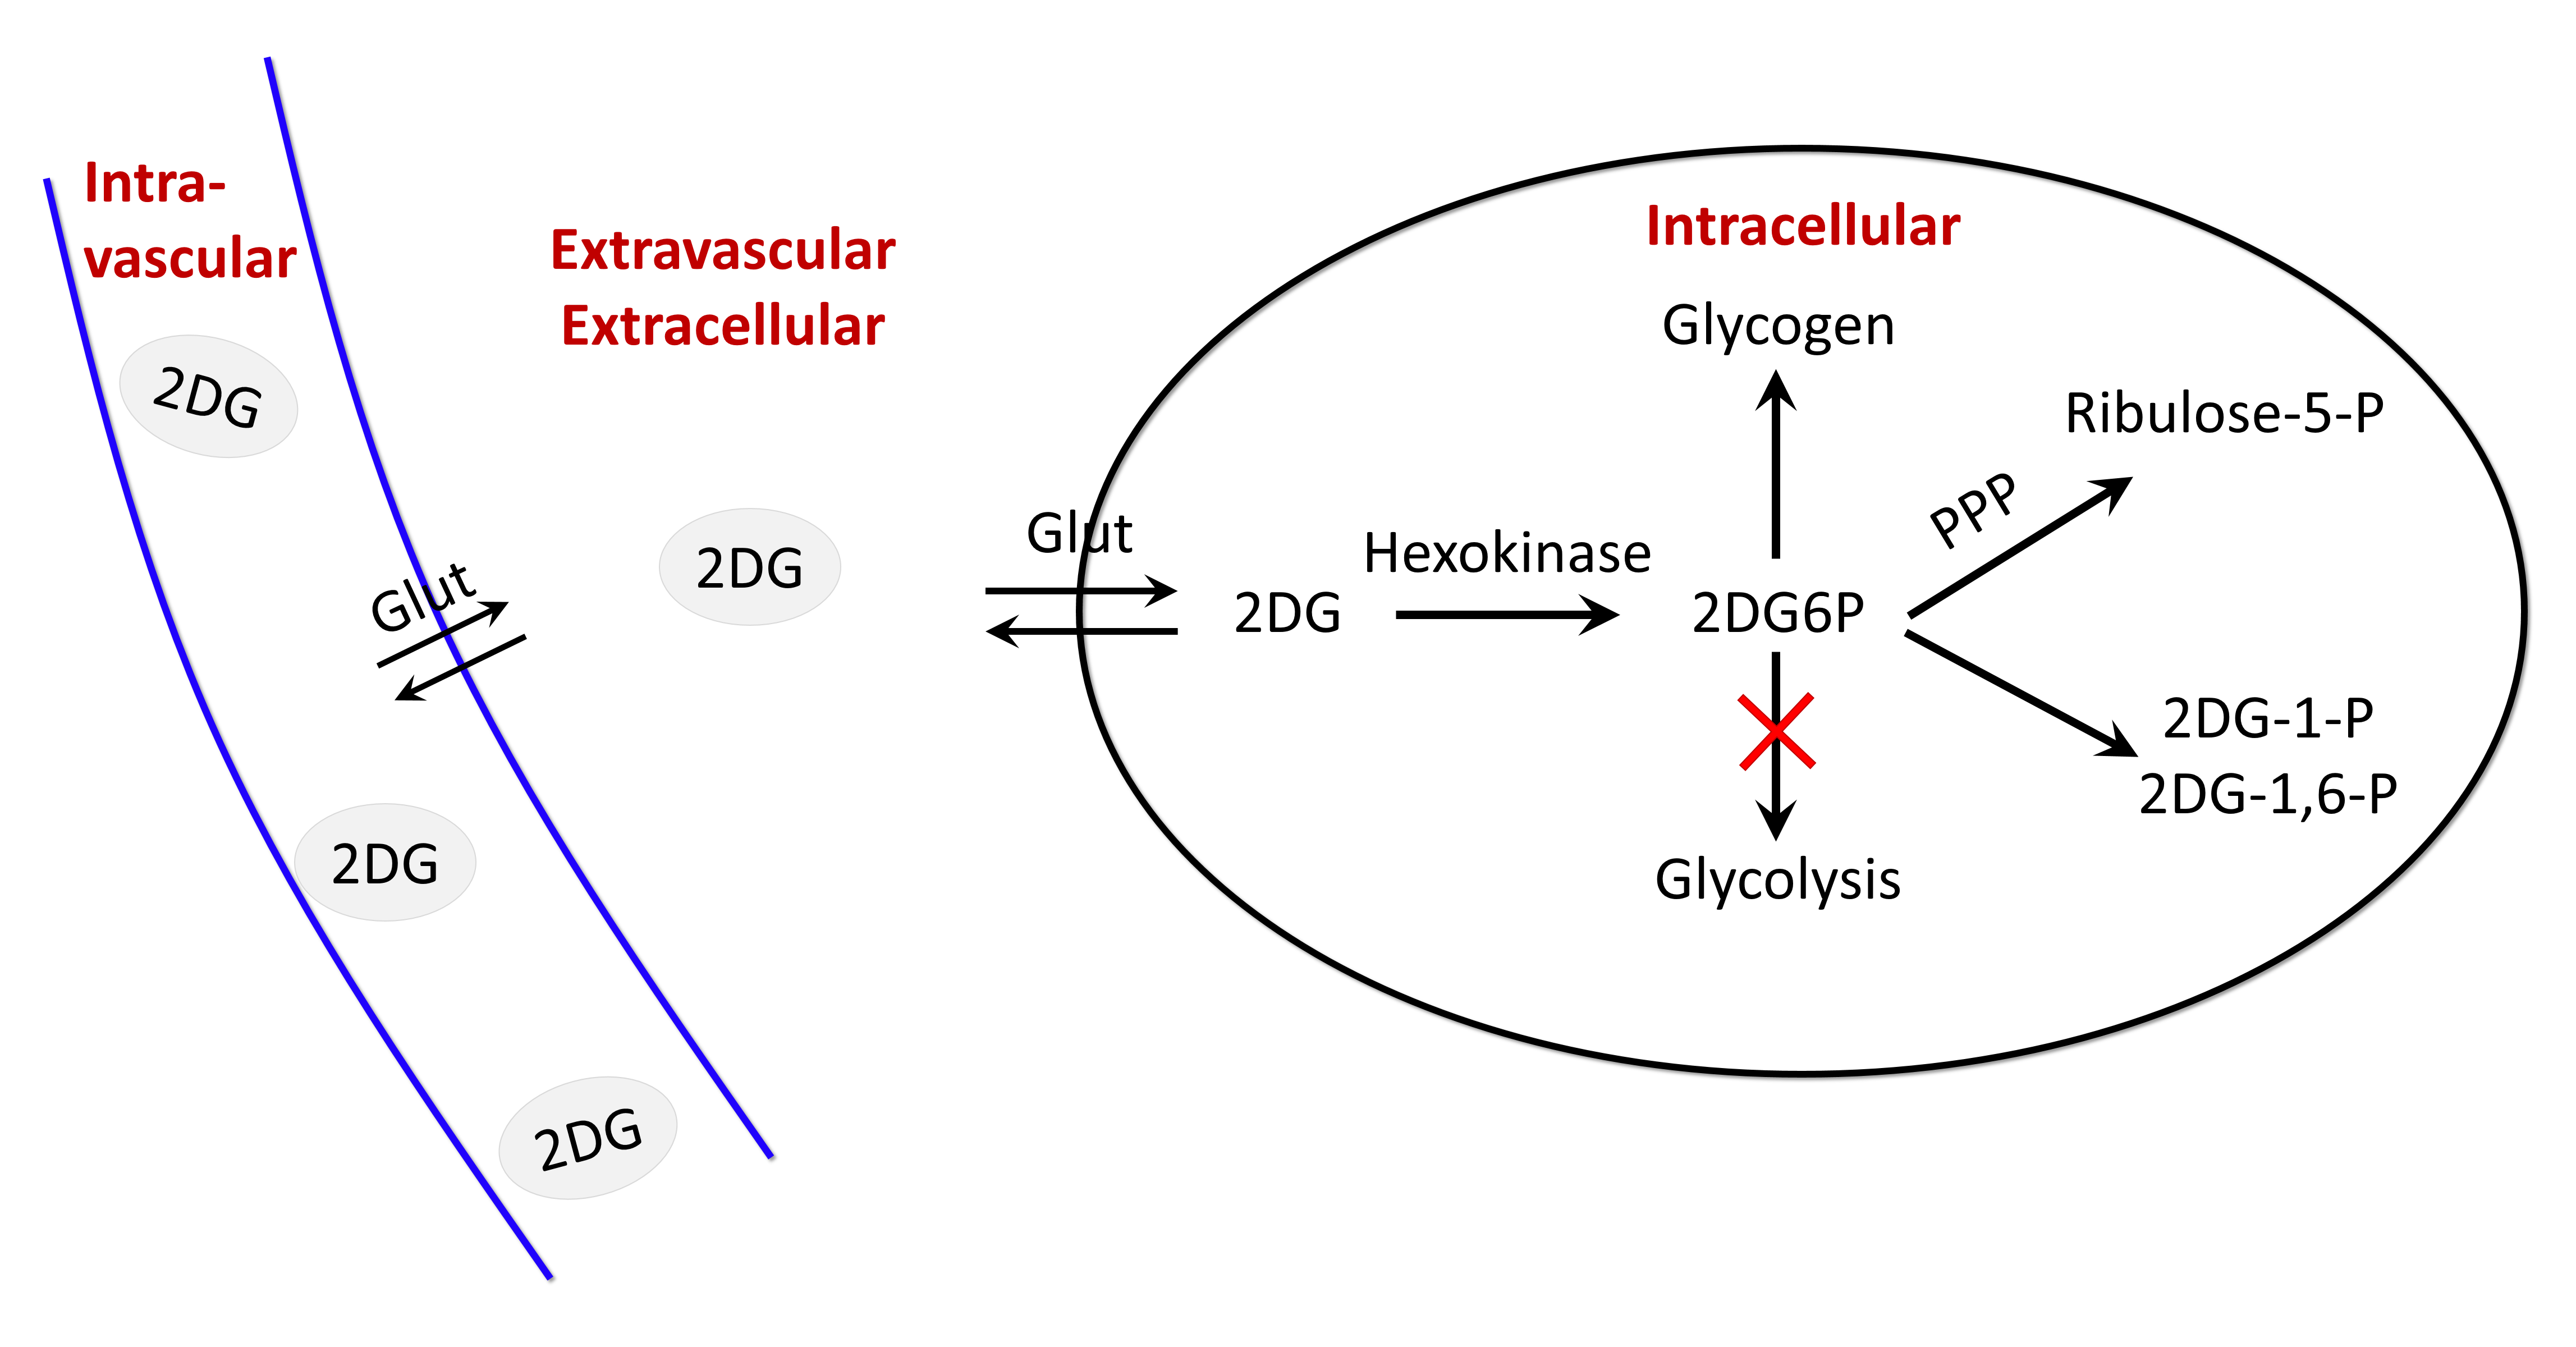
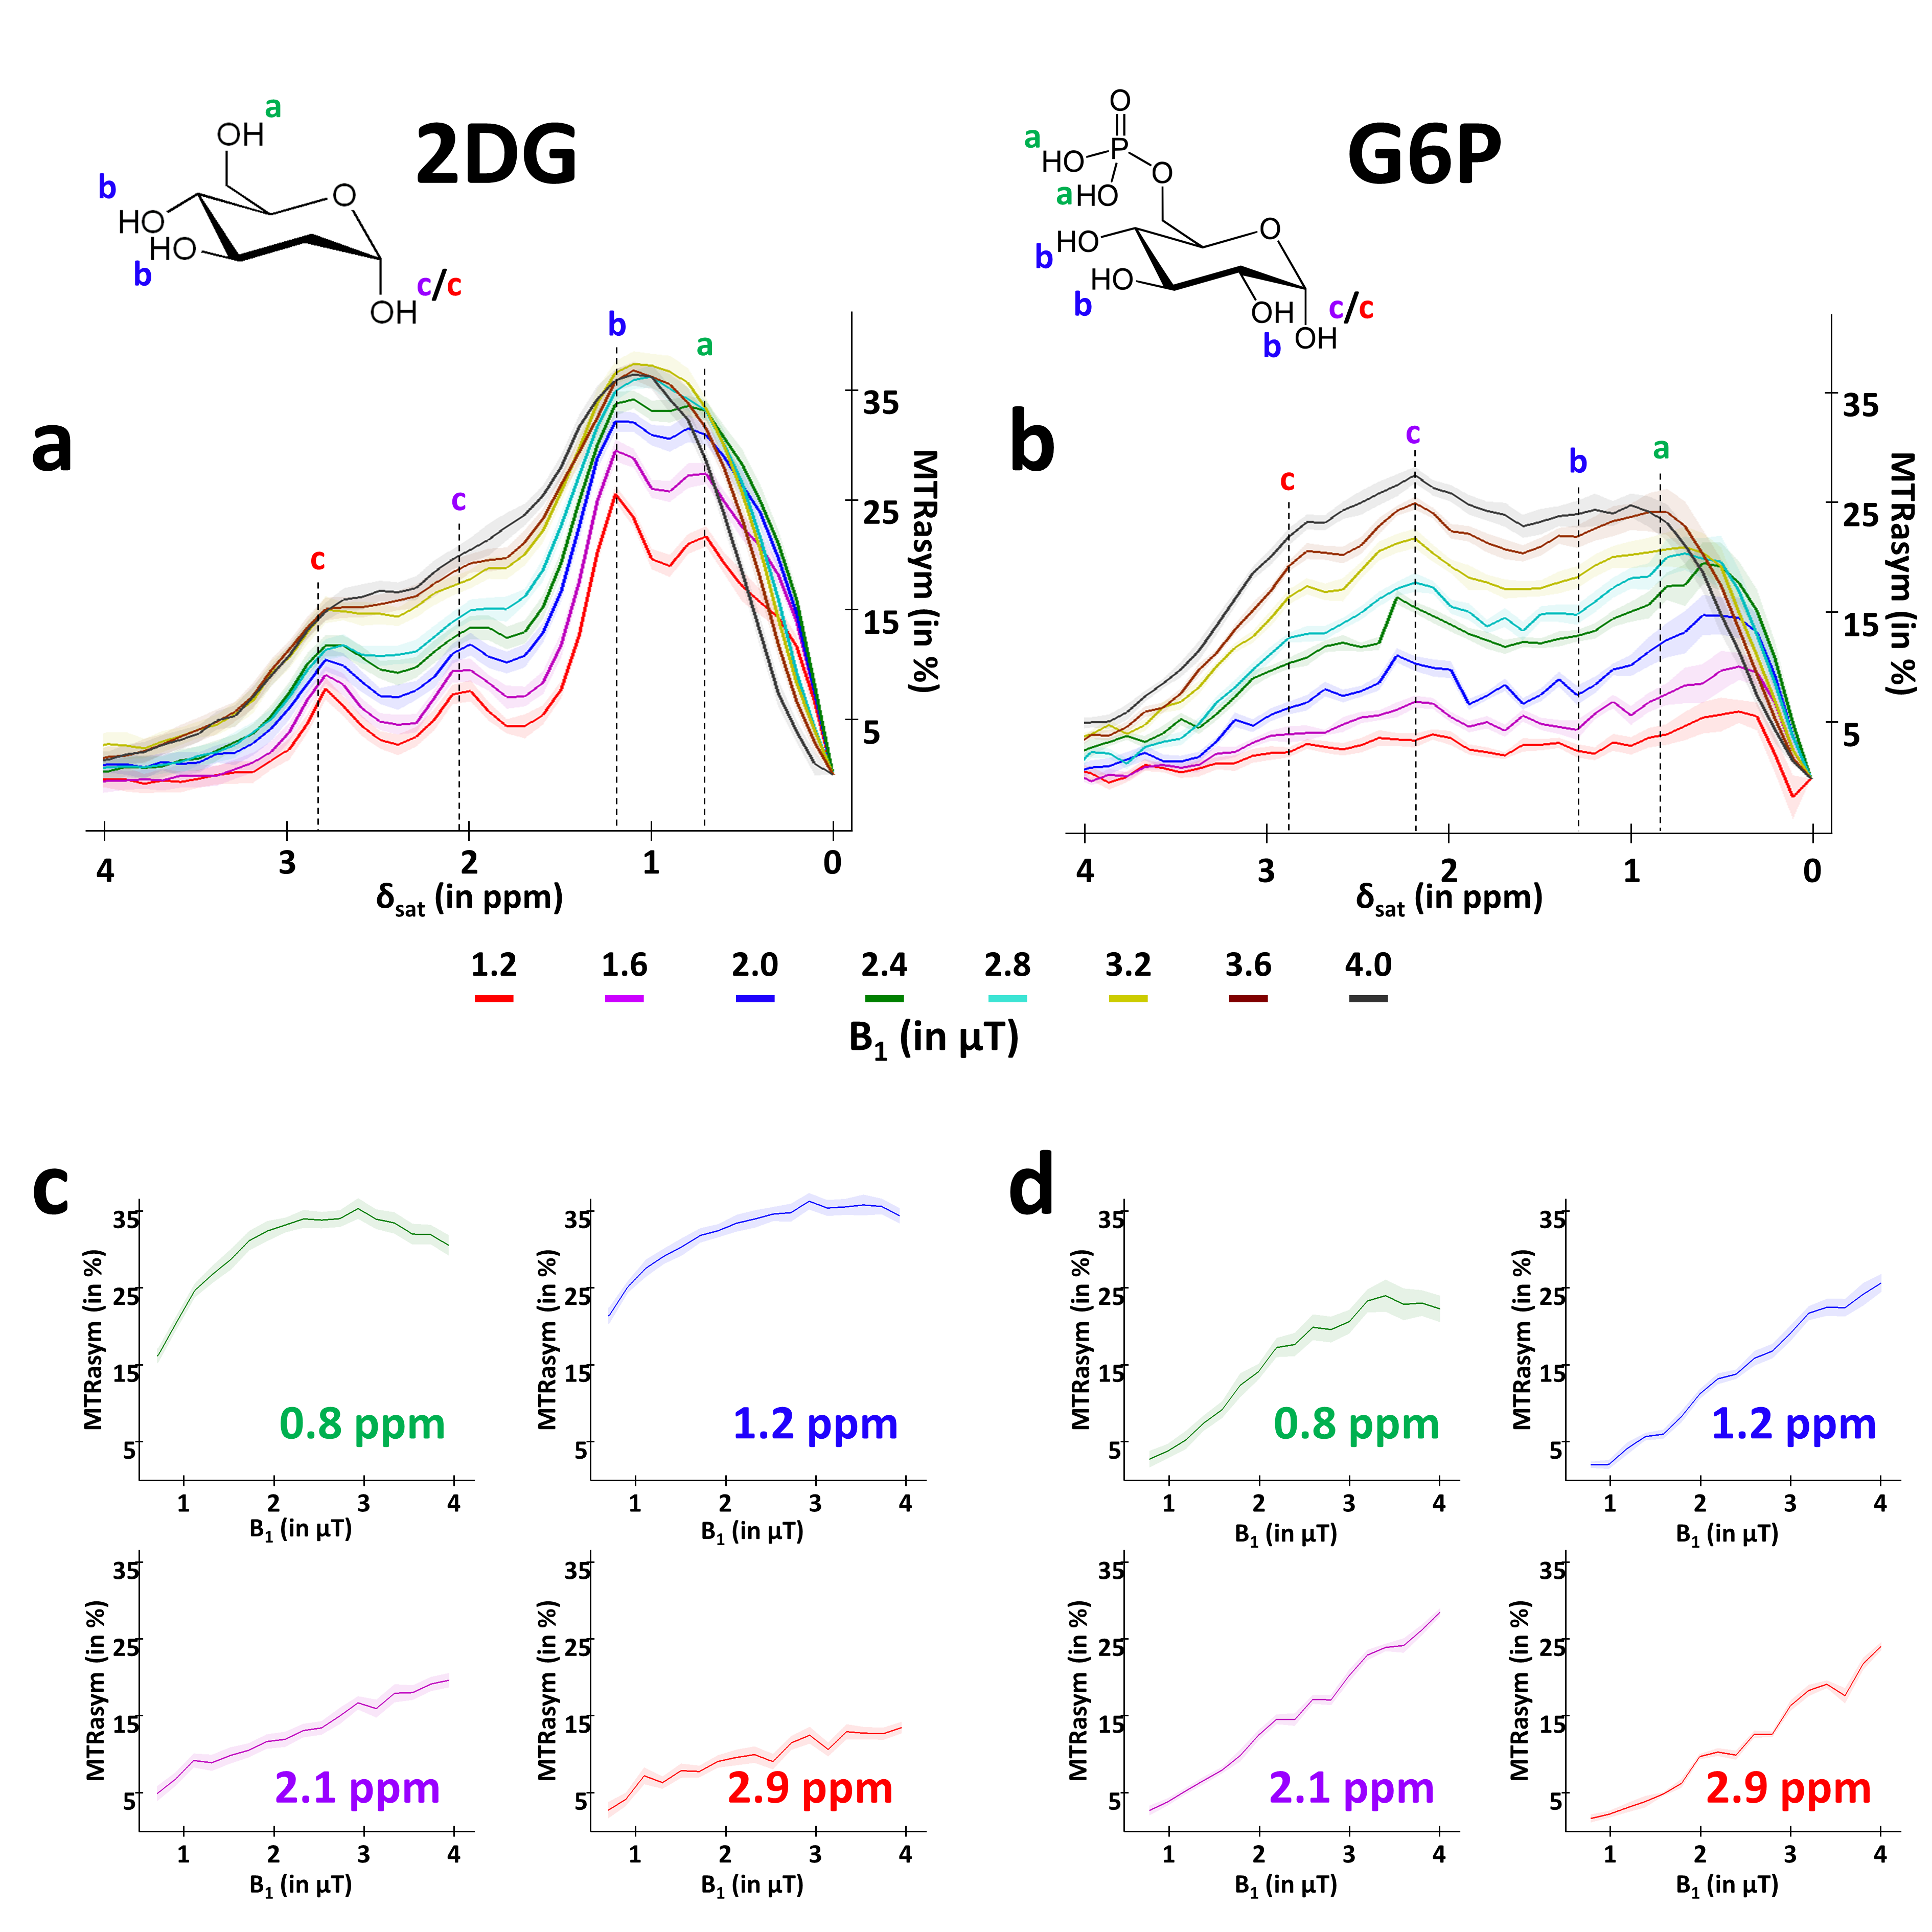
Glucose degradation contributes to several biochemical reactions that provide energy to cells. Recently, glucoCEST1,2 has been proposed as an alternative to 18F-FDG to study glucose consumption using injection of glucose or 2-deoxy-D-glucose (2DG), an analogue similarly transported but with metabolism blocked after the first phosphorylation into 2DG-6-phosphate (2DG6P)2-5. While glucose and 2DG exhibited comparable glucoCEST effects in phantoms, intravenous injection of 2DG has been reported to lead to higher glucoCEST signal accumulation, probably because 2DG6P remained trapped for longer time into the cells2,3. GlucoCEST signal may potentially arises from 3 different compartments i.e. vascular, extravascular/extracellular and intracellular (Fig.1). Even if such data argue in favor of intracellular origin of CEST contrast, some other works reported primarily extracellular origin6 or both1,5. Thus, compartmental origin of glucoCEST signal is still an open question important to be addressed for further utilization of glucoCEST. Surprisingly, in spite of the very complex form of the MTRasym curves of glucose or analogues, which exhibit 4 different peaks related to non-equivalent exchanging hydroxyl groups (Fig.2), all studies only reported variations of CEST signals measured at one saturation offset (~+1 ppm)7-9. Here, we measured for the first time variations of CEST signals at 4 different offsets following 2DG injection in rats, possibly providing deeper insights into the origin of glucoCEST signal.Material & Methods
GlucoCEST sequence: To maximize detection sensitivity over spatial resolution, we used a spectroscopic approach based on fully adiabatic LASER localization preceded by a CEST module consisting in a frequency-selective continuous wave pulse (Tsat = 4s, B1 = 2µT). Acquisitions were performed on a horizontal 11.7T Bruker magnet using volume coil in transmission (homogenous B1 field) and a quadrature surface coil in reception.Phantom acquisitions: Solutions of 50mM of 2DG and glucose-6-phosphate (G6P) were prepared. B1 intensity was ranged between 1.2 and 4.0µT with a 0.4µT step and saturation offsets were ranged between -5 to 5ppm with a 0.2ppm step.
Animal acquisitions: 4 rats under isoflurane anesthesia (1.5%) were injected intravenously with a 2DG solution (20% w/w) in 8 minutes for a total dose of 2DG of 1g/kg. A voxel of 2.5x2.5x2.5mm3 was placed in left striatum and glucoCEST spectrum were acquired in 1.5min with B1 = 2µT and saturation offsets applied at -20, ± 2.9, ± 2.1, ± 1.2 and ± 0.8ppm. Zspectra were acquired during 12.5min before 2DG injection and 122.5min after.
Results
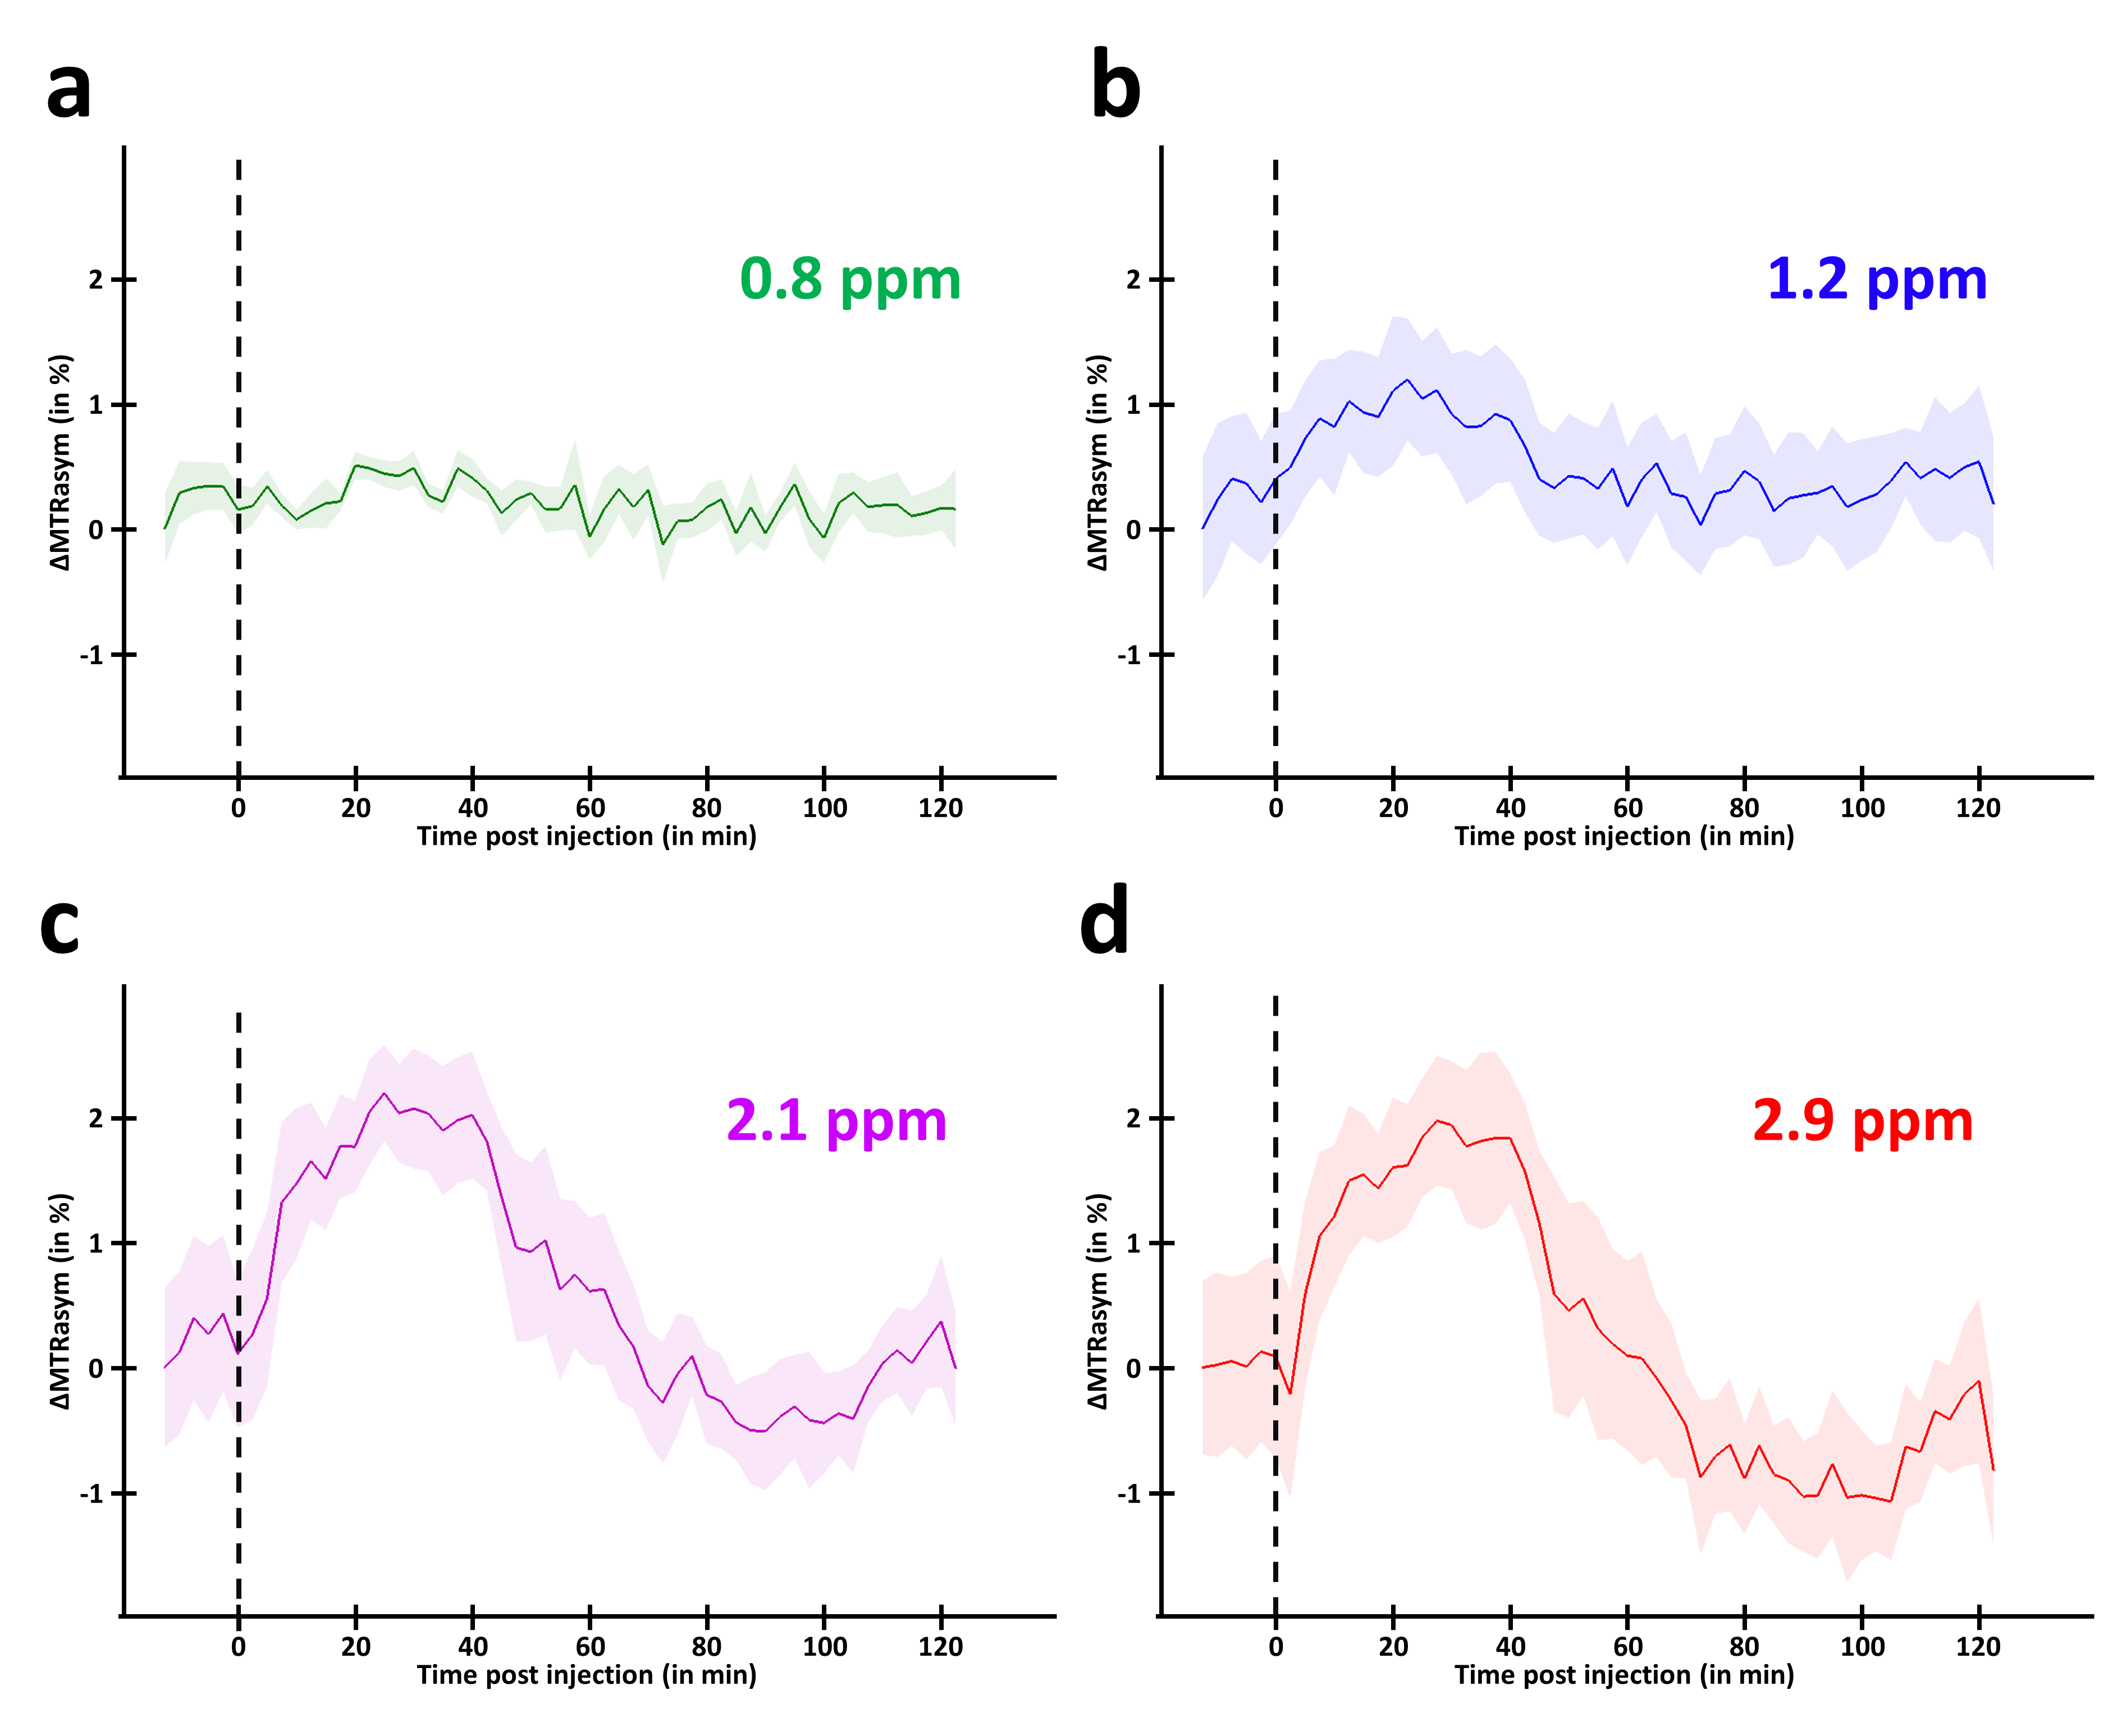
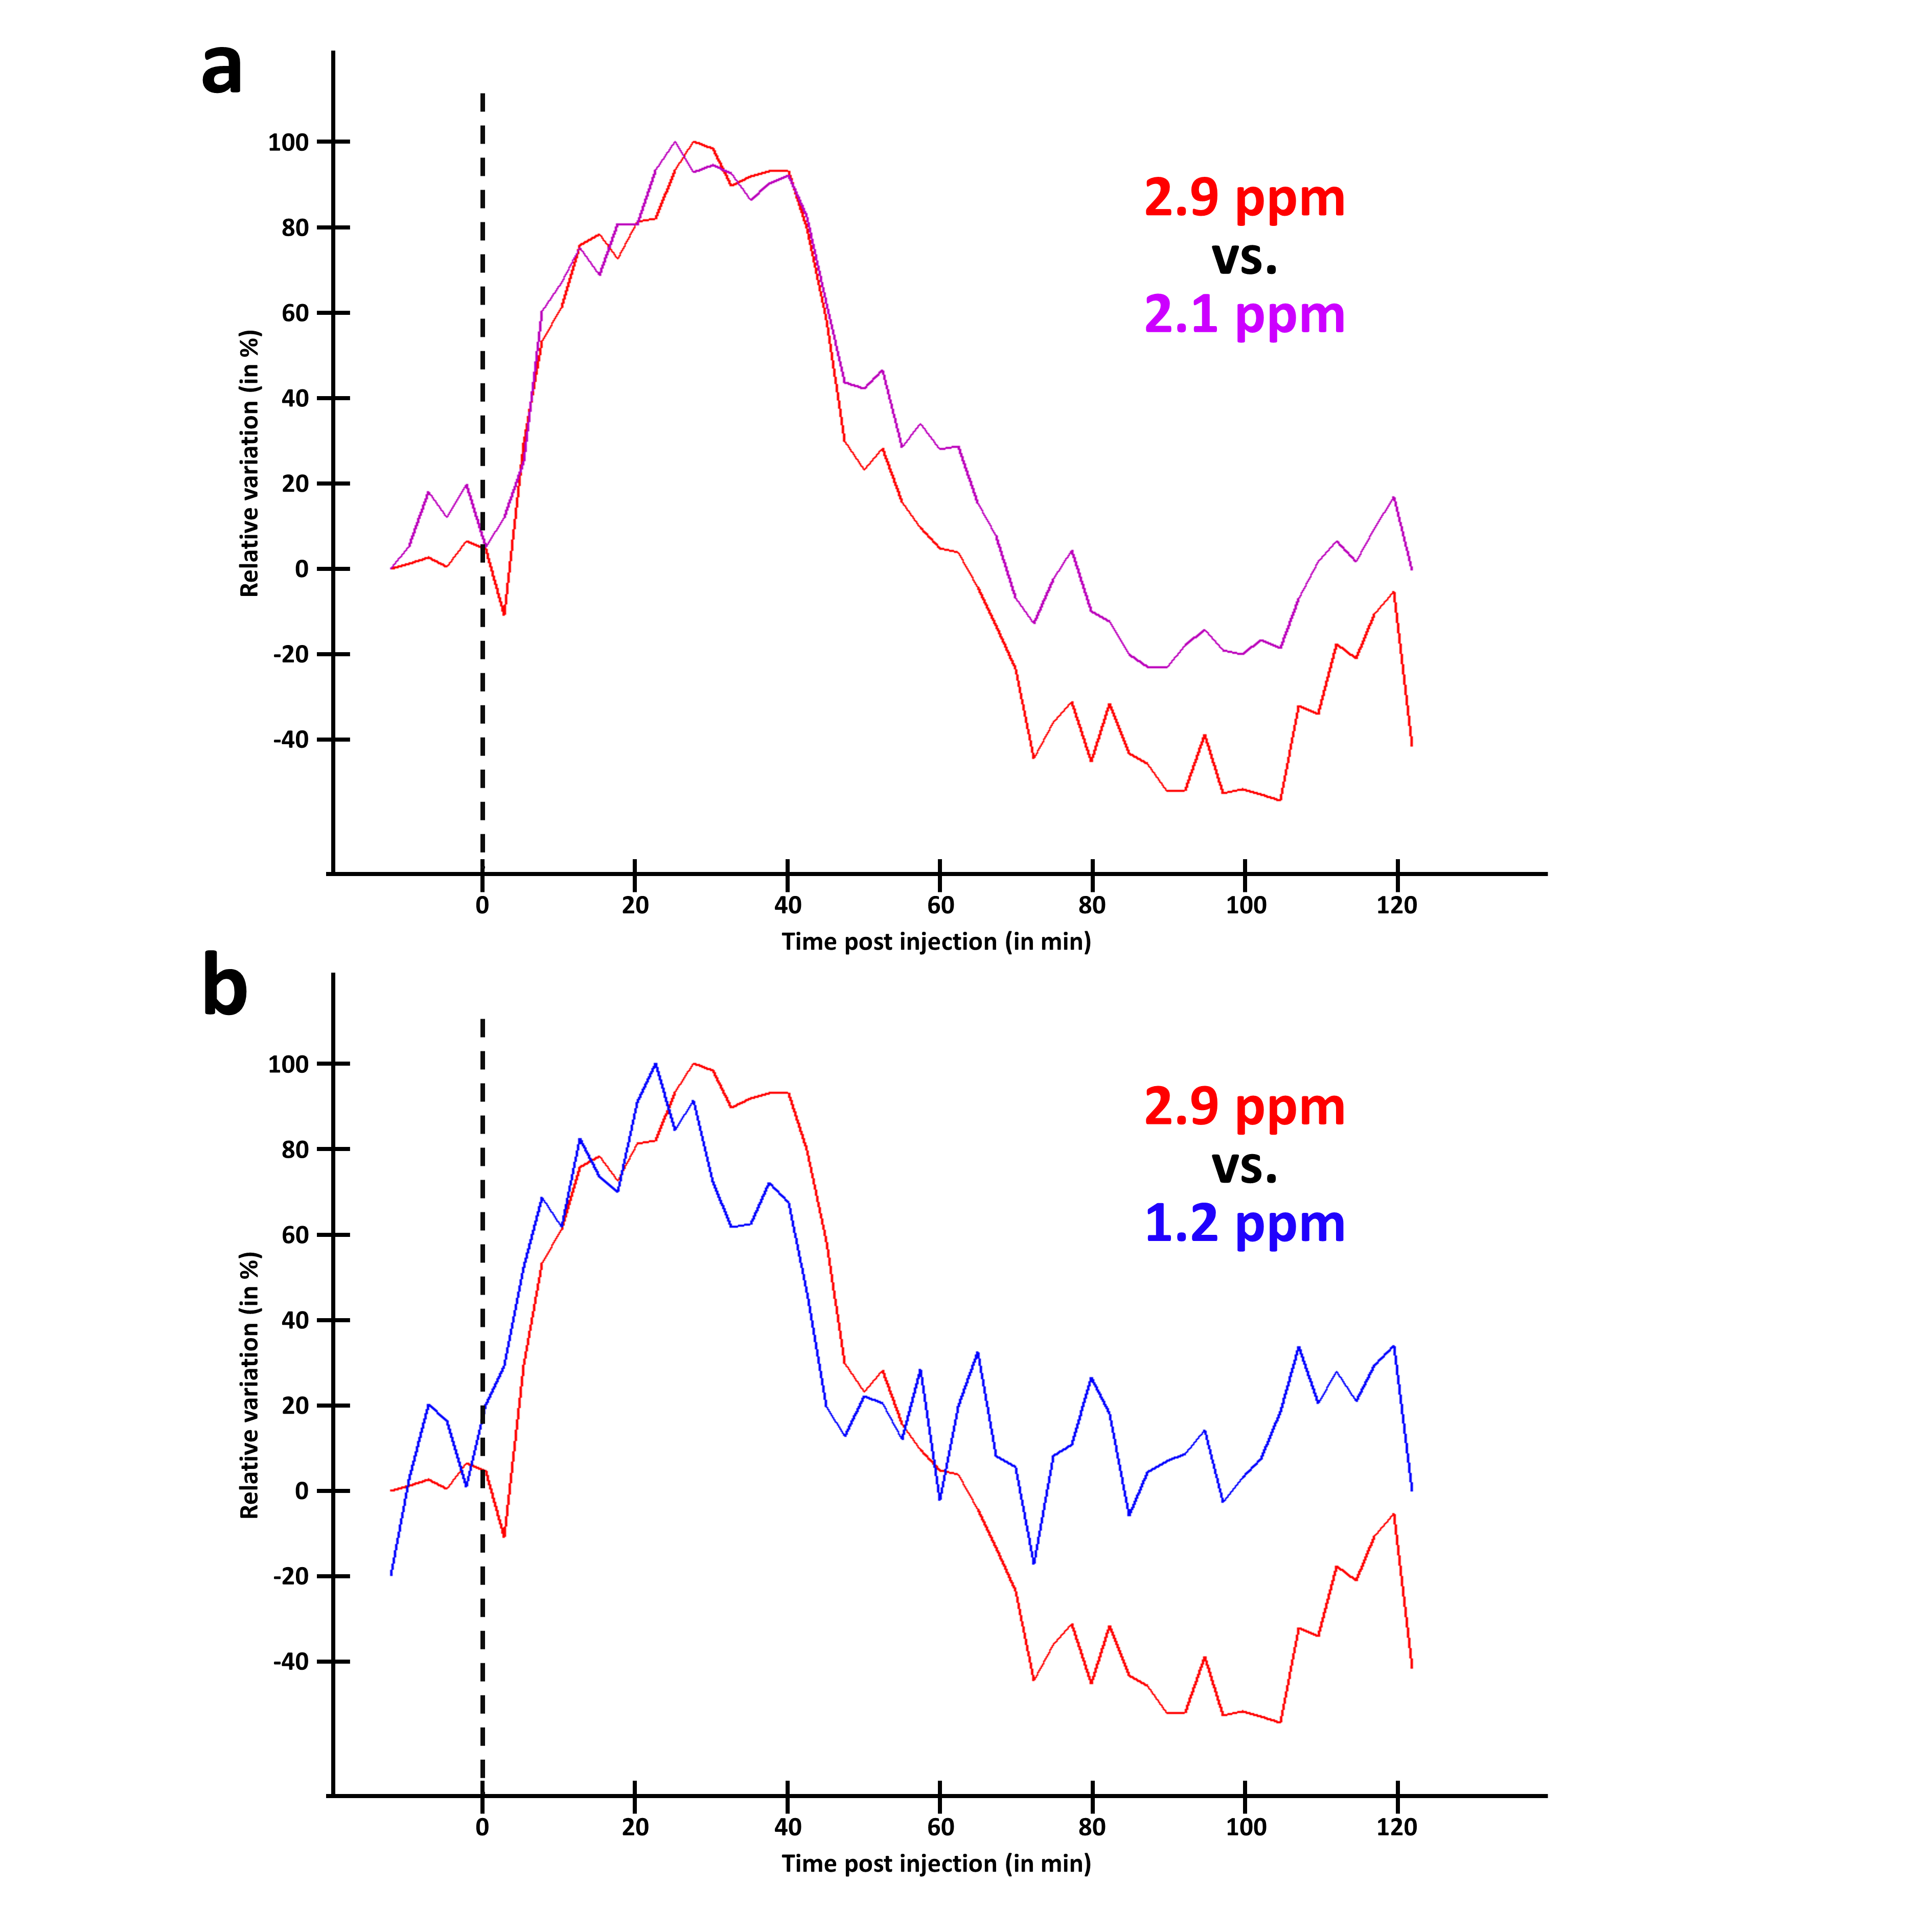
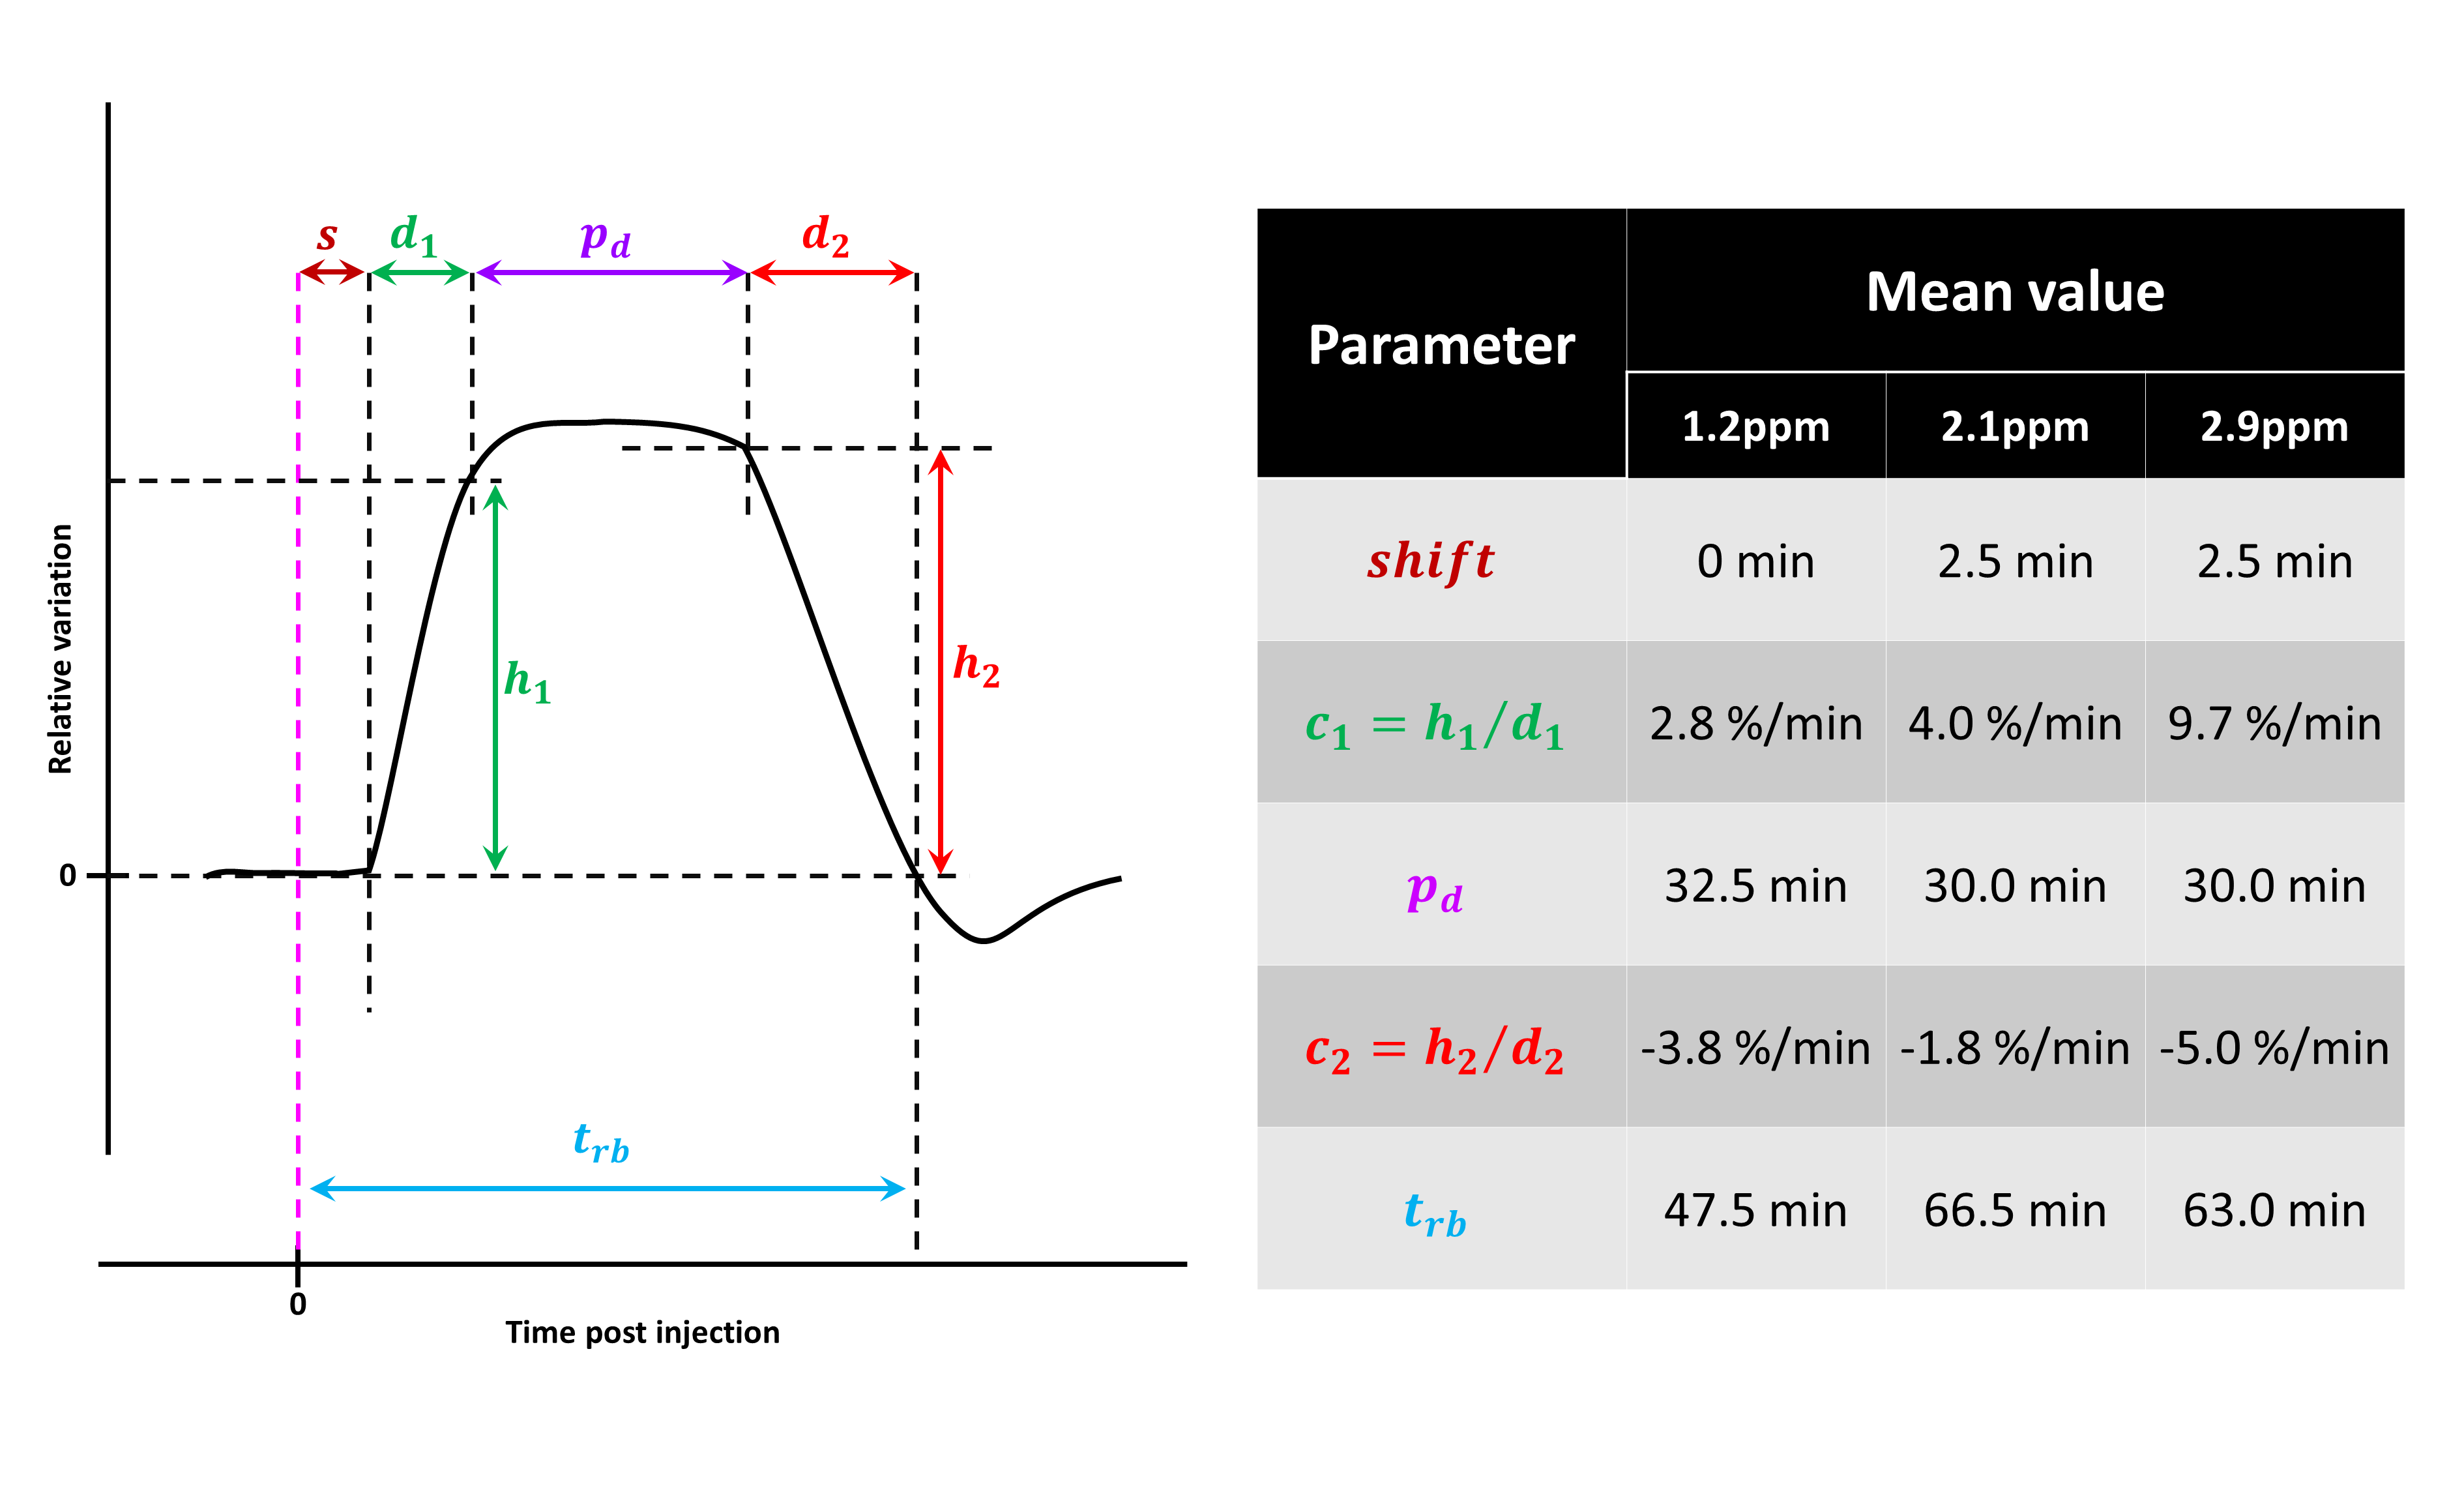
MTRasym curves acquired in 2DG and G6P phantoms showed very different profiles (Fig.2.a and b respectively). 2DG exhibited 4 well resolved peaks corresponding to 3 different hydroxyl groups (peaks at 2.1 and 2.9ppm corresponding to α- and β- anomeric forms of the pyranose) while G6D exhibited broader peaks. Interestingly, strongest CEST signals were measured at 0.8 and 1.2ppm for 2DG (Fig.2.c) whereas maximal CEST signals were measured at 2.1 and 2.9ppm in G6P (Fig.2.d). While no variation was observed at 0.8ppm, probably due to the poor sensivity of the method close to water resonance frequency (Fig.3.a), increased glucoCEST contrast was measured at 1.2, 2.1 and 2.9ppm after 2DG injection in rats (Fig.3.b, c and d respectively, black dotted line) followed by a return to baseline level. To better visualize differences between offsets, curves were normalized and kinetics were compared (Fig.4). While glucoCEST uptakes measured at 2.1 and 2.9ppm exhibited similar timing (Fig.4.a), they were delayed compared to 1.2ppm (Fig.4.b). Moreover, plateau durations, increase and decrease times were also different between 1.2ppm and 2.1/2.9ppm (Fig.5).Discussion and conclusion
Thanks to very different MTRasym profiles, it is possible to discriminate 2DG and G6P. Note that G6P and not 2DG6P was used for phantom acquisition. Nonetheless, the missing hydroxyl group on 2DG6P (compared to G6P) resonates at 1.2ppm10,11 so it would not affect CEST signal at 2.1 and 2.9ppm measured in G6P phantom.Interestingly, CEST signals at 2.1 and 2.9ppm were 2.5min delayed compared to 1.2ppm and times to return to baseline were also longer (trb, Fig.5). If we consider that CEST signal is mostly 2DG6P-weighted at 2.1 and 2.9ppm, it is consistent with 2DG6P accumulation in the intracellular space produced by 2DG phosphorylation by hexokinase. This is coherent with previous works reporting that early data points after injection mostly reflect 2DG transport in extravascular/extracellular and intracellular spaces whereas later time points reflect 2DG6P accumulation in cells2,5. Surprisingly, decrease of glucoCEST contrast observed after ~60min would suggest 2DG and 2DG6P degradation or washout. Similar effect has already been reported2 and could correspond to degradation of 2DG6P through pentose phosphate pathway2 glycogen conversion12,13, further metabolism in 2DG-1-P and 2DG-1,6-P14 or passive washout due to osmotic pressure. Finally, we reported for the first time an undershoot of glucoCEST signal at 2.1 and 2.9ppm before returning to baseline (Fig.3.c, d and 4.a). Such an effect, which was not observed after glucose injection (data not shown), is still under investigation. It could be due to modification of intracellular glucose concentration in response to high dose of 2DG. Thanks to resolving CEST variation at different resonance frequencies, it seems that 2DG uptake, consumption and degradation by cells can be assessed with unprecedented richness. This would constitute a first step toward quantitative measurement of glucose metabolism using CEST.
Acknowledgements
This work was supported by a grant from Agence Nationale pour la Recherche (“nrjCEST” project, ANR-18-CE19-0014-01). The 11.7 T scanner was funded by a grant from NeurATRIS: A Translational Research Infrastructure for Biotherapies in Neurosciences (“Investissements d'Avenir”, ANR-11-INBS-0011).References
1. Walker-Samuel, S., et al., In vivo imaging of glucose uptake and metabolism in tumors. Nat Med, 2013. 19(8): p. 1067-72.
2. Nasrallah, F.A., et al., Imaging brain deoxyglucose uptake and metabolism by glucoCEST MRI. J Cereb Blood Flow Metab, 2013. 33(8): p. 1270-8.
3. Jin, T., et al., Mapping brain glucose uptake with chemical exchange-sensitive spin-lock magnetic resonance imaging. J Cereb Blood Flow Metab, 2014. 34(8): p. 1402-10.
4. Wu D et al., Dynamic glucose enhanced MRI of the placenta in a mouse model of intrauterine inflammation. Placenta. 2018.69:86-91.
5. Jin T., et al, Glucose metabolism-weighted imaging with chemical exchange-sensitive MRI of 2-deoxyglucose (2DG) in brain: Sensitivity and biological sources. Neuroimage. 2016.143:82-90.
6. Chan, K.W., et al., Natural D-glucose as a biodegradable MRI contrast agent for detecting cancer. Magn Reson Med, 2012. 68(6): p. 1764-73.
7. Roussel T et al., Brain sugar consumption during neuronal activation detected by CEST functional MRI at ultra-high magnetic fields Sci Rep. 2019.9(1):4423.
8. Knutsson, et al. "Arterial Input Functions and Tissue Response Curves in Dynamic Glucose-Enhanced (DGE) Imaging: Comparison Between glucoCEST and Blood Glucose Sampling in Humans." Tomography 2018. 4(4): 164-171.
9. Xu X et al., Dynamic glucose enhanced (DGE) MRI for combined imaging of blood-brain barrier break down and increased blood volume in brain cancer. Magn Reson Med. 2015. 74(6):1556-63.
10. Zaiss M et al., Quantification of hydroxyl exchange of D-Glucose at physiological conditions for optimization of glucoCEST MRI at 3, 7 and 9.4 Tesla. NMR Biomed. 2019; 32(9):e4113.
11. Tolomeo D et al., Chemical exchange saturation transfer MRI shows low cerebral 2-deoxy-D-glucose uptake in a model of Alzheimer’s Disease. Sci Rep. 2018; 8: 9576.
12. Southworth R et al., Tissue-specific differences in 2-fluoro-2-deoxyglucose metabolism beyond FDG-6-P: a 19F NMR spectroscopy study in the rat. NMR Biomed 2003; 16: 494–502.
13. Nelson et al., 2‐Deoxyglucose incorporation into rat brain glycogen during measurement of local cerebral glucose utilization by the 2‐deoxyglucose method. Journal of neurochemistry 1984.43(4):949-956.
14. Dienel G et al., Metabolites of 2-deoxy-[14C]glucose in plasma and brain: influence on rate of glucose utilization determined with deoxyglucose method in rat brain. J Cereb Blood Flow Metab 1993; 13: 315–327
Figures