0504
Prediction of prognostic characteristics in glioma patients using amide proton transfer imaging at 3 Tesla1Paul C. Lauterbur Research Center for Biomedical Imaging, Shenzhen Institutes of Advanced Technology, Chinese Academy of Sciences, Shenzhen, China, 2Department of Medical Imaging, Sun Yat-Sen University Cancer Center, Guangzhou, China, 3Department of Neurosurgery, Sun Yat-Sen University Cancer Center, Guangzhou, China, 4GE Healthcare, Beijing, China
Synopsis
Early identification of glioma prognostic characteristics is of great clinical importance. This study aims to evaluate the feasibility of APT in the prediction of tumor grade, IDH mutation and MGMT promoter methylation status at 3 Tesla. A total of 50 patients were recruited. Results show that although APTw effect exhibits no substantial difference based on MGMT methylation status, it enables the discrimination of histopathological grade and IDH mutant status with AUCs higher than 0.88. The results suggest APTw is a valuable imaging biomarker for prediction of tumor prognostic parameters, that may benefit accurate diagnosis and prompt treatment decisions.
Introduction
Early determination of prognostic characteristics, such as histopathological tumor grade, isocitrate dehydrogenase (IDH) mutation and O6-methylguanine-DNA-methyltransferase (MGMT) promoter methylation status, is of great clinical importance. Amide proton transfer (APT) imaging, a technique that can probe the chemical exchange saturation transfer (CEST) effect between endogeneous protein/peptide amide protons with bulk water, has been found to be valuable in the evaluation of prognostic characteristics. So far, most of the studies either focused on tumors of specific grades or were performed on high magnetic field strengths (e.g., 7 Tesla) [1-4]. This study aims to evaluate the capability of APT imaging in noninvasive prediction of prognostic characteristics in 50 patients with different glioma grades at a clinical magnetic field of 3 Tesla.Materials and methods
Patient recruitment: The study was approved by local institutional ethics committee, and written informed consent was obtained from all patients. A total of 50 patients (30 males, 45.8±13.9 years old) were recruited with the inclusion criteria of: (1) suspicious glioma on routine MRI; (2) previously untreated; (3) surgical resection with histological examination.MRI study: All images were acquired on a 3T MRI scanner (SIGNA Pioneer, GE, USA). APT images were acquired with a 2D single-shot SE-EPI sequence (TR = 4.0 s, TE = 26.6 ms, 4 saturation pulses with duration of 500 ms, average B1 of 2.0 μT, spatial resolution = 1.7×1.7×8 mm3, 54 CEST-weighted images including 3 unsaturated M0 were acquired with frequency offsets equally spanned between ± 600 Hz with respective to the water resonance). Gd-enhanced T1w imaging was conducted 5 minutes later after intravenous injection of the contrast agent (TR = 270 ms, TE = 2.6 ms, spatial resolution = 0.47×0.47×6 mm3).
Data analysis: Normalized Z-spectrum (Z) was corrected for B0 inhomogeneity by shifting the minimum of the Z-spectrum to the water resonance. APT-weighted effect was calculated using the conventional asymmetric analysis as: APTw=Z(-3.5 ppm)-Z(3.5 ppm). 2-4 ROIs (according to the lesion size, ~50 mm2 each) were positioned on Gd-enhanced area as well as contralateral normal appearing white matter (CNAWM) by experienced neuroradiologists with conventional MR images as reference. Then the ROIs were transferred to co-registered APTw maps. Values were averaged across slices and among patients for each group.
Histopathology: Diagnoses were histologically determined based on 2016 WHO classification of central nervous system tumors [5]. Tumor grade was obtained for all patients (18/50 = 36.0% grades of II or III [lower-grade glioma, LGG] and 32/50 = 64.0% glioblastoma [higher-grade glioma, HGG] as defined [6]), IDH mutation status for 32/50 patients (11/32 = 34.4% IDH-mutant; 21/32 = 65.6% IDH-wild type), and MGMT promoter methylation status in 32/50 cases (18/32 = 56.3% methylated; 14/32 = 43.8% unmethylated).
Statistical analysis: An unpaired Student’s t-test was performed between different groups, and a paired student’s t-test was used between tumor and CNAWM within each group. Receiver operating characteristic (ROC) curve was plotted, and the area under the ROC curve (AUC) was calculated to assess the ability of APT imaging in the prediction of prognostic characteristics. P<0.05 was regarded as statistically significant.
Results and discussion
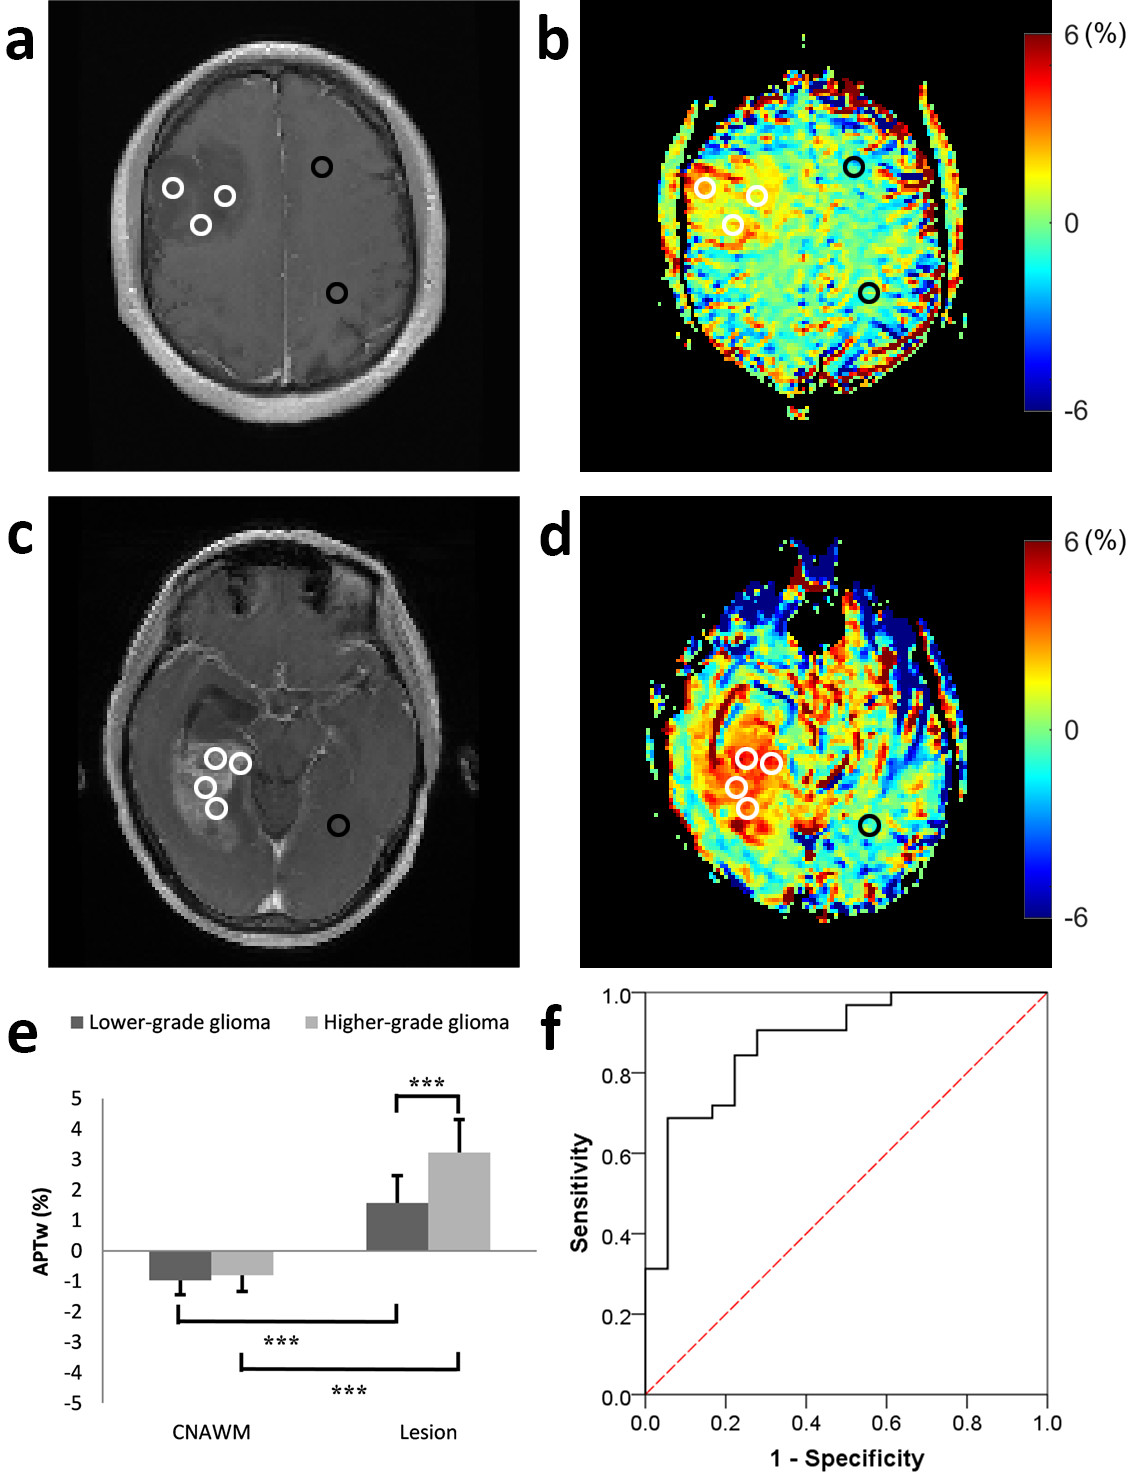
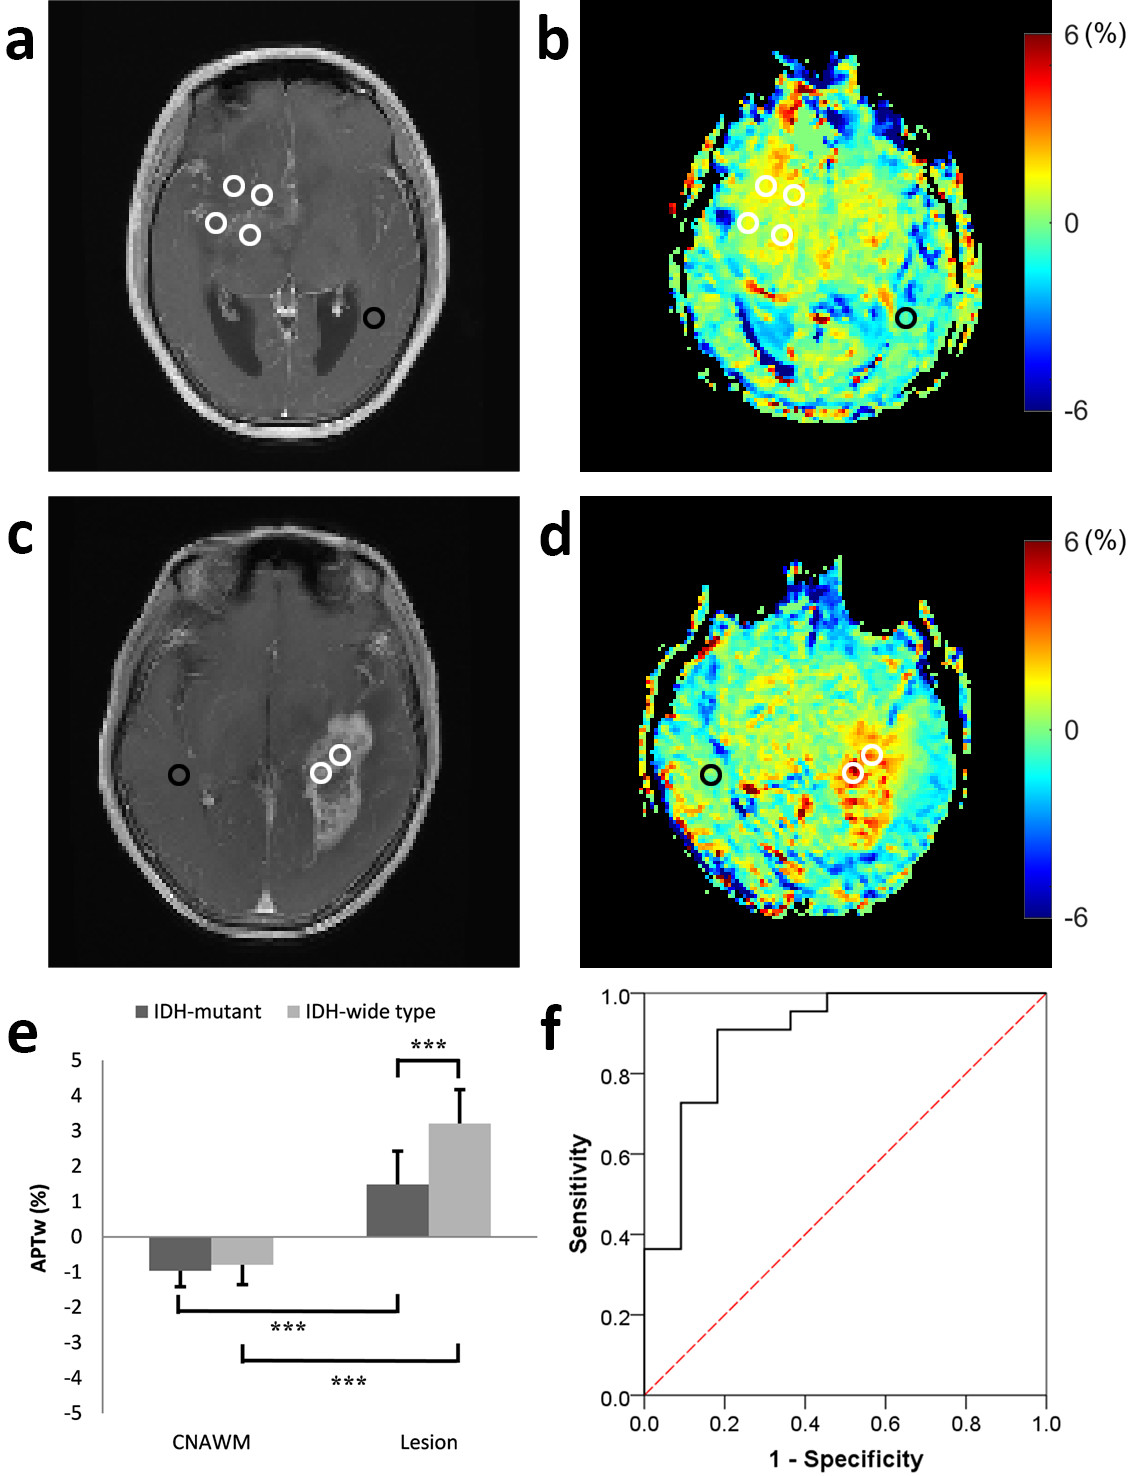
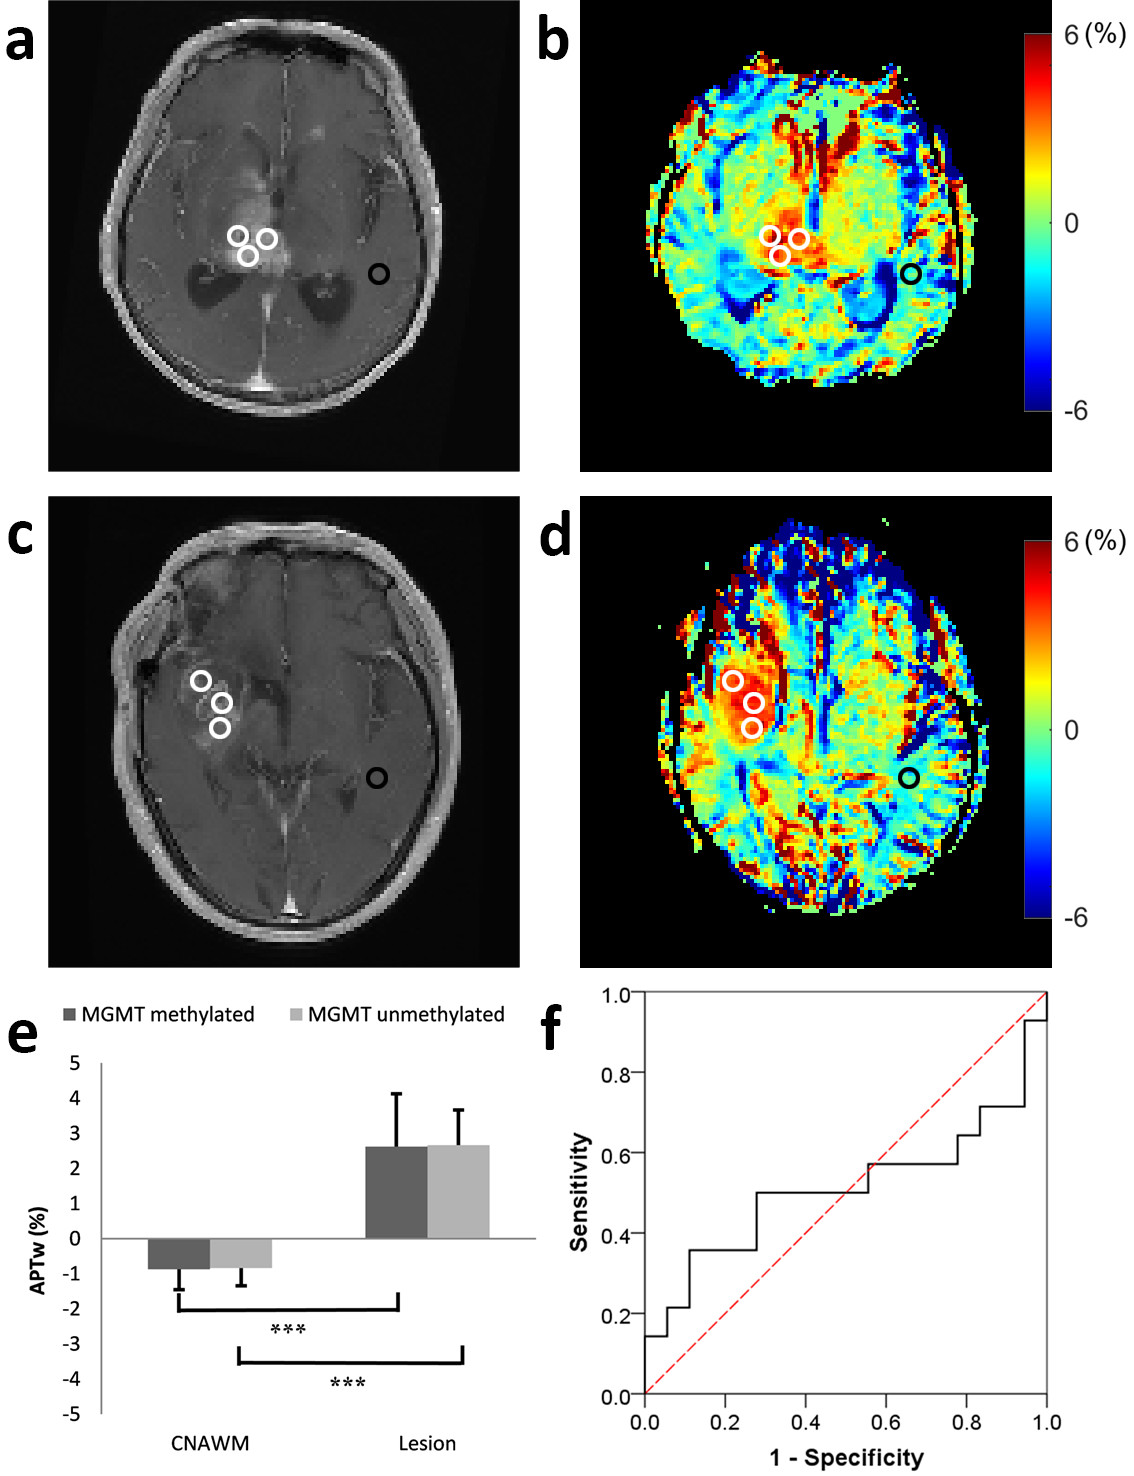
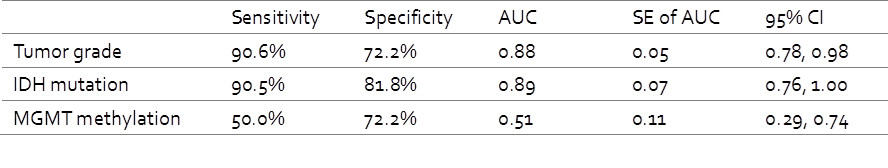
Figure 1a-d illustrate Gd-T1w images and respective APTw maps of two representative patients from groups of LGG and HGG, respectively. Compared with the CNAWM, the majority part of the lesions appears conspicuously hyperintense in the APTw map in both groups. Additionally, significant higher APTw effect was observed in HGG compared to that in LGG group (P<0.001, Fig. 1e). Results from groups of IDH-mutant and IDH-wide type were displayed in Figure 2. In brief, APTw maps display an obviously positive contrast in lesions in both groups (Fig 2b and 2d). Specifically, tumors in the IDH-mutant group showed significantly smaller APTw effect than that in the IDH-wide type group (P<0.001, Fig. 2e). Interestingly, although the tumors with different MGMT promoter methylation status exhibit substantially hyperintense APTw signals compared with respective CNAWM (Fig. 3b and 3d), they show comparable APTw effects without any significant difference between the two statuses (P>0.05, Fig. 3e). ROC analysis results were shown in Fig. 1f-3f. APTw was found to show good performance in differentiating tumor grade and identifying IDH mutant status (Table 1). However, the accuracy of APTw in the discrimination of MGMT methylation status is rather limited, with an AUC of only 0.51. High-grade tumors typically possess more protein species and/or cellular protein levels [7], leading to greater APTw effect in glioblastoma compared with that in LGGs. Though the biochemical origin of APTw signal alteration regarding IDH mutation remains unclear [2], IDH mutation is expected to cause alterations of amide acid concentration, global transcriptional repression and overall downregulation of protein expression [8], which may be partially responsible for the observed lower APTw effect in IDH-mutant gliomas. No significant difference in APTw effect associated with MGMT methylation was found in this study, in agreement with previous findings [1, 2].Conclusion
The current study suggests that APTw is a valuable imaging biomarker for glioma grading and IDH status identification, which may serve as a non-invasive way to provide important information for treatment management and therapeutic response assessment.Acknowledgements
Grant Support: National Natural Science Foundation of China (81571668, 81871348 and 91859102), Guangdong Special Support Program (2016TQ03R272), and Shenzhen Science and Technology Program (JCYJ20170413161350892).References
[1] Paech D, Windschuh J, Oberhollenzer J, Dreher C, Sahm F, Meissner JE, Goerke S, Schuenke P, Zaiss M, Regnery S, Bickelhaupt S, Bäumer P, Bendszus M, Wick W, Unterberg A, Bachert P, Ladd ME, Schlemmer HP, Radbruch A. Assessing the predictability of IDH mutation and MGMT methylation status in glioma patients using relaxation-compensated multipool CEST MRI at 7.0 T. Neuro Oncol. 2018 Nov 12;20(12):1661-1671.
[2] Joo B, Han K, Ahn SS, Choi YS, Chang JH, Kang SG, Kim SH, Zhou J, Lee SK. Amide proton transfer imaging might predict survival and IDH mutation status in high-grade glioma. Eur Radiol. 2019 Jun 7. doi: 10.1007/s00330-019-06203-x.
[3] Paech D, Dreher C, Regnery S, Meissner JE, Goerke S, Windschuh J, Oberhollenzer J, Schultheiss M, Deike-Hofmann K, Bickelhaupt S, Radbruch A, Zaiss M, Unterberg A, Wick W, Bendszus M, Bachert P, Ladd ME, Schlemmer HP. Relaxation-compensated amide proton transfer (APT) MRI signal intensity is associated with survival and progression in high-grade glioma patients. Eur Radiol. 2019 Sep;29(9):4957-4967.
[4] Jiang S, Rui Q, Wang Y, Heo HY, Zou T, Yu H, Zhang Y, Wang X, Du Y, Wen X, Chen F, Wang J, Eberhart CG, Zhou J, Wen Z. Discriminating MGMT promoter methylation status in patients with glioblastoma employing amide proton transfer-weighted MRI metrics. Eur Radiol. 2018 May;28(5):2115-2123.
[5] Louis DN, Perry A, Reifenberger G, von Deimling A, Figarella-Branger D, Cavenee WK, Ohgaki H, Wiestler OD, Kleihues P, Ellison DW.The 2016 World Health Organization classification of tumors of the central nervous system: a summary. Acta Neuropathol 131:803–820.
[6] Li Y, Liu X, Xu K, Qian Z, Wang K, Fan X, Li S, Wang Y, Jiang T. MRI features can predict EGFR expression in lower grade gliomas: A voxel-based radiomic analysis. Eur Radiol. 2018 Jan;28(1):356-362.
[7] Zhou J, Tryggestad E, Wen Z, Lal B, Zhou T, Grossman R, Wang S, Yan K, Fu DX, Ford E, Tyler B, Blakeley J, Laterra J, van Zijl PC. Differentiation between glioma and radiation necrosis using molecular magnetic resonance imaging of endogenous proteins and peptides. Nat Med 2011;17:130–134.
[8] Doll S, Urisman A, Oses-Prieto JA, Arnott D, Burlingame AL (2017) Quantitative proteomics reveals fundamental regulatory dif-ferences in oncogenic HRAS and Isocitrate dehydrogenase (IDH1) driven astrocytoma. Mol Cell Proteomics 16:39–56.
Figures