0503
CEST and qMT Properties of Brain Metastases from Radio-resistant and Radio-sensitive Primary Tumours1Physical Sciences, Sunnybrook Research Institute, Toronto, ON, Canada, 2Radiation Oncology, Sunnybrook Health Sciences Centre, Toronto, ON, Canada, 3Radiation Oncology, University of Toronto, Toronto, ON, Canada, 4Medical Biophysics, University of Toronto, Toronto, ON, Canada
Synopsis
Previous animal studies have shown differences in CEST properties of radio-resistant and radio-sensitive renal cell carcinoma xenografts. The current study probed the differences in CEST and MT properties of brain metastases from radio-resistant and radio-sensitive primary tumours. We observed significantly lower amount of magnetization transfer, RM0B/RA, and direct water saturation effect, 1/(RAT2A) in brain metastases from radio-resistant tumours compared to those from radio-sensitive tumours. However, the CEST effects of the two cohorts were not different. Such information should be considered when investigating brain metastases and their response to treatment.
Introduction
When cancers metastasize to the brain, they carry many characteristics of their primary tumour that might impact their response to therapy. Stereotactic radiosurgery (SRS), which involves delivering a high dose of radiation focally to the tumour, is the preferred treatment for brain metastases. However, tumour size is the main factor in determining the SRS dose and fractionation. Despite having similar appearances in clinical MRI (i.e., post-Gd T1w and T2w-FLAIR), radio-resistant tumours (e.g., melanoma and renal cell carcinoma,RCC) have different metabolic properties compared to radio-sensitive tumour (e.g., breast and lung). These differences can be probed with chemical exchange saturation transfer (CEST) and magnetization transfer (MT)1. We hypothesize that similar differences exist in CEST and MT properties between brain metastases originating from radio-resistant and radio-sensitive primary tumours. Incorporating such information might enable the tailoring of treatment to primary tumour type and potentially improve treatment outcome.Methods
Subjects: 49 patients with brain metastases were recruited (REB approved) and MRI-scanned immediately before start of their treatment. Several patients had more than one tumour treated. The radio-sensitive cohort included 42 brain metastases from primary breast (9 patients, 9 tumours) and lung (29 patients, 33 tumours) cancers. The radio-resistant cohort included 12 brain metastases from primary melanoma (7 patients, 8 tumours) and RCC (4 patients, 4 tumours) cancers.MRI: was performed on a 3T Philips Achieva scanner. An axial slice passing through the tumour was imaged with TFE (TR/TE=1971/29ms, TFE-factor=2, Matrix=160×160, FOV=20×20cm, slice=3mm).
CEST: Imaging covered saturation frequency offsets between -5.9 and 5.9ppm in 0.2ppm increments with 4 references at ~780ppm at the beginning and the end of the spectrum. RF saturation included 4 block pulses of 242.5ms each with 2.5ms gaps interleaved and B1=0.52µT2,3. CEST imaging was repeated twice.
qMT: Imaging covered offsets between 2 and 780ppm with 14 offsets (with equal logarithmic scale spacing). RF saturation consisted of 4 block pulses of 242.5ms each with 2.5ms gaps interleaved and B1=1.5,3,5 µT4.T1,B1, and T2 mapping was performed using inversion recovery, WASABI5 ,and multi-TE imaging.
Analysis: CEST,MT,T1,T2,post-Gd T1w/FLAIR images were co-registered to the first acquired CEST image. Tumour ROI was identified at each scan on the post-Gd T1w. All metrics were calculated voxelwise and the median values over the ROI were used.
qMT: The three MT spectra were fitted to the two-pool MT model proposed by Henkelman6 in transient state, and the four model parameters [RM0B/RA,T2B,R,1/(RAT2A)] were calculated where RM0B/RA is the amount of magnetization transfer; M0B, the macromolecular pool-size; R, the exchange rate from MT to water pool; RA, the longitudinal relaxation rate of the water pool; and T2A and T2B, the transverse relaxation times of the water and MT pools, respectively.
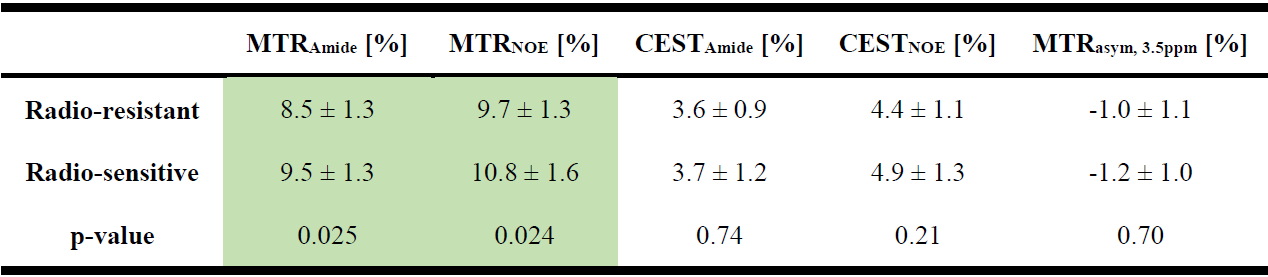
CEST: B0 correction was performed using WASSR7 and drift correction was also performed2. Each spectrum was normalized to its reference and the two normalized CEST spectra were averaged. The amplitude of this spectrum at the peak amide CEST (3.5ppm) and aliphatic nuclear Overhauser effect (NOE; -3.5ppm) offsets were used as MTRAmide and MTRNOE signals, respectively. Then, the MT Z-spectrum was extrapolated using the estimated qMT model parameters to the frequency offsets and B1 amplitude used in the CEST experiment. This spectrum was subtracted from CEST spectrum to isolate CEST signals and its amplitude at 3.5 and -3.5ppm were used as CESTAmide and CESTNOE signals, respectively.
Results & Discussions
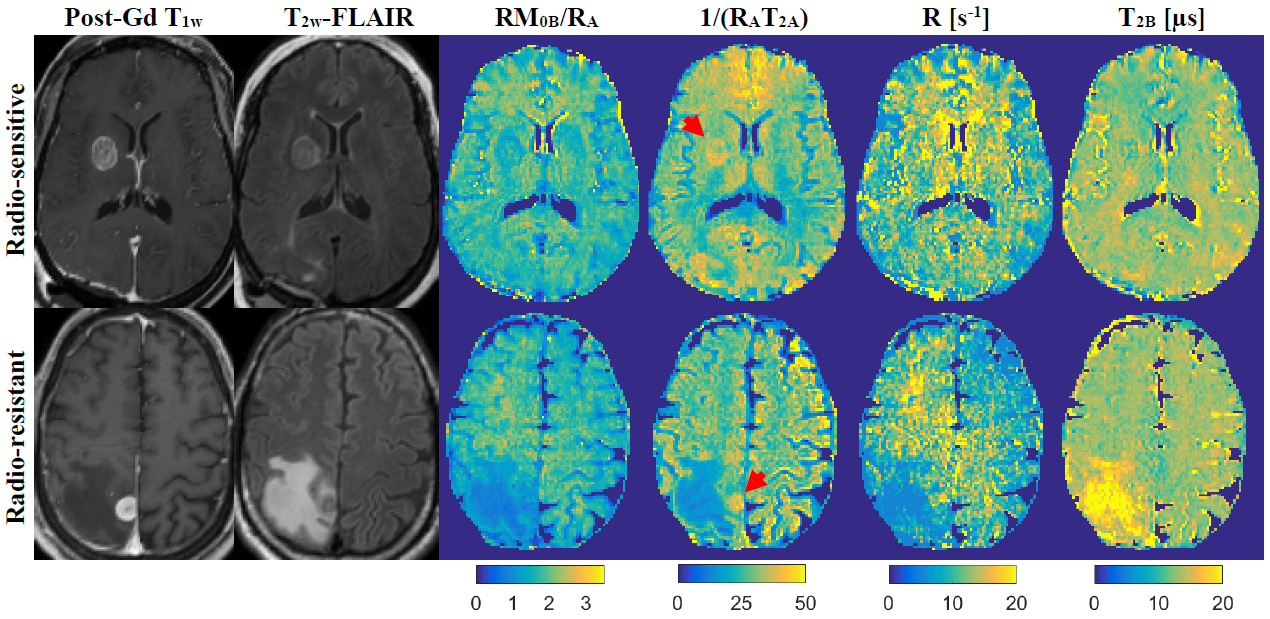
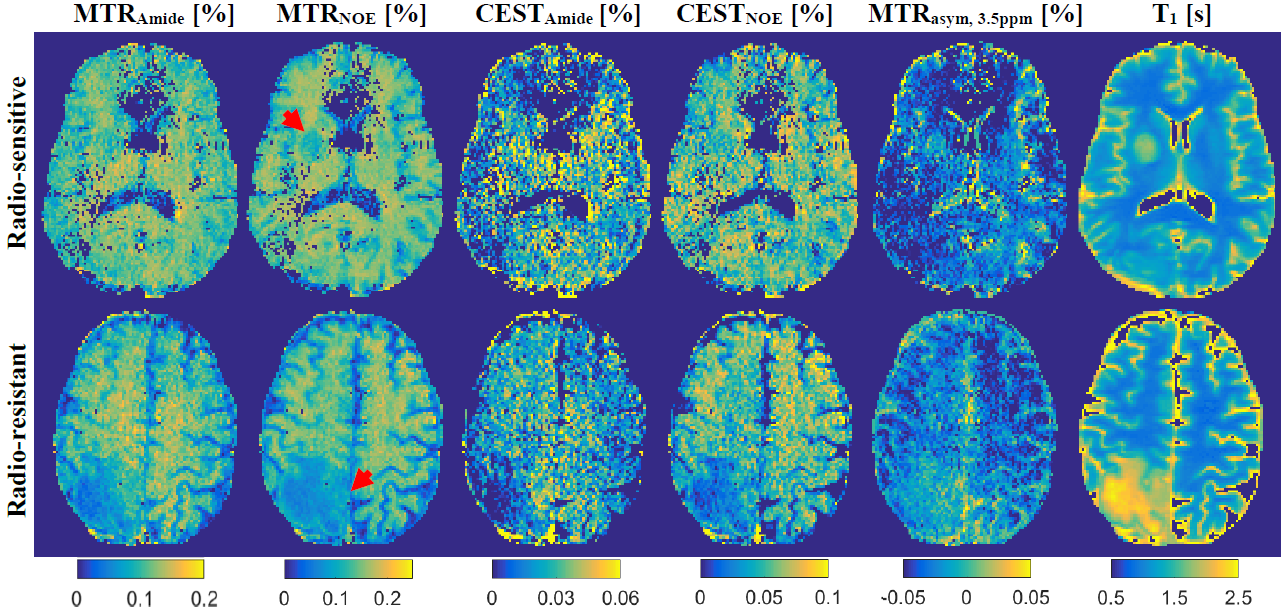
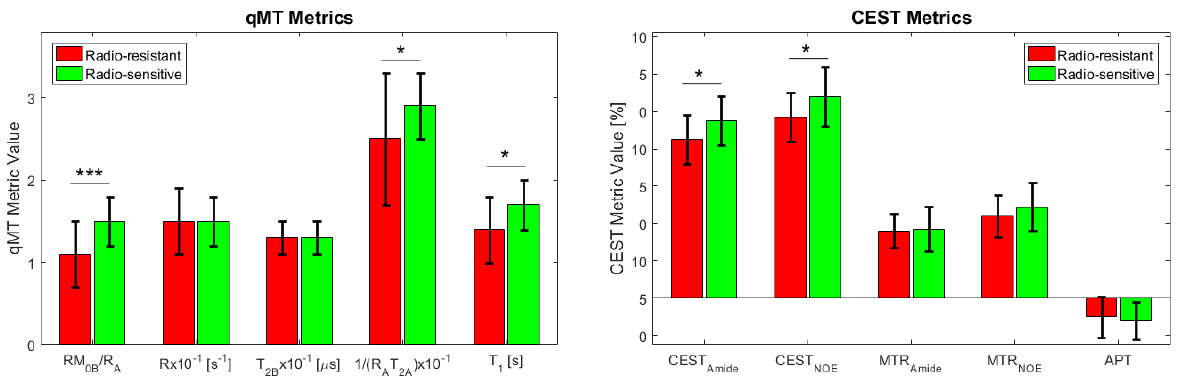
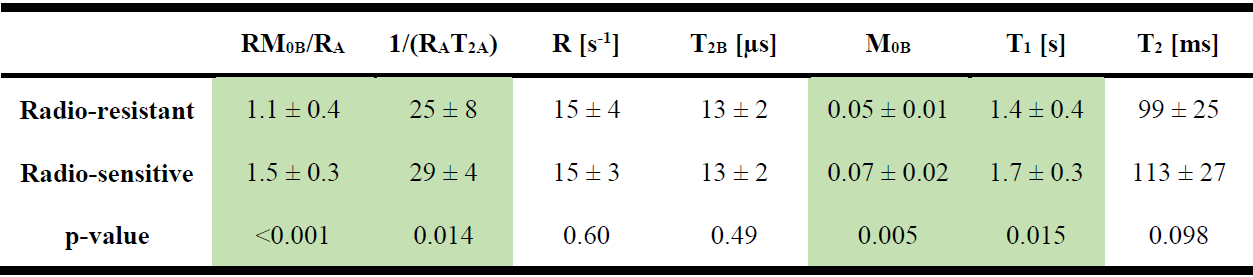
Figure 1 shows post-Gd T1w,FLAIR and qMT parametric maps for two representative brain metastases originating from a radio-resistant and a radio-sensitive primary tumour. Figure 2 shows CEST contribution and T1 maps for these two patients. Table 1 and 2 report the CEST and qMT parameters respectively (averaged over all patients). Figure 3 shows distribution of CEST, MT and T1 of tumour for all patients in each cohort.Before treatment, differences were observed between MTRNOE and MTRAmide of brain metastases from radio-resistant and radio-sensitive primary tumours, with radio-resistant tumours having statistically significantly lower values (p=0.024 and p=0.025 respectively).
MTR represents the combination of MT, direct water saturation and CEST effects. No statistically significant differences were observed in CESTNOE or CESTAmide of the two cohorts indicating there was no difference in their CEST effect (unlike what was reported in literature for prostate tumours cell lines1).
However, the amount of magnetization transfer (RM0B/RA) was significantly lower for brain metastases from radio-resistant primary tumours (p<0.001). Similarly for direct water saturation effect parameter 1/(RAT2A) was statistically significantly lower for metastases from radio-resistant tumours (p=0.014). This lower MT value was predominantly driven by smaller macromolecular pool size, M0B (p=0.005) as well as differences in T1 values (p=0.015) and not due to MT exchange rate (p=0.60).
Conclusions
Animal studies have reported significantly lower CEST effect in radio-resistant tumours which is attributed to their lower metabolic activity (making them resistant to radiotherapy). In this study however, we did not observe any differences in CEST effect of brain metastases originating from radio-resistant and radio-sensitive primary tumours. However, we observed significantly lower MT and direct water saturation effect in metastases from radio-resistant primary tumours. Thus, brain metastases from radio-resistant and radio-sensitive primaries have similar metabolism (CEST), but different micro-structural and macromolecular content (qMT). Such differences should be taken into account when studying response of these tumours to radiation-based treatments.Acknowledgements
This study was funded by Terry Fox Research Institute (TFRI project 1034), Canadian Cancer Society Research Institute (CCSRI 701640) and Brain Canada grant (CCSRI 705083).References
1. Lam WW, Oakden W, Murray L, et al. Differentiation of normal and radioresistant prostate cancer xenografts using magnetization transfer-prepared MRI. Sci Rep. 2018;8(1):6-15. doi:10.1038/s41598-018-28731-0
2. Mehrabian H, Desmond KL, Soliman H, Sahgal A, Stanisz GJ. Differentiation between radiation necrosis and tumor progression using chemical exchange saturation transfer. Clin Cancer Res. 2017;23(14):3667-3675. doi:10.1158/1078-0432.CCR-16-2265
3. Desmond KL, Mehrabian H, Chavez S, et al. Chemical exchange saturation transfer for Predicting response to stereotactic radiosurgery in human brain metastasis. Magn Reson Med. 2016;00(April). doi:10.1002/mrm.26470
4. Mehrabian H, Myrehaug S, Soliman H, Sahgal A, Stanisz GJGJ. Quantitative Magnetization Transfer in Monitoring Glioblastoma (GBM) Response to Therapy. Sci Rep. 2018;8(1):2475. doi:10.1038/s41598-018-20624-6
5. Schuenke P, Windschuh J, Roeloffs V, Ladd ME, Bachert P, Zaiss M. Simultaneous mapping of water shift and B1(WASABI)—Application to field-Inhomogeneity correction of CEST MRI data. Magn Reson Med. 2017;77(2):571-580. doi:10.1002/mrm.26133
6. Henkelman RM, Huang X, Xiang QS, Stanisz GJ, Swanson SD, Bronskill MJ. Quantitative interpretation of magnetization transfer. Magn Reson Med. 1993;29:759-766.
7. Kim M, Gillen J, Landman BA, Zhou J, van Zijl PCM. Water saturation shift referencing (WASSR) for chemical exchange saturation transfer (CEST) experiments. Magn Reson Med. 2009;61(6):1441-1450.
Figures