0501
Influence of phosphate concentration on amine and amide chemical exchange saturation transfer (CEST) contrast1Brain Tumor Imaging Laboratory (BTIL), Center of Computer Vision and Imaging Biomarker, David Geffen School of Medicine, UCLA, Los Angeles, CA, United States, 2Department of Radiological Sciences, David Geffen School of Medicine, UCLA, Los Angeles, CA, United States, 3Department of Bioengineering, Henry Samueli School of Engineering and Applied Science, UCLA, Los Angeles, CA, United States
Synopsis
Effects of the catalytic in vivo chemical environment have often been neglected or underestimated in CEST-MRI studies. Phosphate is the predominant exchange catalyst in intracellular fluid and is essential for biosynthesis and bioenergetics. In this study, we evaluated the influence of phosphate on amine and amide CEST contrast using Bloch-McConnell simulations applied to physical phantom data. We demonstrate that amine proton exchange is greatly catalyzed by phosphate, under a physiological concentration range. We propose that catalytic agents should be considered as confounding factors in future CEST-MRI researches. This new dimension may also benefit the development of novel phosphate-sensitive imaging method.
INTRODUCTION
Phosphate is an essential building block for cell membranes, DNA, and proteins. Residing mostly within the cells, it can take the form of adenosine triphosphate (ATP), phosphocreatine, phosphate esters, or inorganic phosphate, serving as an important component of the energy metabolism, intracellular pH buffer, and kinase signaling1. In disease conditions such as cancer, increased extracellular and intracellular phosphate concentration has been reported, promoting cell proliferation2-3.Despite being the predominant intracellular proton exchange catalyst, the effect of phosphate on chemical exchange saturation transfer (CEST) remains largely understudied. CEST exploits the chemical exchange of labile protons on exogenous or endogenous molecules with water to create MR contrast4. CEST contrast can be influenced by many factors affect this chemical exchange rate, including pH- dependence for use in characterizing brain tumor biology5, early cerebral ischemic changes6, and pH mapping of the kidneys7.
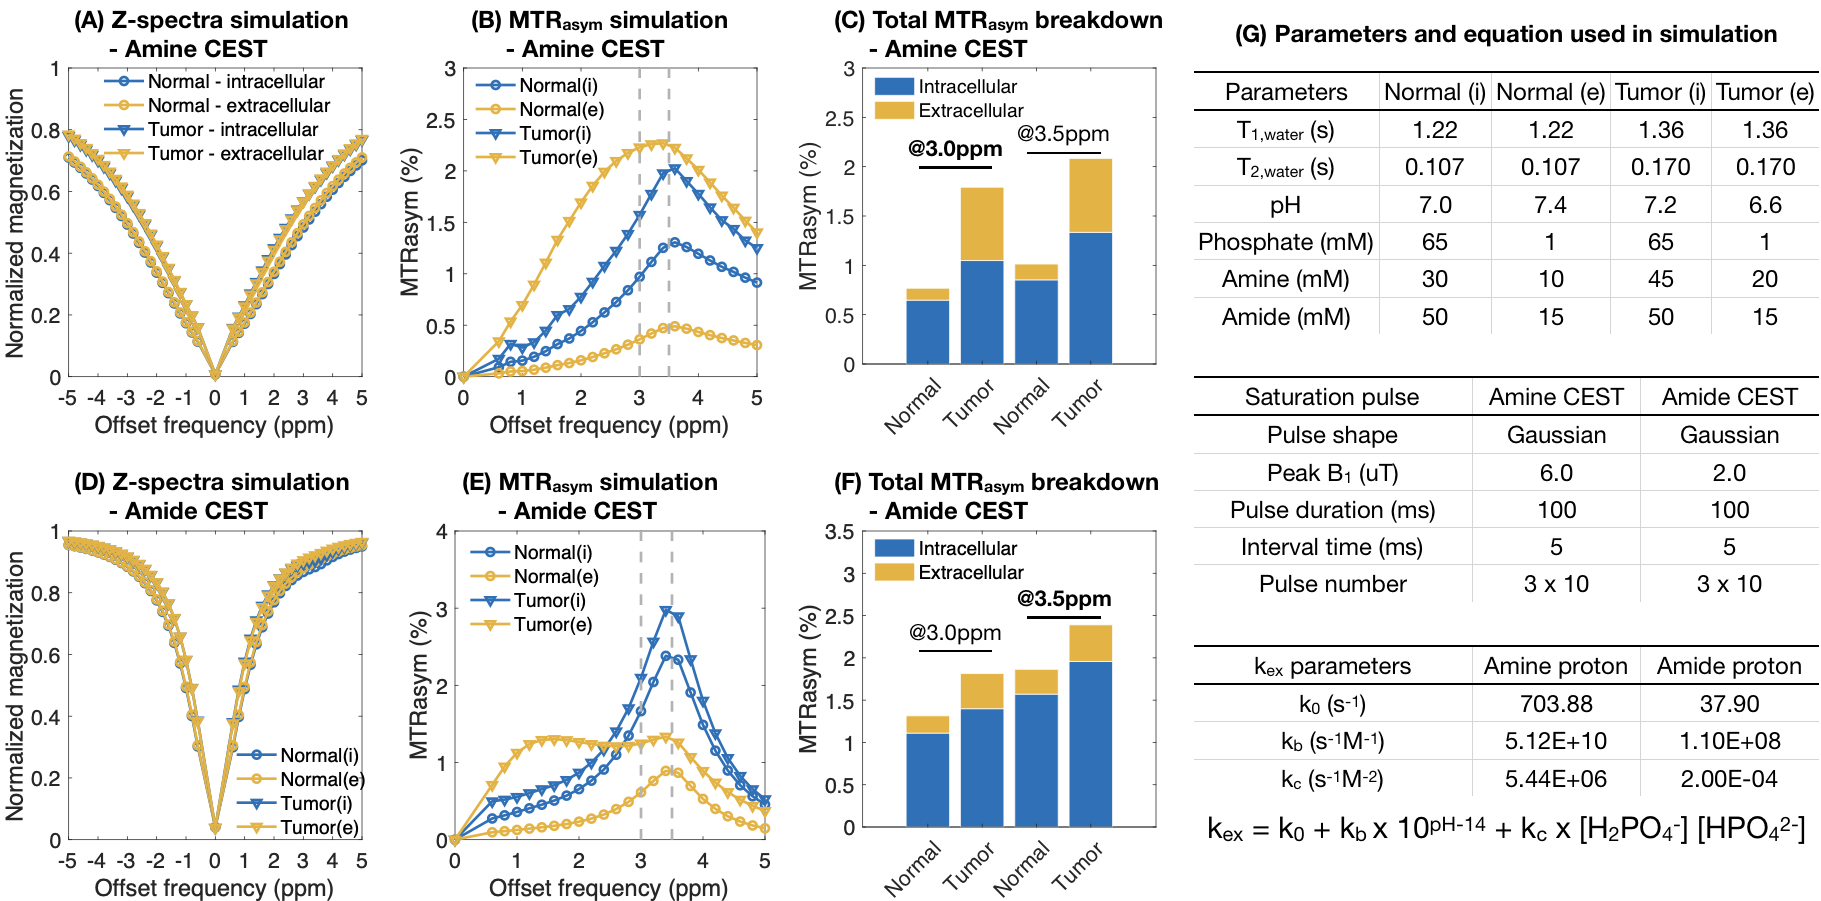
Phosphate has been reported to increase the exchange rate of amine (-NH2) and hydroxyl (-OH) protons by 10kHz under physiological condition8. The chemical exchange rate $$$k_{ex}$$$ can be expressed as $$$k_0+k_b\times10^{pH-14}+k_c\times[H_2PO_4^-][HPO_4^{2-}]$$$, where $$$k_0$$$, $$$k_b$$$, and $$$k_c$$$ represent baseline exchange rate, base-catalyzed rate constant, and phosphate-catalyzed rate constant, respectively. In the current study, we characterize the effect of phosphate concentration on two of the most widely used CEST approaches, amine CEST and amide proton transfer (APT), using physical simulations from phantom preparations. We hypothesized that phosphate would have differing effects on amine CEST and APT contrast, implying that amine CEST may be more sensitive to extracellular pH while APT may be more influenced by intracellular pH.
METHODS
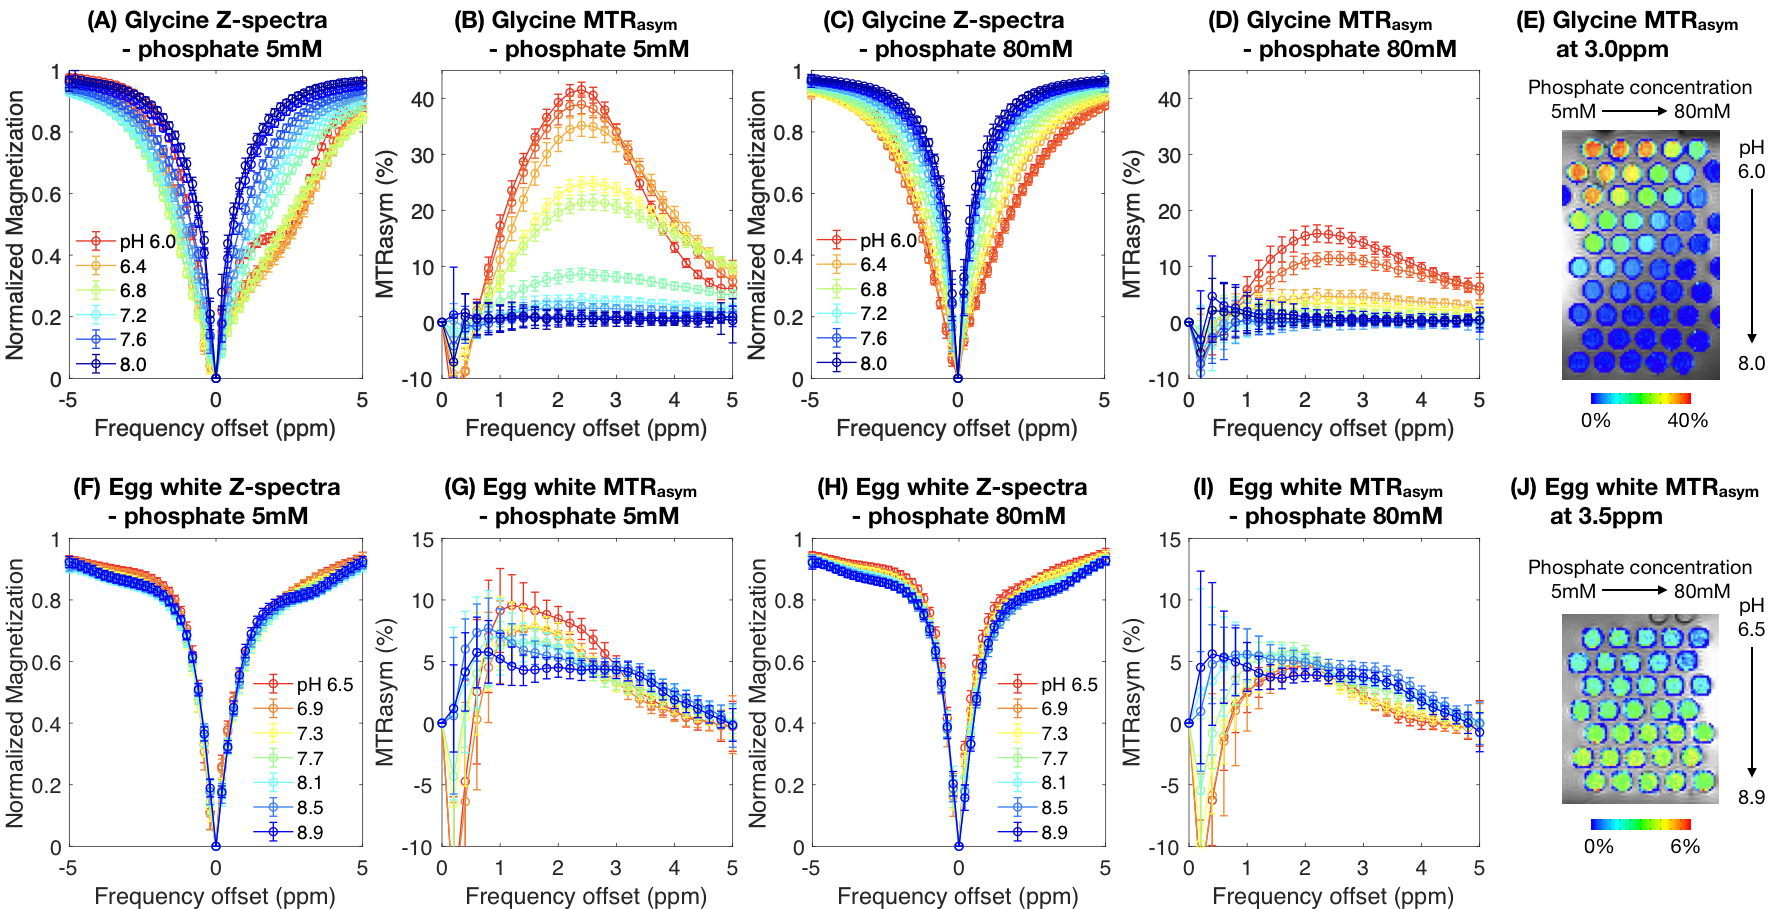
Phantom preparation: 55 amine CEST samples were prepared using 100mM glycine (Sigma-Aldrich, G8898), with 5 phosphate concentrations (5/10/20/40/80mM) and 11 pH (6.0-8.0 with 0.2 interval). 35 amide CEST samples were prepared using commercially available liquid egg white (10% protein), with the same 5 phosphate concentrations and 7 pH (6.5-8.9 with 0.4 interval). KH2PO4 and K2HPO4 concentrations were calculated from phosphate pKa, desired pH, and total phosphate concentration. pH was measured after mixing and adjusted using NaOH and HCl.CEST-MRI: CEST images were collected with multi-echo CEST-EPI sequence9 on a Siemens 3T scanner (Prisma), with off-resonance saturation of 30x100ms Gaussian pulses using a peak amplitude of 6µT for amine sensitivity and 2µT for APT. Post processing consisted of motion correction, Z-spectral based B0 correction, followed by quantification of magnetization transfer ratio asymmetry (MTRasym) at the amine proton resonance frequency (3.0ppm) for glycine and the amide proton resonance frequency (3.5ppm) for the egg white protein. Mean and standard deviation of MTRasym within each sample were quantified.
Parameter Fitting: The evolution of magnetization was simulated using the Bloch-McConnell equations applied to the mean MTRasym measurements from all phantom samples. The amine and amide proton exchange rate parameters $$$k_0$$$, $$$k_b$$$, and $$$k_c$$$ that yielded the best-fit to the experimental data using least squares regression were retained and used for subsequent analyses.
Computer simulation: Four tissue compartments were modeled in the current study, including the intra- and extracellular compartments for both normal brain and brain tumors. The CEST contrast was calculated assuming 2/3 of the water proton signal arose from intracellular space and 1/3 from extracellular space. Simulation parameters were summarized in Figure 3G8,10.
RESULTS AND DISCUSSIONS
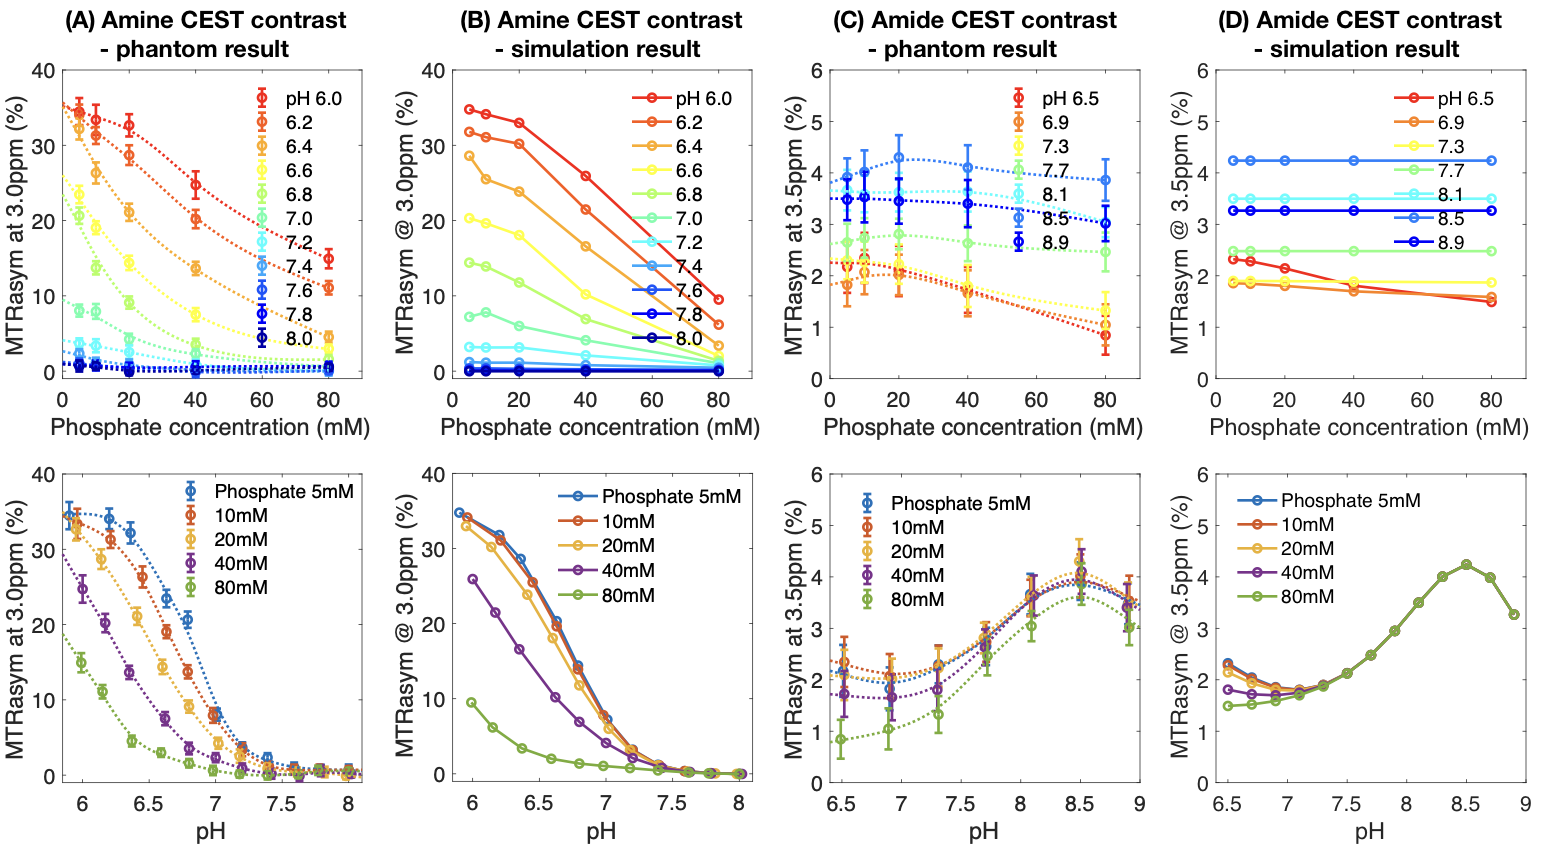
Both pH and phosphate concentration affected the CEST characteristics of glycine (Figure 1A-E) and egg whites (Figure 1F-J). With a phosphate concentration of 80mM, the high MTRasym at acidic pH for glycine is largely reduced, owing to the increased proton exchange rate. However, changes were only observed in the range of 1.0ppm to 3.0ppm in egg white protein. This suggests APT may be less affected by phosphate concentration, and other labile proton groups including amine may contribute to the observed change.Bloch-McConnell simulations applied to physical phantom measurements were used to quantify catalytic power of phosphate on the proton exchange rate (Figure 2A-D). Results confirmed the high dependency of amine CEST contrast ($$$k_c=5.44\times10^6$$$) and low dependency of amide CEST contrast on phosphate concentration ($$$k_c=0.0002$$$), supporting a previous report from Liepinsh8. Using these same estimated parameters from the physical phantoms, the influence of phosphate concentration on intra- and extracellular water within normal brain or tumor tissue were evaluated (Figure 3). Simulations suggest intracellular amine CEST contrast is suppressed due to an increase in proton exchange rate, resulting in higher contrast arising from the extracellular space (61%) and making it more sensitive to changes in extracellular pH that may occur as a result of cancer. On the contrary, phosphate has little effect on APT contrast, leading to contrast primarily arising from intracellular water (73%).
CONCLUSION
Amine CEST contrast is greatly influenced by phosphate concentration, which leads to a higher sensitivity to extracellular microenvironment, while APT is not as affected by phosphate leading to mostly intracellular sensitivity. Results suggest phosphate should be taken into account in future CEST-MRI research, potentially leading to new opportunities including non-invasive imaging approaches specific to phosphate biochemistry.Acknowledgements
No acknowledgement found.References
1. Takeda E, Taketani Y, et al. The regulation and function of phosphate in the human body. Biofactors. 2004;21(1‐4):345-55.
2. Bobko AA, Eubank TD, et al. Interstitial inorganic phosphate as a tumor microenvironment marker for tumor progression. Scientific reports. 2017 Jan 24;7:41233.
3. Qian Y, Wang X, Li Y, Cao Y, Chen X. Extracellular ATP a new player in cancer metabolism: NSCLC cells internalize ATP in vitro and in vivo using multiple endocytic mechanisms. Molecular Cancer Research. 2016 Nov 1;14(11):1087-96.
4. Van Zijl PC, Yadav NN. Chemical exchange saturation transfer (CEST): what is in a name and what isn't? Magnetic resonance in medicine. 2011 Apr;65(4):927-48.
5. Harris RJ, Cloughesy TF, et al. pH-weighted molecular imaging of gliomas using amine chemical exchange saturation transfer MRI. Neuro-oncology. 2015 Jun 24;17(11):1514-24.
6. Zaiss M, Xu J, et al. Inverse Z‐spectrum analysis for spillover‐, MT‐, and T1‐corrected steady‐state pulsed CEST‐MRI–application to pH‐weighted MRI of acute stroke. NMR in biomedicine. 2014 Mar;27(3):240-52.
7. Dimitrov I, Takahashi M, et al. In-vivo human kidney pH mapping at 3T using time-interleaved parallel RF transmission CEST. In Proceeding of the 20th Annual Meeting and Exhibition, International Society for Magnetic Resonance in Medicine 2012 May.
8. Liepinsh E, Otting G. Proton exchange rates from amino acid side chains—implications for image contrast. Magnetic resonance in medicine. 1996 Jan;35(1):30-42.
9. Harris RJ, Yao J, et al. Simultaneous p H‐sensitive and oxygen‐sensitive MRI of human gliomas at 3 T using multi‐echo amine proton chemical exchange saturation transfer spin‐and‐gradient echo echo‐planar imaging (CEST‐SAGE‐EPI). Magnetic resonance in medicine. 2018 Nov;80(5):1962-78.
10. Hall JE. Guyton and Hall textbook of medical physiology e-Book. Elsevier Health Sciences; 2015 May 31.
Figures