0500
Fluid suppression in CEST imaging affects predominantly IDH-mutant 1p/19q retained gliomas with T2-FLAIR mismatch1Olea Medical, La Ciotat, France, 2Lysholm Dept of Neuroradiology, University College of London Hospitals NHS Foundation Trust, London, United Kingdom, 3Institute of Neurology UCL, London, United Kingdom, 4National Hospital for Neurology & Neurosurgery, University College of London Hospitals NHS Foundation Trust, London, United Kingdom, 5Department of Neurodegenerative Disease, Institute of Neurology UCL, London, United Kingdom, 6Biomedical Engineering Department, School of Biomedical Engineering and Imaging Sciences, King's College London, London, United Kingdom
Synopsis
CEST is a novel MR technique helpful for predicting IDH and 1p/19q status in gliomas. The asymmetry-based methods however are sensitive to fluid signal and recent studies have shown that a significant proportion of IDH-mutant 1p/19q retained gliomas have T2-FLAIR mismatch, indicating the presence of a more fluid microenvironment. This work shows how fluid-suppressed CEST imaging metrics have an impact on amide and amine signals in glioma, with highest effect on IDH-mutant 1p/19q retained with T2-FLAIR mismatch. The combined use of asymmetry-based and fluid-suppressed CEST metrics could be a valuable tool for glioma staging more robust than asymmetry-based metrics alone.
Introduction
One of the relevant clinical application of Chemical Exchange Saturation Transfer (CEST) MRI is the relative measurement of the concentration of endogenous amide and amine groups in brain gliomas1. These signals originated from proteins and peptides in the brain tissue have been shown to increase in tumour regions2. Amide CEST has shown promising results in the context of glioma grading3,4. Lately, some works showed the potential of amide and amine CEST as imaging markers for identifying Isocitrate Dehydrogenase (IDH) mutation status preoperatively5,6. Usually, to extract endogenous CEST signals in Amide Proton Transfer weighted (APTw) MRI acquisitions, asymmetry-based metrics are applied to the CEST spectrum (or Z-Spectrum)2,7. However, a recent study has addressed the issue of compartments with fluid content - like in cyst, haemorrhage, necrosis - and underlined the importance of fluid-suppressed metrics for an improved image reading8. Other recent studies9 have also proposed a "T2-FLAIR mismatch" as a biomarker for identifying with 100% positive predictive value IDH-mutant 1p/19q retained gliomas. In this study, we show that a novel fluid-suppressed metric efficiently removes cystic signal and affect the amides and amine components differently in the solid tumour component, with the largest effect observed in IDH-mutant 1p/19q retained tumours.Methods
Patients: A total of 35 patients were included in the analysis: 9 patients with IDH-wildtype, 16 with IDH-mutant 1p/19q-retained (12 with "T2-FLAIR mismatch"), 10 with IDH-mutant 1p/19q co-deleted (Table 1). Acquisition protocol: T1w, T2w, FLAIR, CEST, T1wE (after gadolinium injection) imaging data were acquired on a 3T whole-body MRI system Siemens MAGNETOM Prisma. For the CEST study, a single slice was acquired, positioned axially at the location of the largest tumour cross-section. Three APTw acquisitions were performed with three different B1 values = 1.7µT,2.0µT,2.3µT, to allow for B1 inhomogeneity correction. Each acquisition was composed of an initial normalisation image and 37 offsets equally spaced, from ±4.5ppm to 0ppm in steps of 0.25ppm. A B1 map was then acquired. An experienced neuroradiologist outlined on FLAIR images: (1) the solid tumour excluding cystic, hemorrhagic and necrotic components, (2) the cysts, and (3) the contralateral white matter.Post-processing: A prototype version of CEST data processing software created by Olea Medical® for the Horizon 2020 project GLINT (number 667510) was used to process the CEST acquisitions and to plot the APTw maps. After Z-Spectra based B0 correction10, the Z-Spectra at 2.0µT were B1-corrected through an exponential fitting11. The non-punctual metrics proposed in7 were adapted to generate two APTw maps with improved detection of the CEST contrast for B0-B1-corrected Z-Spectra at 2.0µT. APTw maps were obtained using two equations. Equation 1 considers only the asymmetry-average of the Z-Spectra in a specific offset range:$$APT_w=\frac{\int_{-\Delta\omega_2}^{-\Delta\omega_1}\widetilde{Z}(\Delta\omega)d\omega-\int_{\Delta\omega_1}^{\Delta\omega_2}\widetilde{Z}(\Delta\omega)d\omega}{\Delta\omega_2-\Delta\omega_1};\hspace{1cm}(1)$$ while Equation 2 attenuates also the fluid signal based on the shape of Z-spectrum:$$F.S.APT_w=\frac{\int_{-\Delta\omega_2}^{-\Delta\omega_1}\widetilde{Z}(\Delta\omega)d\omega-\int_{\Delta\omega_1}^{\Delta\omega_2}\widetilde{Z}(\Delta\omega)d\omega}{\Delta\omega_2-\Delta\omega_1}\cdot(1-\frac{\int_{-\Delta\omega_2}^{-\Delta\omega_1}\widetilde{Z}(\Delta\omega)d\omega}{\Delta\omega_2-\Delta\omega_1} )\cdot2\cdot\alpha;\hspace{1cm}(2)$$ where $$$\widetilde{Z}$$$ is the linear-interpolated Z-Spectrum, $$$\Delta\omega_1,\Delta\omega_2$$$ the offsets and $$$\alpha$$$ the regularisation parameter - to yield similar values in normal-appearing white/grey matter, in both equations. In this work, the endogenous CEST signal is explored in two offset ranges: the amine ($$$\Delta\omega_1=1.5ppm,\Delta\omega_2=2.5ppm,\alpha=0.75$$$) and the amide ones ($$$\Delta\omega_1=3ppm,\Delta\omega_2=4ppm,\alpha=1$$$). Statistics: The average CEST signal in the solid tumour was normalised subtracting the values from the contralateral white matter. The values for the two metrics were then subtracted and differences from 0 were assessed with a one-sample t-test were considered significant if p<0.05.
Results
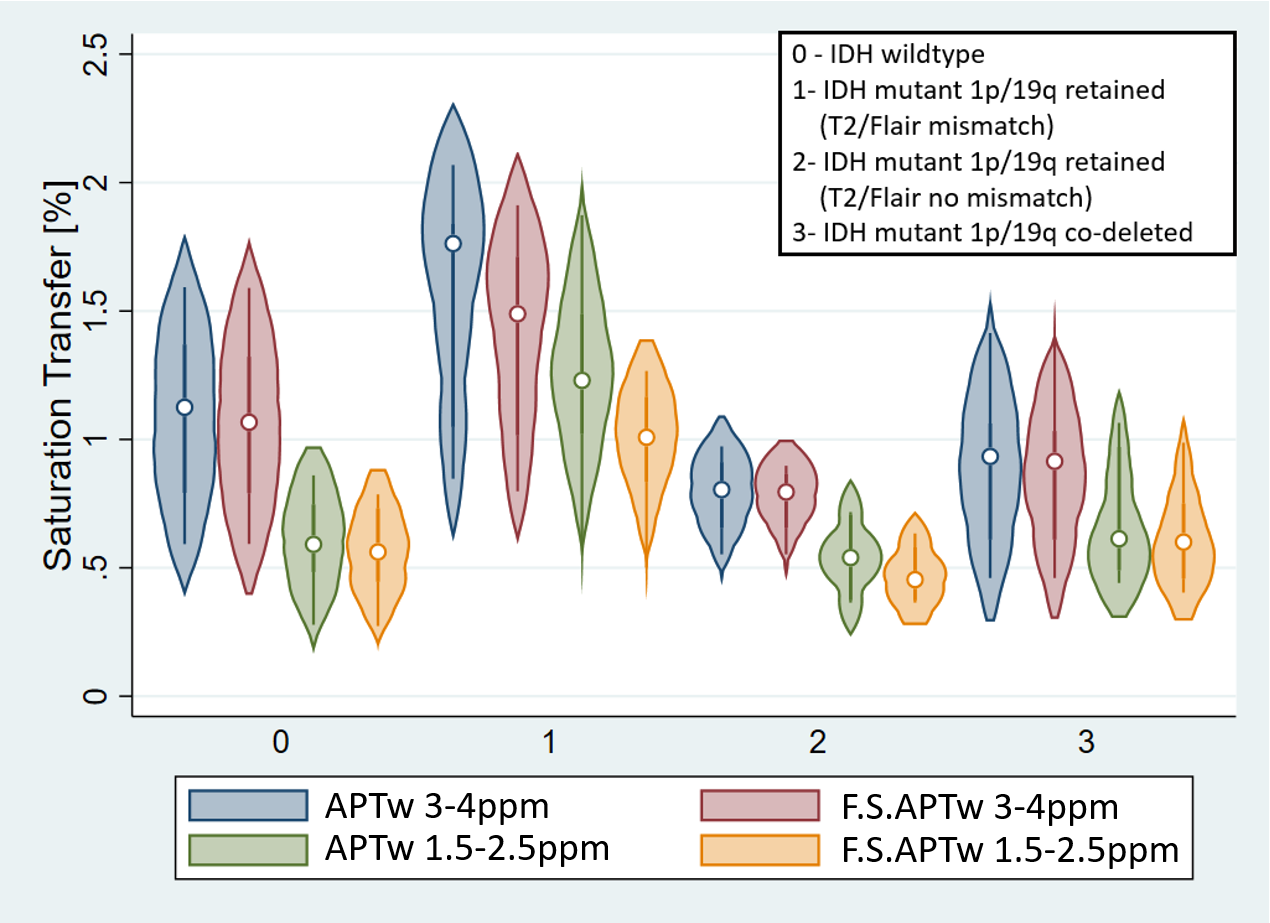
The average-Z-spectrum of the IDH-mutant 1p/19q glioma with "T2-FLAIR mismatch" has considerably higher values compared to the IDH-mutant 1p/19q retained without "T2-FLAIR mismatch", IDH-wild type, IDH-mutant 1p/19q co-deleted ones, due to its partly-fluid tissue (Figure 1). However, it does not reach the elevated values of the cyst full-fluid compartment. The APTw and F.S.APTw maps lead to substantial differences in fluid compartments (Figure 2), and IDH-mutant 1p/19 retained gliomas in both the amide and amine ranges (Figure 3) but not in the solid IDH-mutant 1p/19q co-deleted tumour (Figure 2). We found (Figure 4) that F.S.APTw metric does not affect the amide signal in IDH-wildtype (p=0.056), IDH-mutant 1p/19q retained without "T2-FLAIR mismatch" (p=0.28) and IDH-mutant 1p/19q co-deleted (p=0.079) and it does not affect the amine signal in the IDH-mutant 1p/19q retained without "T2-FLAIR" mismatch (p=0.21). The metric has a tendency for lower values for the amine signal in IDH-wildtype (p=0.027) and IDH-mutant 1p/19q codeleted (p=0.021) and is profoundly lower in IDH-mutant 1p/19q retained with "T2-FLAIR mismatch" for both the amide (p=0.0028) and the amine signal (p=0.0001).Discussion and Conclusion
Our results show lower fluid-suppressed APTw values with respect to the asymmetry-based APTw metric for the amide component only in the IDH-mutated 1p/19q retained gliomas with "T2-FLAIR mismatch" and lower values for the amine component in all glioma subgroups except the IDH-mutated 1p/19q retained gliomas without "T2-FLAIR mismatch". This seems to suggest that the amine component is generally present in a more fluid tumour microenvironment and that the IDH-mutated 1p/19q retained gliomas with "T2-FLAIR mismatch" have a more fluid-like microenvironment. Further histopathological analyses in a larger cohort, together with acquisitions at low saturation power12 and Lorentzian-Fitting-based metrics12 are needed to better understand the contribution of fluid, amine, amide and NOE signals and their implications for understanding the glioma microenvironment. The combination of asymmetry-based and fluid-suppressed CEST metrics have the potential to provide more robust biomarker for glioma staging.Acknowledgements
This project has received funding from the European Union’s Horizon 2020 research and innovation programme under grant agreement No 667510, the Department of Health’s NIHR-funded Biomedical Research Centre at University College London. SB and LM are supported by the National Institute of Health Research Biomedical Research Council, UCL Hospitals NHS Trust. EDV is supported by the Wellcome/EPSRC Centre for Medical Engineering [WT 203148/Z/16/Z].References
- Wu, B., Warnock, G., Zaiss, M., Lin, C., Chen, M., Zhou, Z., Mu, L., Nanz, D., Tuura, R. and Delso, G., 2016. An overview of CEST MRI for non-MR physicists. EJNMMI physics, 3(1), p.19.
- Zhou, J., Lal, B., Wilson, D.A., Laterra, J. and van Zijl, P.C., 2003. Amide proton transfer (APT) contrast for imaging of brain tumors. Magnetic Resonance in Medicine: An Official Journal of the International Society for Magnetic Resonance in Medicine, 50(6), pp.1120-1126.
- Togao, O., Keupp, J., Hiwatashi, A., Yamashita, K., Kikuchi, K., Suzuki, Y., Suzuki, S.O., Iwaki, T., Hata, N. and Mizoguchi, M., 2013. Amide proton transfer imaging of adult diffuse gliomas: correlation with histopathological grades. Neuro-oncology, 16(3), pp.441-448.
- Sakata, A., Okada, T., Yamamoto, A., Kanagaki, M., Fushimi, Y., Okada, T., Dodo, T., Arakawa, Y., Schmitt, B., Miyamoto, S. and Togashi, K., 2015. Grading glial tumors with amide proton transfer MR imaging: different analytical approaches. Journal of neuro-oncology, 122(2), pp.339-348.
- Jiang, S., Zou, T., Eberhart, C.G., Villalobos, M.A., Heo, H.Y., Zhang, Y., Wang, Y., Wang, X., Yu, H., Du, Y. and van Zijl, P.C., 2017. Predicting IDH mutation status in grade II gliomas using amide proton transfer‐weighted (APTw) MRI. Magnetic resonance in medicine, 78(3), pp.1100-1109.
- Yao, J., Chakhoyan, A., Nathanson, D.A., Yong, W.H., Salamon, N., Raymond, C., Mareninov, S., Lai, A., Nghiemphu, P.L., Prins, R.M. and Pope, W.B., 2019. Metabolic characterization of human IDH mutant and wild type gliomas using simultaneous pH-and oxygen-sensitive molecular MRI. Neuro-oncology.
- Terreno, E., Stancanello, J., Longo, D., Castelli, D.D., Milone, L., Sanders, H.M., B. Kok, M., Uggeri, F. and Aime, S., 2009. Methods for an improved detection of the MRI‐CEST effect. Contrast media & molecular imaging, 4(5), pp.237-247.
- Togao O., Keupp J., 2018. Magnetization Transfer Ratio based Metric for APTw or CESTw MRI Suppressing Signal from Fluid Compartments - Initial Application to Glioblastoma Assessment. Abstract for ISMRM 2018.
- Broen, M.P., Smits, M., Wijnenga, M.M., Dubbink, H.J., Anten, M.H., Schijns, O.E., Beckervordersandforth, J., Postma, A.A. and van den Bent, M.J., 2018. The T2-FLAIR mismatch sign as an imaging marker for non-enhancing IDH-mutant, 1p/19q-intact lower-grade glioma: a validation study. Neuro-oncology, 20(10), pp.1393-1399.
- Stancanello, J., Terreno, E., Castelli, D.D., Cabella, C., Uggeri, F. and Aime, S., 2008. Development and validation of a smoothing‐splines‐based correction method for improving the analysis of CEST‐MR images. Contrast media & molecular imaging, 3(4), pp.136-149.
- Windschuh, J., Zaiss, M., Meissner, J.E., Paech, D., Radbruch, A., Ladd, M.E. and Bachert, P., 2015. Correction of B1‐inhomogeneities for relaxation‐compensated CEST imaging at 7 T. NMR in biomedicine, 28(5), pp.529-537.
- Deshmane, A., Zaiss, M., Lindig, T., Herz, K., Schuppert, M., Gandhi, C., Bender, B., Ernemann, U. and Scheffler, K., 2019. 3D gradient echo snapshot CEST MRI with low power saturation for human studies at 3T. Magnetic resonance in medicine, 81(4), pp.2412-2423.
Figures
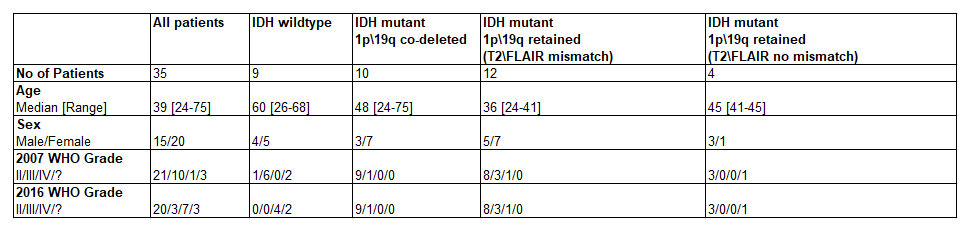
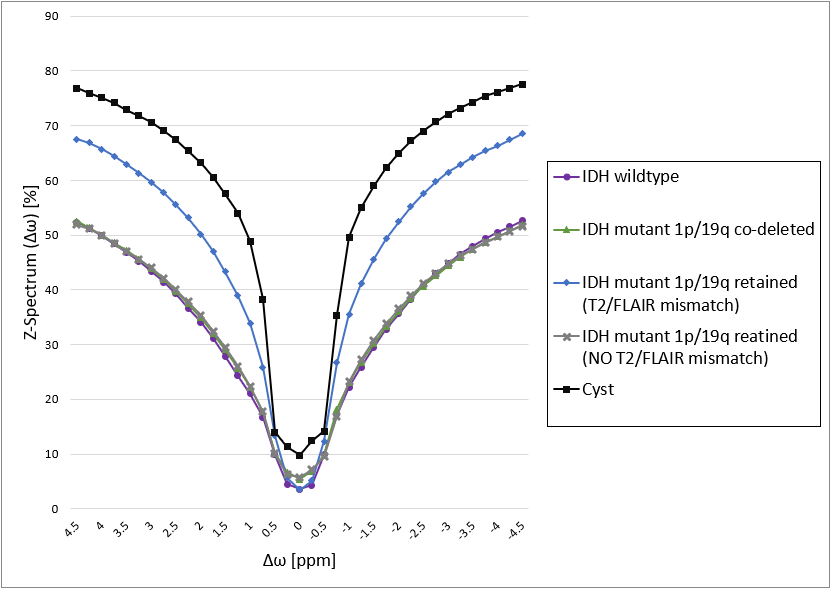
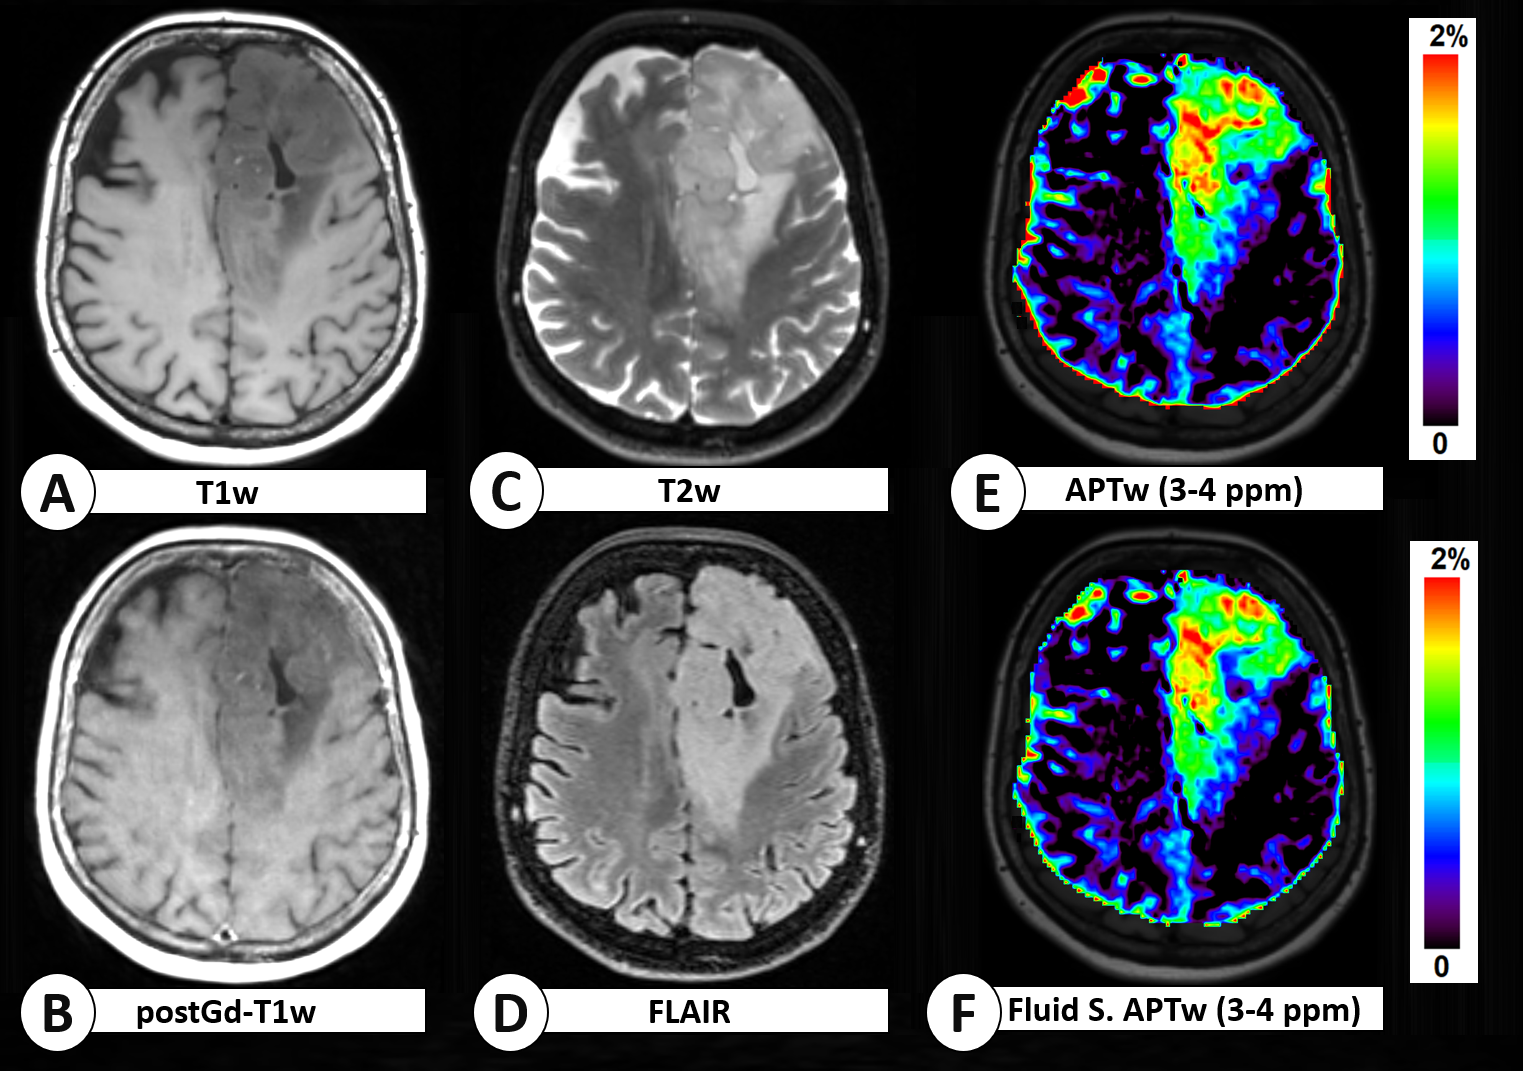
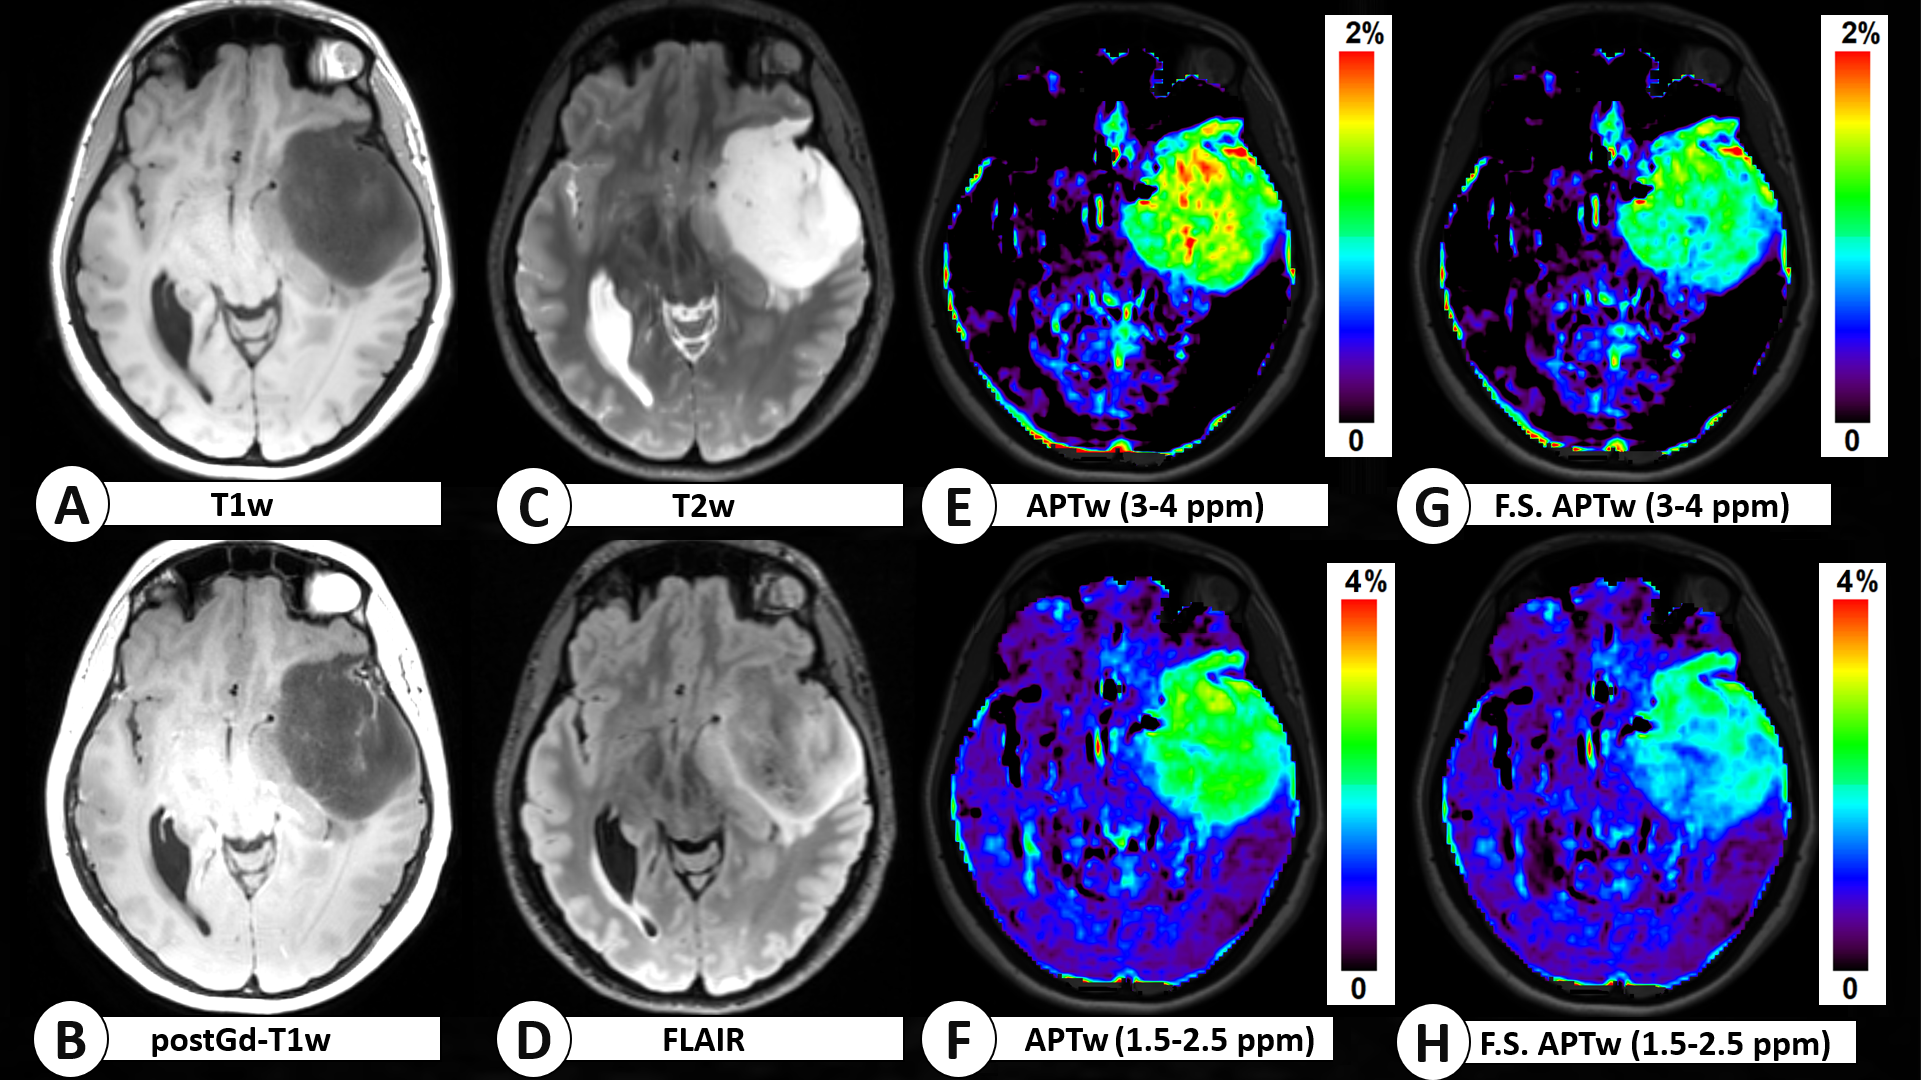
Figure 3: Structural and APTw maps of a patient with IDH-mutant 1p/19q retained glioma with "T2-FLAIR mismatch". The signal mismatch is visible in T2w and FLAIR maps (C,D). The CEST signals in the tumour region - in the amine and amide range - display a significant decrease between the asymmetry-based APTw maps (E,F) and the fluid-suppressed APTw maps (G,H), indicating that probably part of their signal was given by the fluid component of the tumour tissue. All APTw maps are skull-stripped. Some outliers near to the skull area are masked for improved reading. APTw values are expressed in%.