0499
Understanding the magnetization transfer pathway for water-based detection of the aliphatic protons in glycogen1The Russell H. Morgan Department of Radiology, The Johns Hopkins University School of Medicine, Baltimore, MD, United States, 2F.M. Kirby Research Center for Functional, Brain Imaging, Kennedy Krieger Institute, Baltimore, MD, United States
Synopsis
Recently a new MRI method was developed for the sensitivity enhanced detection of glycogen based on magnetization transfer between glycogen aliphatic protons and water, yet the mechanism of this transfer pathway is still not well understood. Here, we show that the magnetization transfer occurs via the relayed-NOE (rNOE) CEST effect. A theoretical model is proposed to quantitatively describe the rNOE signal in these magnetization transfer MRI experiments. This study provides insight into the rNOE mechanism that commonly occurs in magnetization transfer MRI on systems such as proteins and carbohydrate polymers.
Introduction
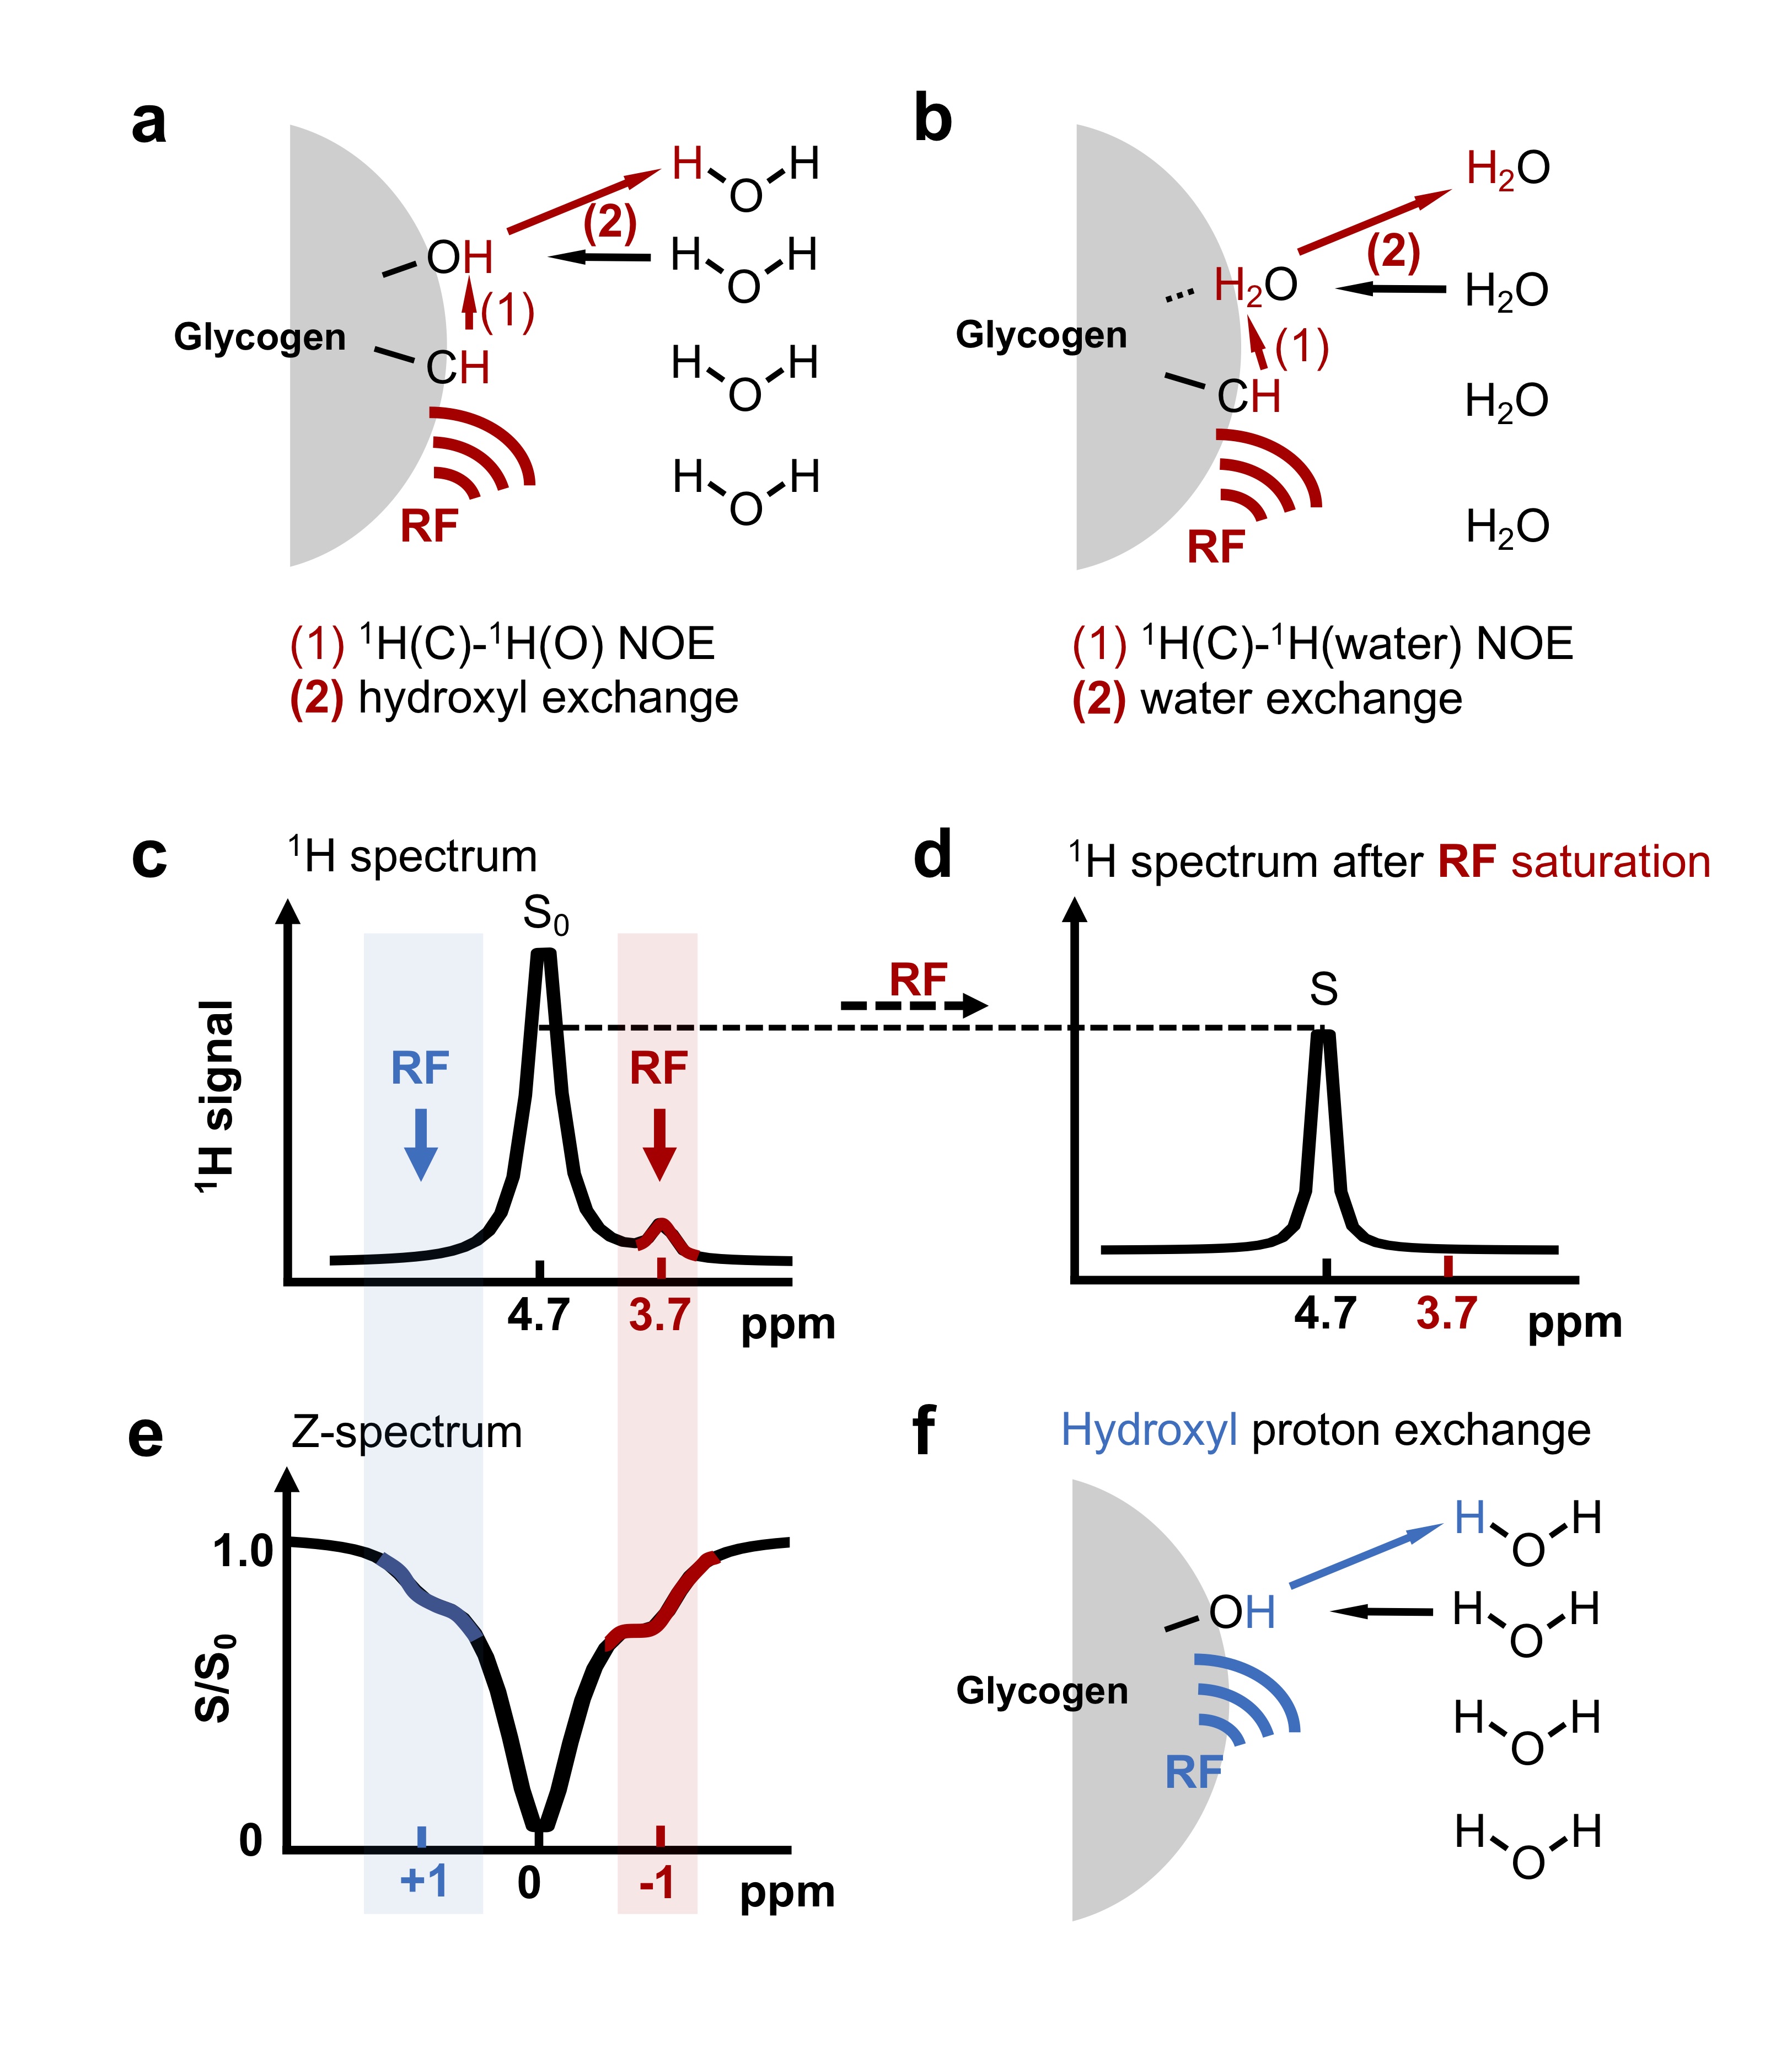
Recently a new MRI method was developed for sensitivity enhanced detection of glycogen based on magnetization transfer between glycogen aliphatic protons and water (glycoNOE, Fig. 1), opening up opportunities to image glycogen at high spatial and temporal resolutions in vivo. 1 Nevertheless, the glycoNOE magnetization transfer mechanism is still uncertain as multiple pathways can in principle contribute (Figs. 1a, b). 2 Here we report direct evidence showing that the glycoNOE is primarily via the relayed-NOE (rNOE) 3,4 CEST mechanism (Fig. 1a). The rNOE CEST mechanism has been studied in proteins, 2,4,5 but the rNOE mechanism in carbohydrates like glycogen is not well understood. Here we use a simplified two-step magnetization transfer model to quantitatively describe the rNOE process in glycogen.Materials and Methods
Oyster glycogen (Sigma, St. Louis, USA) was dissolved into Phosphate-buffered saline (PBS) prepared with either 95% H2O/5% D2O or 95% D2O/5% H2O (to slow down hydroxyl exchange 6) and pH-adjusted 7. NMR experiments were conducted in a 17.6 T Bruker Avance III (Bruker, Ettlingen, Germany) scanner at 20°C. In each TR of 16 s (in 95% H2O/5% D2O) or 66 s (95% D2O/5% H2O), magnetic labelling of protons was achieved with a 6 s (95% H2O/5% D2O) or 16 s (95% D2O/5% H2O) pre-saturation pulse, respectively, and with $$$B_1$$$ ranging from 0.12 to 1 µT. $$$T_1$$$ values of water in the two PBS solutions (95% D2O/5% H2O and 95% H2O/5% D2O ) were measured using an inversion recovery pulse. Z-spectra were fitted to multiple Lorentizan shapes 8 to obtain the different signal intensities.Results
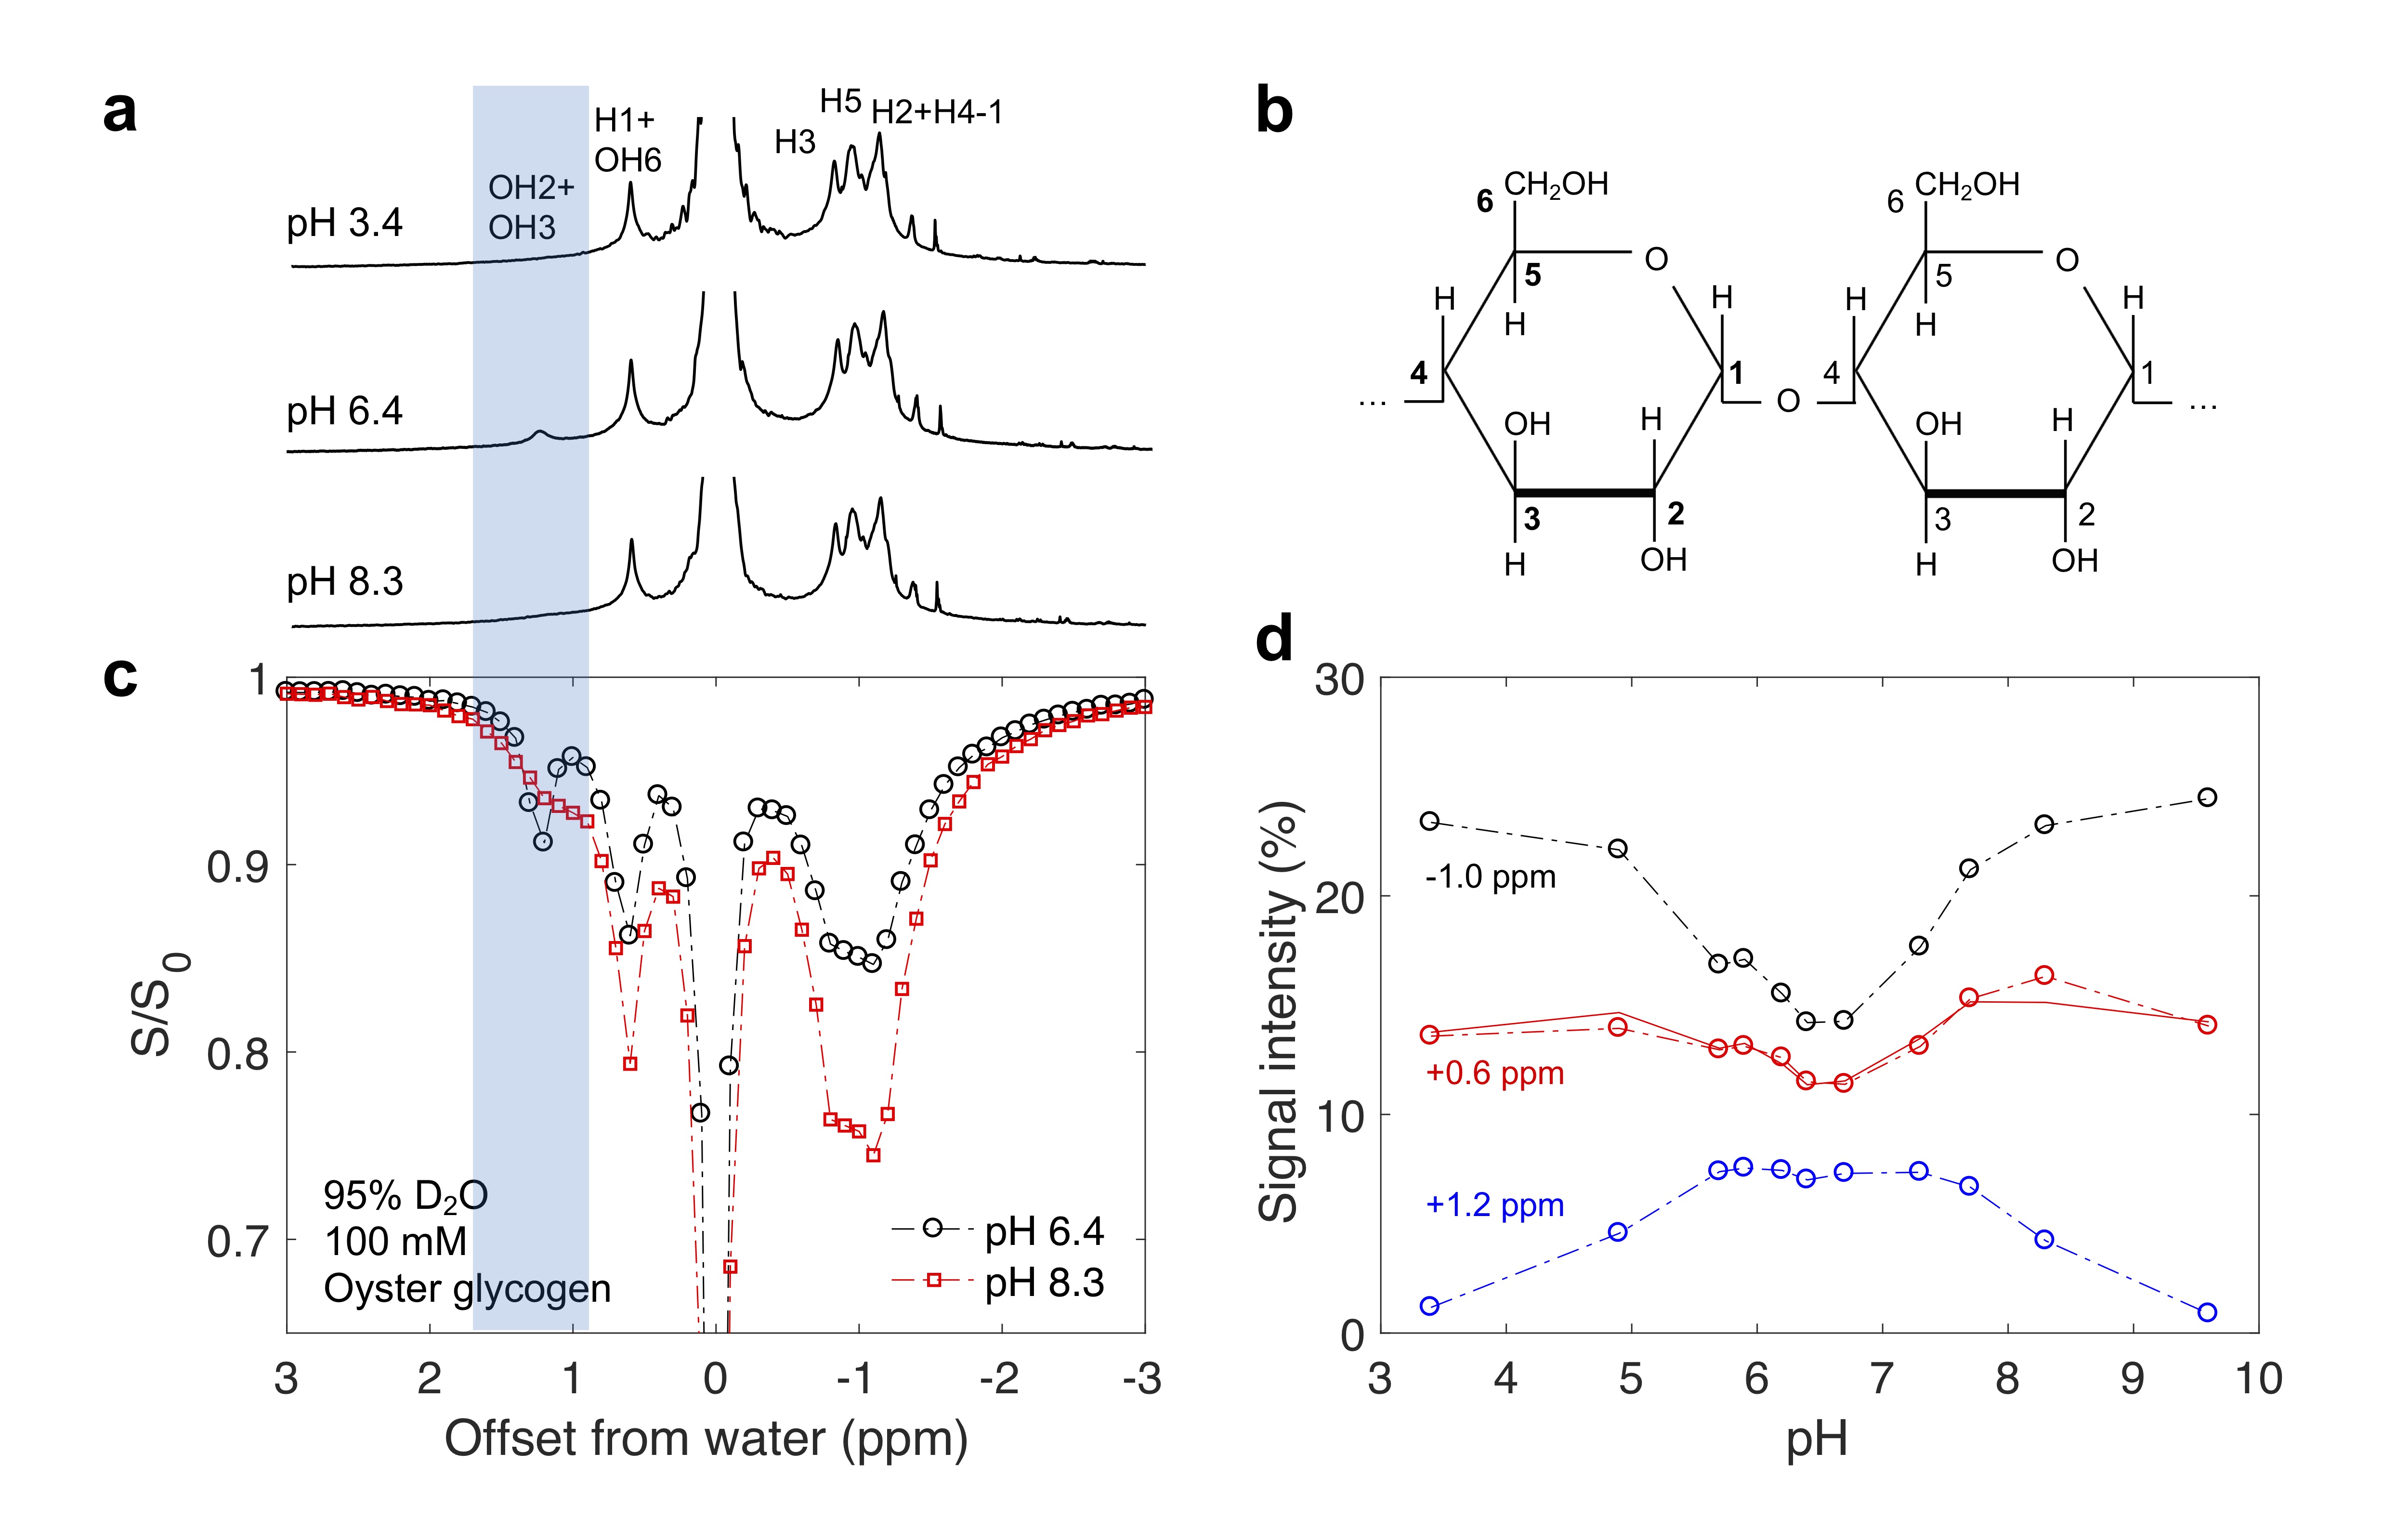
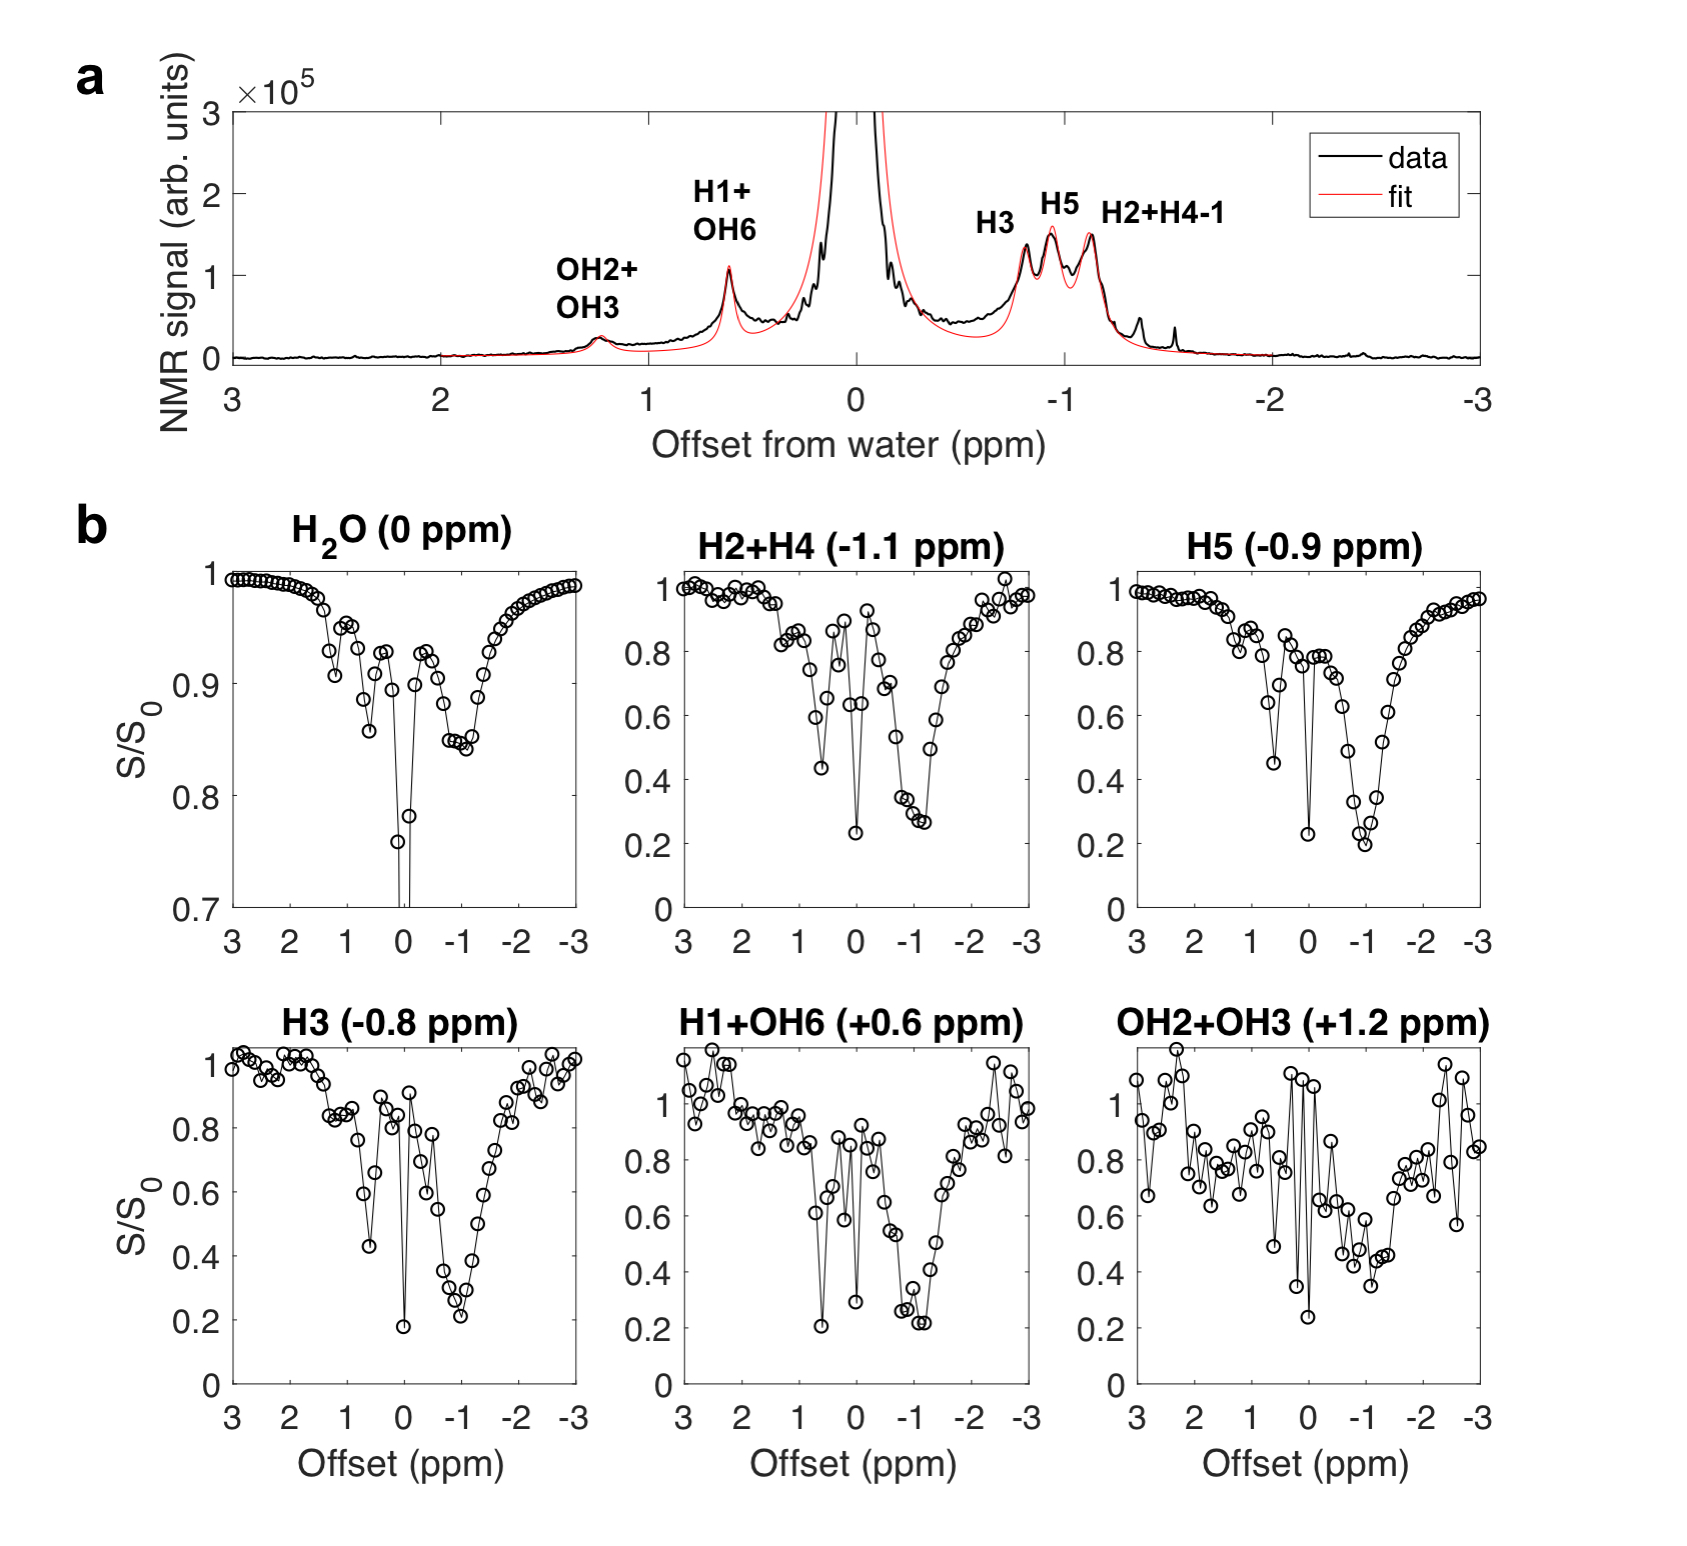
In the Z-spectra (Fig. 2c) for glycogen in D2O, a pH dependence (Fig. 2c, d) was observed for the intensity of peaks at +1.2 ppm (hydroxyl protons OH2+OH3) 9, +0.6 ppm (H1 NOE + OH6 CEST) 1,9,10, and -1 ppm (glycoNOE) 1. Since water binding (Fig. 1b) is not expected to depend on pH, this suggests that glycoNOEs occur via the rNOE transfer pathway.Among the glycogen proton network, saturation of one proton type causes signal reduction in another (Fig. 3), demonstrating that each proton pool is connected with the rest via NOE or/and chemical exchange.
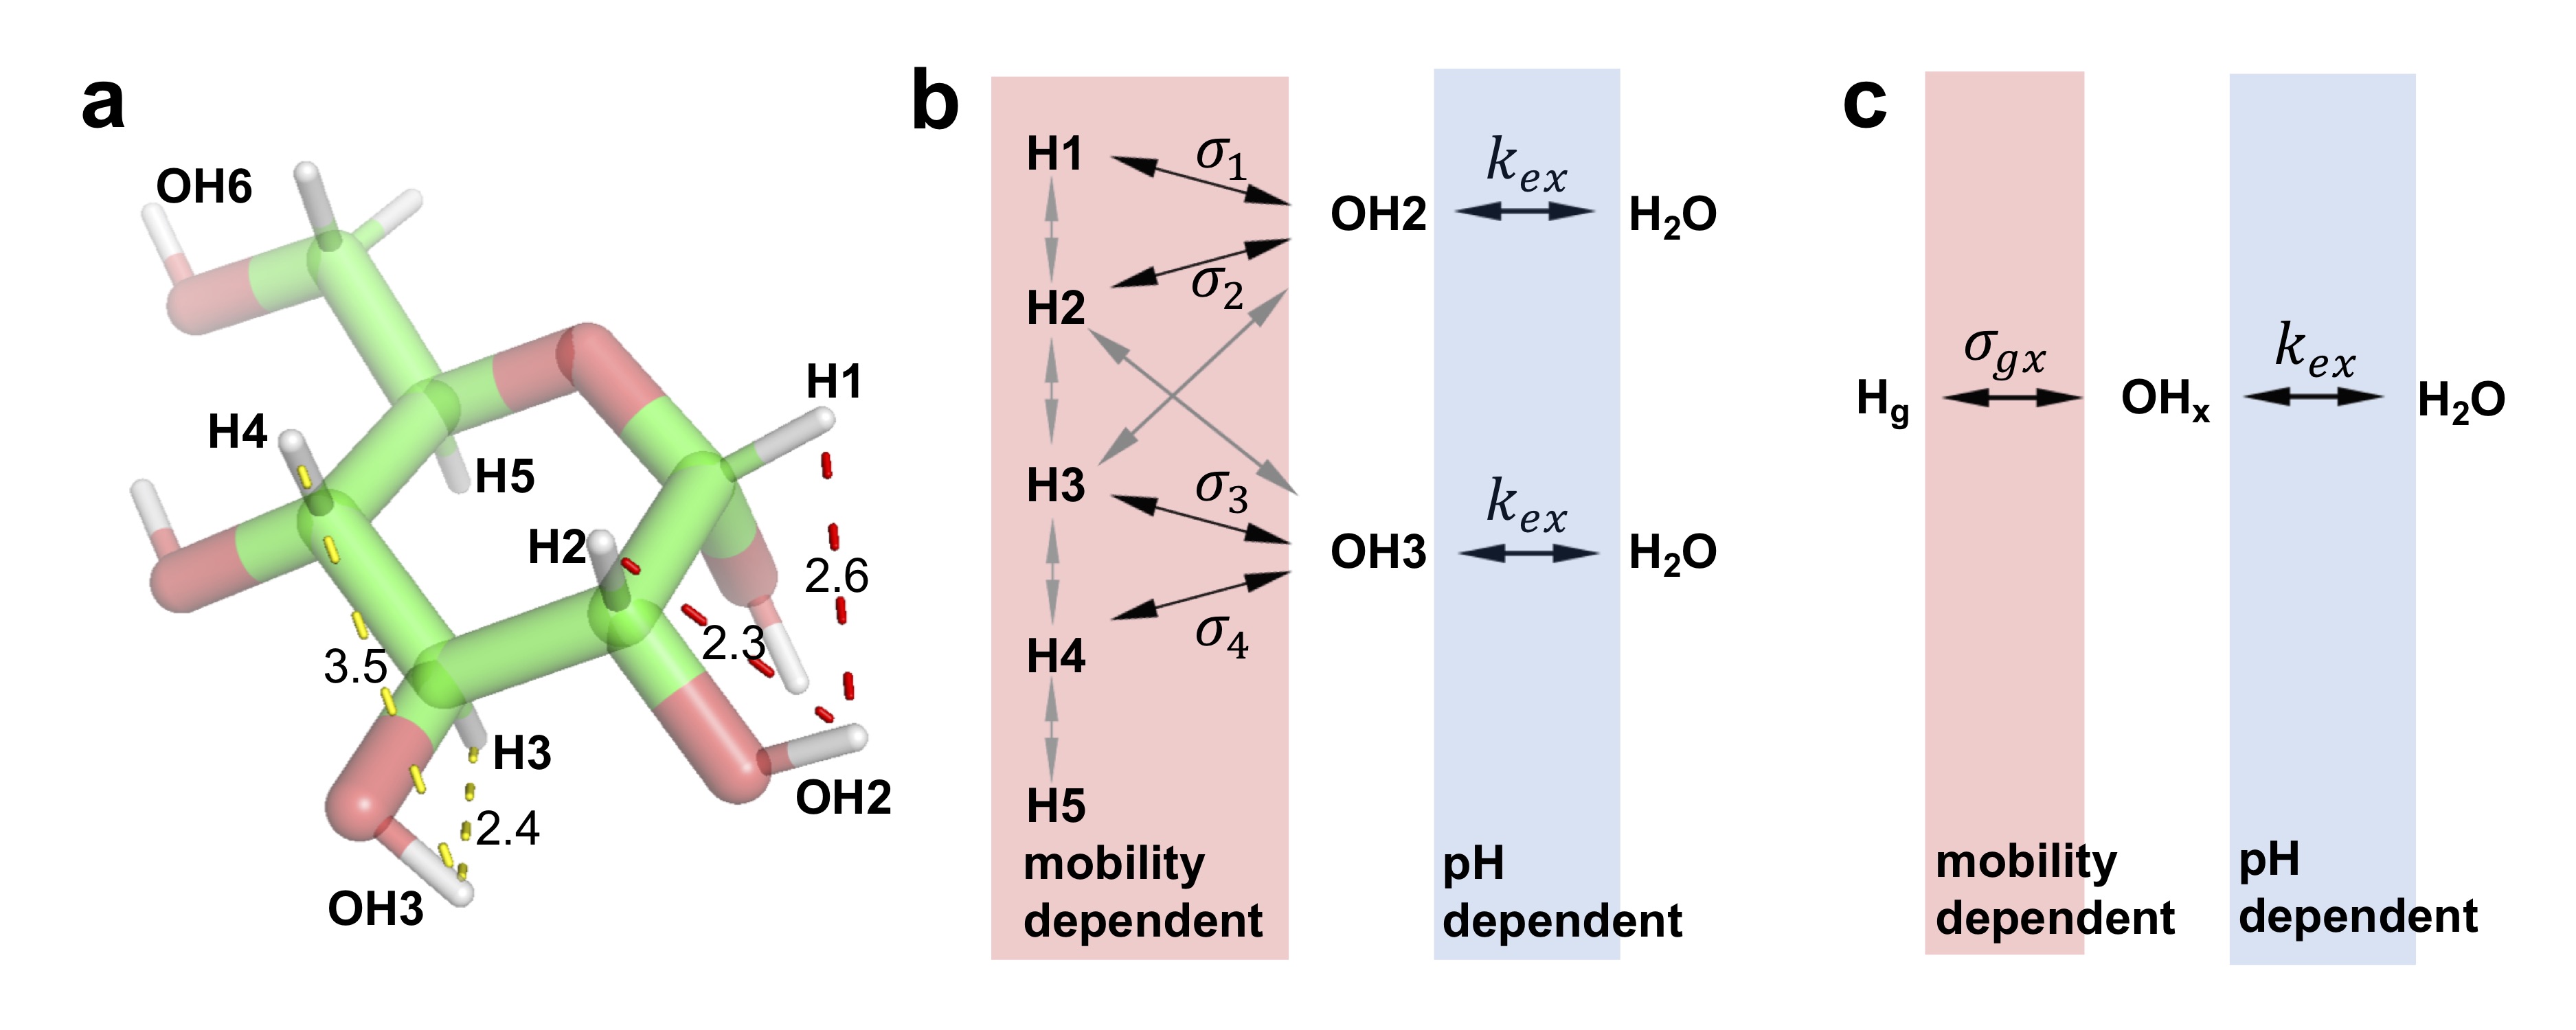
Based on the evidence (Figs. 2, 3) and glucose structure, a relayed NOE network between glycogen aliphatic protons and water (Fig. 4b) is proposed and simplified as:
$$H_g\underset{\sigma_{xg}}{\overset{\sigma_{gx}}{\Leftrightarrow}}H_x\underset{k_{wx}}{\overset{k_{xw}}{\Leftrightarrow}}H_w$$
Where $$$H_g$$$, $$$H_x$$$ and $$$H_w$$$ represent the glycogen aliphatic proton pool, neighboring hydroxyl proton pool and free water proton pool, respectively. $$$\sigma_{gx}$$$ and $$$\sigma_{xg}$$$ are the “effective” NOE rates, $$$k_{xw}$$$ and $$$k_{wx}$$$ are the hydroxyl proton exchange rates.
According to the above rNOE model, the z-magnetization evolutions under a continuous saturation pulse ($$$\omega_{1}$$$, on $$$H_g$$$ only) are described by a set of modified Bloch equations,
$$$\frac{d G_{z}}{d t}=-\rho_{g}\left(G_{z}-G_{z, 0}\right)-\sigma_{x g}\left(X_{z}-X_{z, 0}\right)-\omega_{1} G_{z}+\omega_{1} G_{y} $$$ [1]
$$$\begin{equation}\frac{d X_{z}}{d t}=-\rho_{x}\left(X_{z}-X_{z, 0}\right)-\sigma_{g x}\left(G_{z}-G_{z, 0}\right)-k_{x w} X_{z}+k_{w x} W_{z}\end{equation} $$$. [2]
$$$\frac{d W_{z}}{d t}=-\rho_{w}\left(W_{z}-W_{z, 0}\right)+k_{x w} X_{z}-k_{w x} W_{z} $$$ [3]
Where $$$\rho_g$$$, $$$\rho_x$$$ and $$$\rho_w$$$ are the longitudinal auto-relaxation rates for glycogen protons ($$$H_g$$$), hydroxyl proton ($$$H_x$$$) and free water protons ($$$H_w$$$). $$$\omega_1$$$ is the saturation radial frequency based on $$$B_1$$$. The analytical solution for steady-state ($$$\frac{d X_{Z}}{d t}=\frac{d W_{Z}}{d t}=0$$$) saturation transfer experiments can be deduced (with $$$-k_{x w} X_{z, 0}+k_{w x} W_{z, 0}=0$$$),
$$$glycoNOE \equiv \frac{\left(W_{z, 0}-W_{z}\right)}{W_{z, 0}}=\alpha * \frac{-\sigma_{g x}}{\left(\rho_{x}+k_{x w}\right) \frac{\rho_{w}+k_{w x}}{k_{x w}}-k_{w x}} * p $$$ [4]
$$$\alpha$$$ is viewed as the “saturation factor”, $$$\alpha=\frac{G_{z, 0}-G_{z}}{G_{z, 0}}=\frac{T_{1 g} T_{2 g} \omega_{1}^{2}}{1+T_{1g} T_{2g} \omega_{1}^{2}+\left(T_{2 g} \Delta \omega\right)^{2}} $$$, deduced from the solution of steady-state Bloch equations under on-resonance irradiation 12. $$$p$$$ is the concentration ratio of $$$H_g$$$ and $$$H_w$$$, and $$$p=\frac{G_{\mathrm{z}, 0}}{W_{\mathrm{z}, 0}}=\frac{\left[H_{g}\right]}{\left[H_{w}\right]}=\frac{k_{w x}}{k_{x w}} $$$.One special case is considered here, if
$$$k_{x w} \gg \rho_{x} $$$ [5]
then,
$$$1+\rho_{x} / k_{x w} \approx 1 $$$ [6]
and,
$$$glycoNOE=\alpha * \frac{-\sigma_{g x^{*} p}}{\rho_{w}\left(1+\rho_{x} / k_{x w}\right)+\rho_{x^{*} p}} \approx \alpha * \frac{-\sigma_{g x^{*} p}}{\rho_{w^{+}} \rho_{x^{*} p}} $$$ [7]
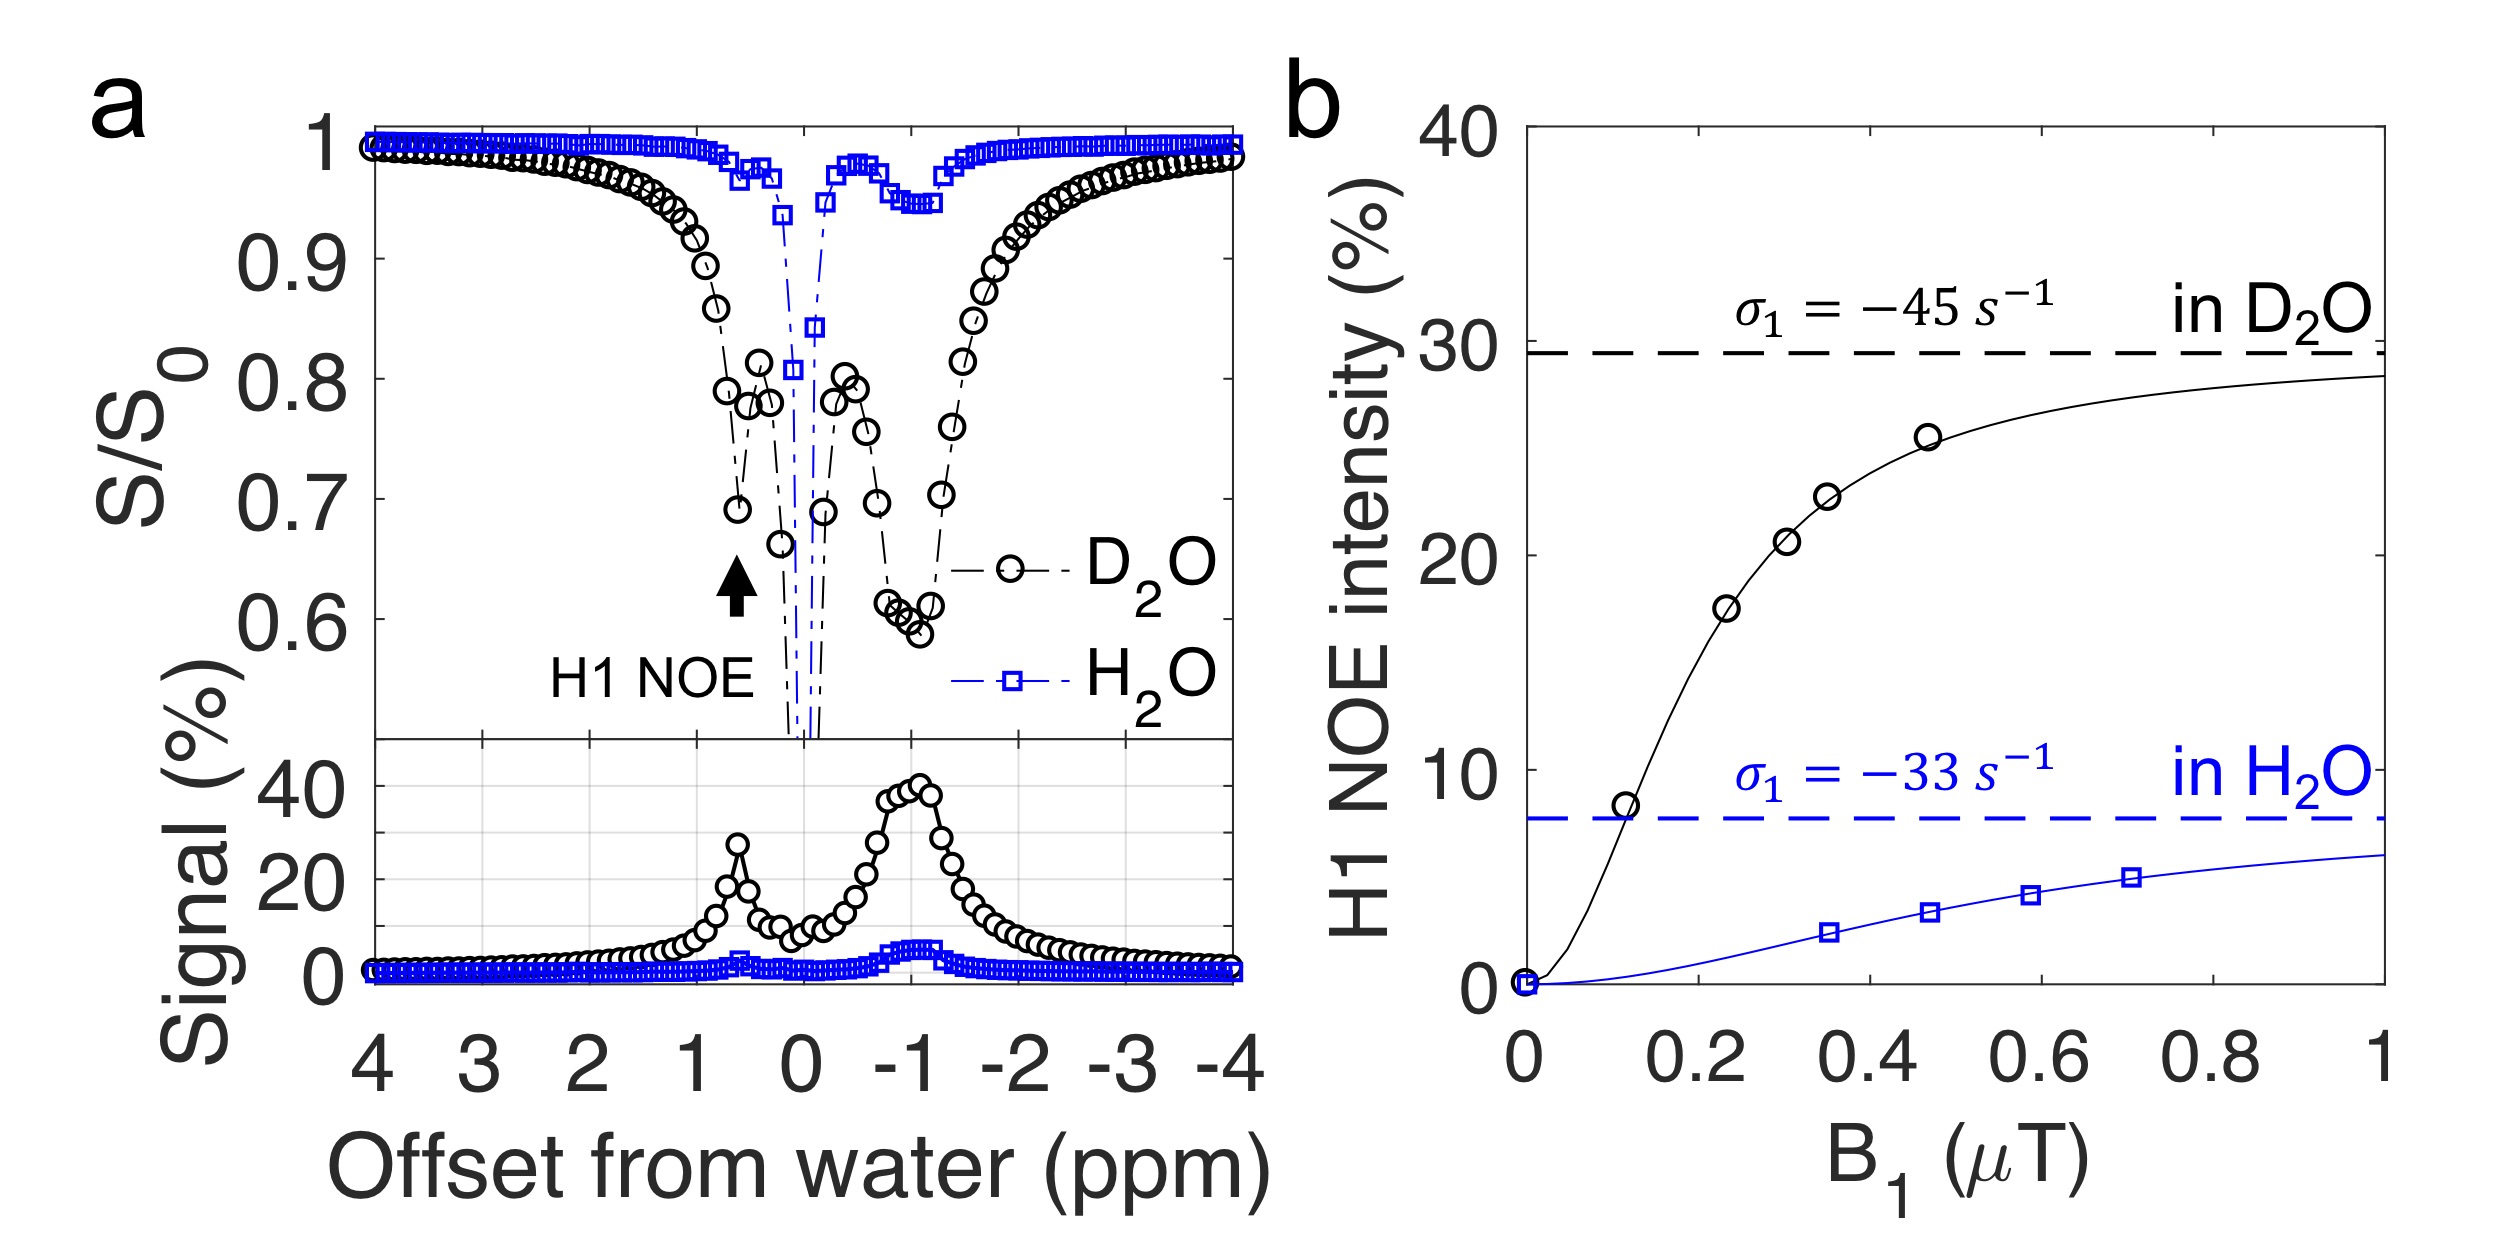
Eq. 7 resembles the analytical solution for the two-pool CEST model 9. Formula [5]-[7] show the maximum of glycoNOE is $$$\frac{-\sigma_{g x} * p}{\rho_{w}+\rho_{x} * p}$$$ and can be reached when $$$k_{x w} \gg \rho_{x}$$$ (and $$$\alpha=1$$$), and that the signal becomes pH (or $$$k_{xw}$$$) independent. For glycogen at pH of 9.6, the condition $$$k_{x w} \gg \rho_{x}$$$ is met. After measuring the water $$$T_1$$$ ($$$T_{1w}$$$) for 95% D2O/5% H2O (10.2 $$$s^{-1}$$$) and 95% H2O/5% D2O (2.8 $$$s^{-1}$$$), Eqs. 4 and 7 were used to calculate the H1 NOE rate ($$$\sigma_1$$$). The fitted $$$\sigma_1$$$ values were comparable in these two solvents (Fig. 5b).
Discussion
Both chemical exchange and rNOE in saturation transfer experiments are effective signal amplifying mechanisms 4 for molecules, but they are different. First of all, CEST signal is highly dependent on pH (or $$$k_{xw}$$$), rNOE is also in principle pH-dependent, but when $$$k_{xw}$$$ is large, rNOE signal appears pH-independent (Eq. 7). Secondly, as the NOE rate is more likely to be the rate-limiting step in rNOE exchange transfer, the measured rNOE often increases with molecular weight.Conclusion
The current study demonstrates that the glycoNOE detection can be explained by the relayed-NOE (rNOE) CEST mechanism. The theoretical study of rNOE in glycogen is useful in understanding Z-spectra of other macromolecules such as proteins and carbohydrate polymers.Acknowledgements
No acknowledgement found.References
1 Zhou, Y. et al. in Proc. Intl. Soc. Mag. Reson. Med. 27 (2019). 0546.
2 Liepinsh, E. & Otting, G. Proton exchange rates from amino acid side chains—implications for image contrast. Magnetic resonance in medicine 35, 30-42 (1996).
3 Xu, J. et al. Variable delay multi‐pulse train for fast chemical exchange saturation transfer and relayed‐nuclear overhauser enhancement MRI. Magnetic resonance in medicine 71, 1798-1812 (2014).
4 Van Zijl, P. C. & Yadav, N. N. Chemical exchange saturation transfer (CEST): what is in a name and what isn't? Magnetic resonance in medicine 65, 927-948 (2011).
5 van Zijl, P. C., Lam, W. W., Xu, J., Knutsson, L. & Stanisz, G. J. Magnetization transfer contrast and chemical exchange saturation transfer MRI. Features and analysis of the field-dependent saturation spectrum. Neuroimage168, 222-241 (2018).
6 Eliav, U. & Navon, G. Multiple quantum filtered NMR studies of the interaction between collagen and water in the tendon. Journal of the American Chemical Society 124, 3125-3132 (2002).
7 Krȩżel, A. & Bal, W. A formula for correlating pKa values determined in D2O and H2O. Journal of inorganic biochemistry 98, 161-166 (2004).
8 Desmond, K. L., Moosvi, F. & Stanisz, G. J. Mapping of amide, amine, and aliphatic peaks in the CEST spectra of murine xenografts at 7 T. Magnetic resonance in medicine 71, 1841-1853 (2014).
9 Van Zijl, P. C., Jones, C. K., Ren, J., Malloy, C. R. & Sherry, A. D. MRI detection of glycogen in vivo by using chemical exchange saturation transfer imaging (glycoCEST). Proceedings of the National Academy of Sciences104, 4359-4364 (2007).
10 Chen, W., Avison, M. J., Zhu, X. H. & Shulman, R. G. NMR studies of proton NOEs in glycogen. Biochemistry32, 11483-11487 (1993).
11 Zang, L.-H., Howseman, A. M. & Shulman, R. G. Assignment of the 1H chemical shifts of glycogen. Carbohydrate research 220, 1-9 (1991).
12 Bloch, F. Nuclear induction. Physical review 70, 460 (1946).
Figures