0498
Orientation dependence of inhomogeneous magnetization transfer and dipolar order relaxation time in a phospholipid bilayer sample1Physics & Astronomy, University of British Columbia, Vancouver, BC, Canada, 2Radiology, University of British Columbia, Vancouver, BC, Canada, 3International Collaboration on Repair Discoveries, Vancouver, BC, Canada, 4UBC MRI Research Centre, Vancouver, BC, Canada, 5Pathology & Laboratory Medicine, University of British Columbia, Vancouver, BC, Canada
Synopsis
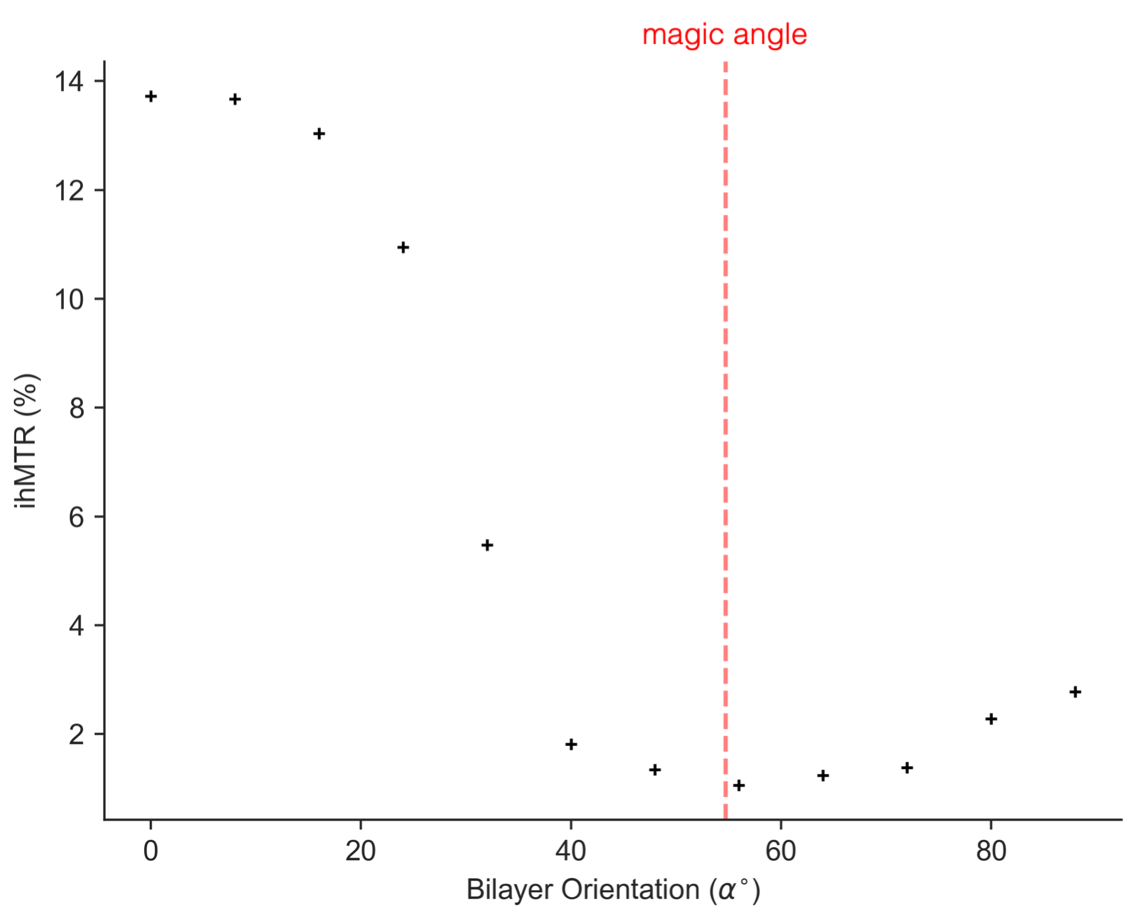
Inhomogeneous magnetization transfer ratio (ihMTR) is reported to have significant orientation dependence in the brain, likely due to the anisotropy of dipolar couplings between methylene protons on the oriented lipids in myelin bilayers. We measured the orientation dependence of linewidth, dipolar relaxation time (T1D) and ihMTR in an aligned phospholipid bilayer sample at 9.4T. ihMTR was maximized when the bilayers were parallel to B0 and minimized near the magic angle (~54.7°) despite the fact that T1D is maximized there. This is in contrast to previous in vivo results which show maximal ihMTR for bilayers perpendicular to B0.
Introduction
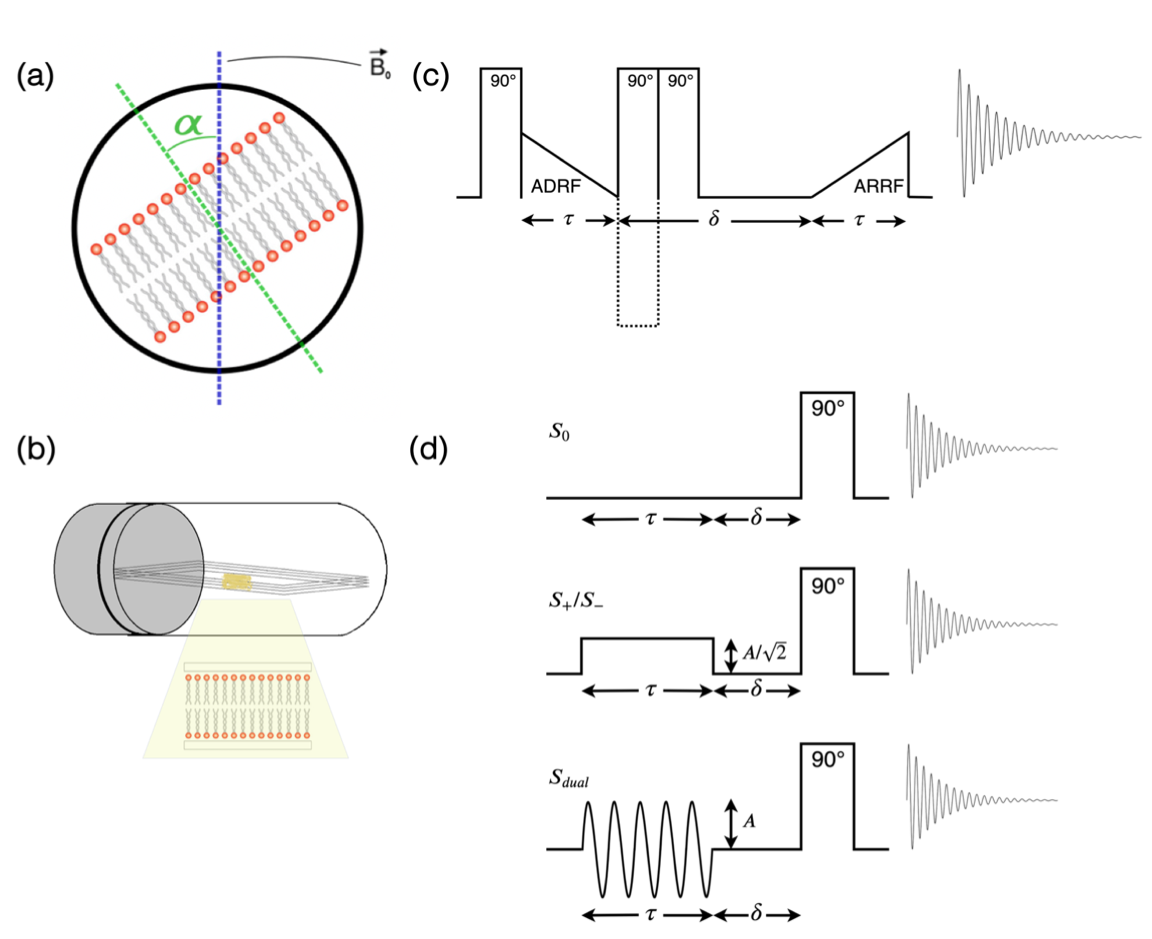
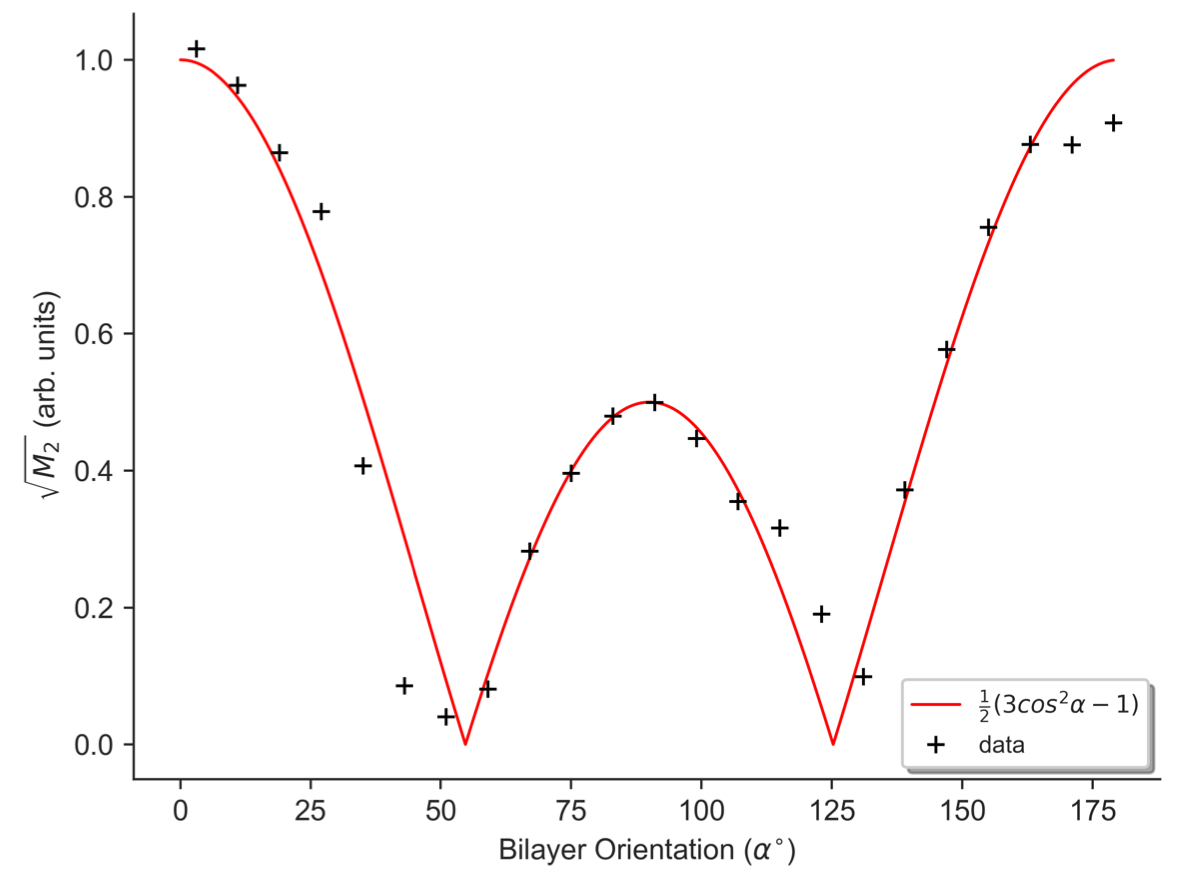
Inhomogeneous magnetization transfer (ihMT): ihMT is a novel MRI technique sensitive to myelin.1–3 The ihMT ratio (ihMTR) is defined as the difference between water signal attenuation with pre-pulses at positive or negative offset ($$$S_{+}/S_{-}$$$) and the attenuation with pre-pulses of the same total power split between positive and negative offsets ($$$S_{dual}$$$): $$ihMTR=\frac{S_{+}+S_{-}-2S_{dual}}{S_{0}}\qquad(1)$$ White matter tracts parallel to the B0 field have significantly higher ihMTR than tracts perpendicular to the field.4,5Dipolar coupling in lipid bilayers: Within lipid bilayers, the protons in methylene groups experience strong dipolar couplings.6,7 Inter-methylene dipolar interactions are mostly averaged away due to thermal motion, meaning that a homonuclear spin-1 model of two isolated protons can be used.8 This model results in a superposition of Gaussian-broadened doublets with splitting determined by the dipolar coupling strength. Lipid molecules spin rapidly about their long axes resulting in a dipolar coupling strength orientation dependence: $$P_{2}(cos\alpha)=\frac{1}{2}(3cos^{2}\alpha-1)\qquad(2)$$ in which $$$P_{2}(cos\alpha)$$$ is the second Legendre polynomial and $$$\alpha$$$ is defined in Figure 1a. This relation governs the second moment (M2) of the lipid signal. At the magic angle ($$$\alpha\approx54.7$$$) the dipolar coupling strength is zero. The dipolar relaxation time, T1D, characterises the relaxation of dipolar order.
Objective: To investigate the cause of ihMTR orientation dependence and measure how lipid linewidth and T1D vary with orientation within an external magnetic field using an oriented phospholipid bilayer sample at 9.4T.
Methods
Sample preparation: 2μl of 1-palmitoyl-2-oleoyl-sn-glycero-3-phosphocholine (POPC), a phospholipid similar in structure to sphingomyelin, dissolved in chloroform (20μg/ml concentration), was pipetted onto eighteen sterile 20x4mm glass coverslip pieces. Slides were dried under vacuum for two hours, stacked into a 5mm diameter NMR tube and hydrated in a 70% humidity chamber for 18 hours at 50°C. The NMR tube was secured in a goniometer probe which rotated the sample in a Varian 400MHz (9.4T) spectrometer (Figure 1b). All experiments were performed at room temperature.Linewidth: A single hard 90° pulse (duration 2.3μs) was applied before signal acquisition. The sample was rotated through $$$\alpha =$$$0-180° in 8° increments. The transmitter was varied to match the water frequency, which had a $$$cos^{2} \alpha$$$ dependence caused by susceptibility effects.9 A small probe background signal was subtracted from the data. The square-root of the second moment of the spectral lineshape was calculated using $$\sqrt{M_{2}}=\sqrt{\frac{\int S(\omega)\omega^{2}d\omega}{\int S(\omega)d\omega}-\left(\frac{\int S(\omega)\omega d\omega}{\int S(\omega)d\omega}\right)^{2}}\qquad(3)$$ with integrals evaluated over 32kHz, centered on the transmitter frequency.
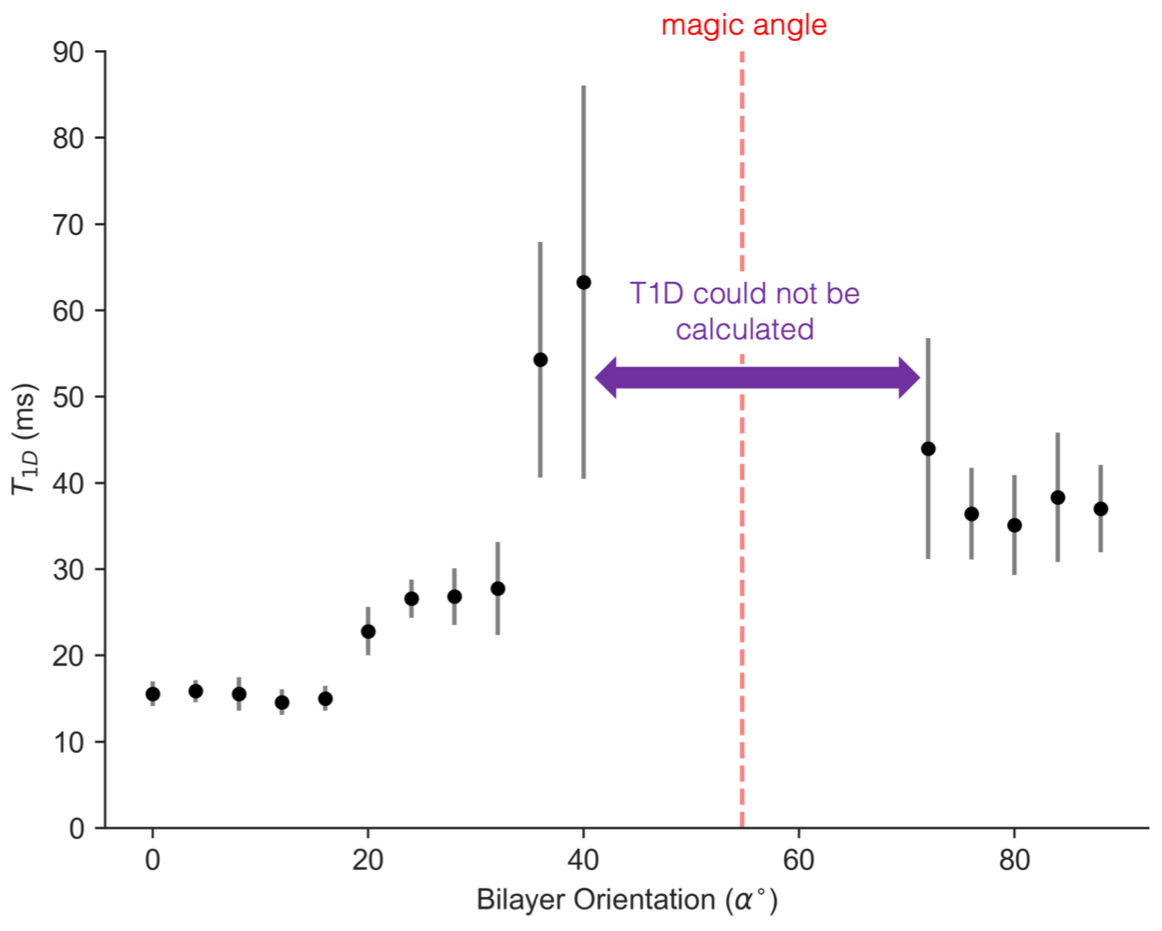
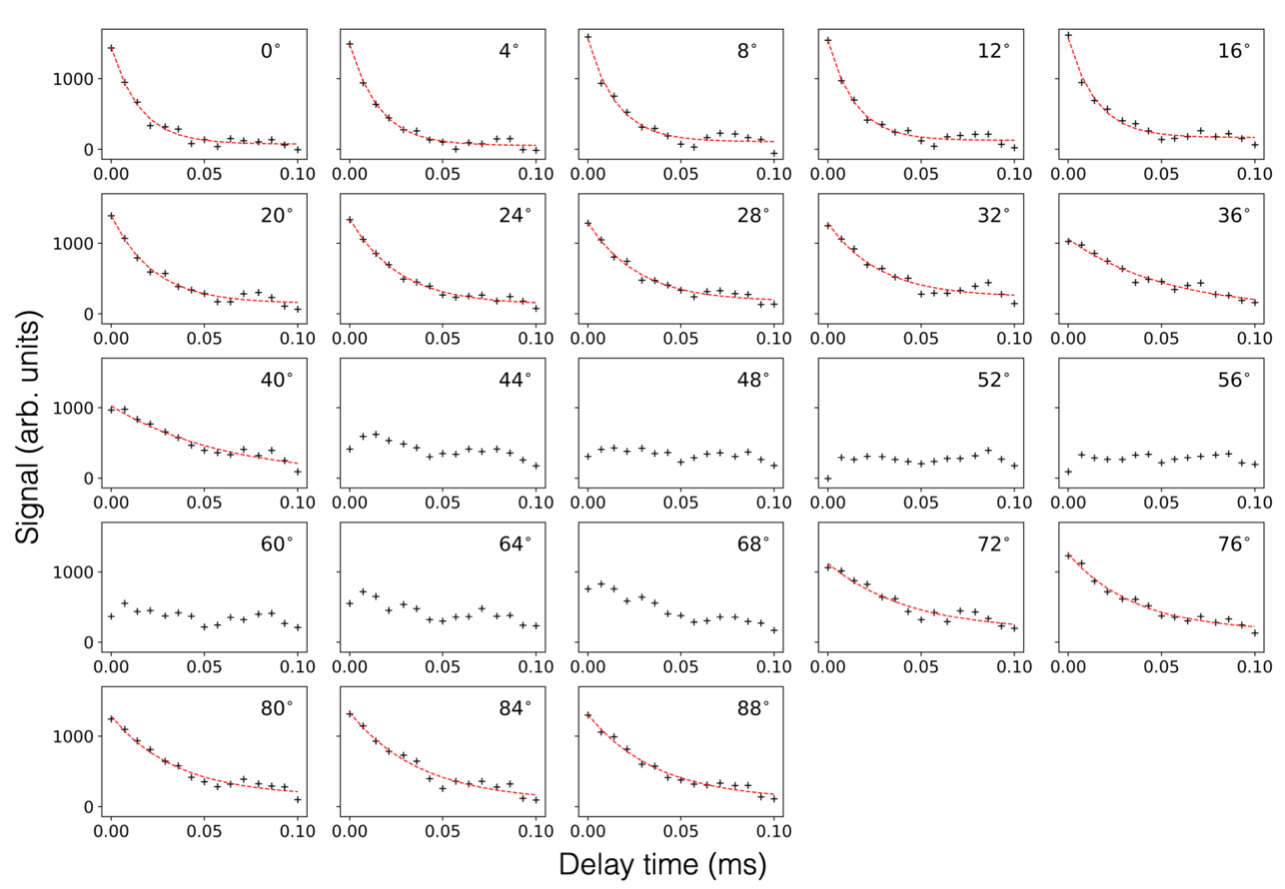
T1D: An adiabatic demagnetization and remagnetization in the rotating frame (ADRF/ARRF) experiment was repeated for $$$\alpha =$$$0-90° in 4° increments. A 90° pulse excites Zeeman magnetisation which is transferred to the dipolar reservoir via an adiabatic ramp-down RF pulse (Figure 1c). Following a relaxation delay, δ, (10μs–0.1ms, 15 equally spaced intervals), dipolar order was transferred back to observable Zeeman magnetization via a symmetric ramp-up RF pulse. T1D was calculated from a fit of the signal integral (evaluated over 32kHz, excluding 1.5kHz centered on the water peak) to an exponential decay.
ihMT: A ‘continuous wave’ ihMT acquisition, using single frequency and sine-modulated dual frequency pre-pulses (±8kHz from water resonance, 50ms duration, 0.5ms delay before data acquisition, Figure 1d), was repeated for $$$\alpha =$$$0-90° in 8° increments. The single frequency pre-pulse amplitude was $$$\frac{1}{\sqrt{2}}$$$ of the dual frequency pre-pulse amplitude, to match total power deposited. ihMTR was calculated from signal integrals over 0.5kHz centered on the water resonance using Equation 1.
Results
The orientation dependence of $$$\sqrt{M_{2}}$$$ corresponded closely to Equation 2 (Figure 2, mean discrepancy 5%). T1D varied with orientation, with a minimum of ~16.5ms near 0° and an apparent maximum at the magic angle (Figure 3). Near the magic angle the lipid signal was greatly reduced, and the signal decay could not be fit with an exponential (Figure 4). ihMTR had a different orientation dependence from T1D, with large ihMTR at small angles, decreasing to a minimum around the magic angle (Figure 5).Discussion
The close correspondence between lipid linewidth and Equation 2 implies that lipids were coherently aligned and that the breadth of the spectrum is dominated by dipolar couplings. T1D orientation dependence is qualitatively described by $$$P_{2}(cos\alpha)$$$, as would be expected if the relaxation is dominated by slower motions in the presence of rapid rotation about the membrane axis.10,11 T1D was not measurable near the magic angle where weak dipolar couplings prevent the transfer to and from dipolar order. ihMTR orientation dependence is very different from that seen in vivo in white matter,4,5 likely due to the cylindrical geometry of the myelin sheath. ihMTR depends on both T1D and linewidth, as the ±8kHz off-resonance pre-pulses have little effect near the magic angle where lipid lines are narrow, even though T1D is maximized there. Lipid linewidth appears to have a greater effect on ihMTR than T1D.Conclusion
Lipid linewidth, T1D and ihMTR vary considerably with orientation. The linewidth of the lipid signal followed the expected orientation dependence of dipolar coupling strength. T1D was maximized near the magic angle. ihMTR depends on both linewidth and T1D, with linewidth effects dominating for sine-modulated dual-frequency pulses. Comparison of absolute ihMTR values in brain white matter tracts at different angles to the B0 field should be made carefully, considering orientation dependence effects.Acknowledgements
We thank Yael Petel for helping to prepare the oriented POPC sample and Elliott Burnell for helpful discussions. ALM, CL and CAM receive funding from NSERC Program Discovery grants, RF received funding from the NSERC Undergraduate Student Research Award program.References
1. Varma, G., Duhamel, G., de Bazelaire, C. & Alsop, D. C. Magnetization Transfer from Inhomogeneously Broadened Lines: A Potential Marker for Myelin. Magn. Reson. Med. 73, 614–622 (2015).
2. Girard, O. M. et al. Magnetization transfer from inhomogeneously broadened lines (ihMT): Experimental optimization of saturation parameters for human brain imaging at 1.5 Tesla. Magn. Reson. Med. 73, 2111–2121 (2015).
3. Duhamel, G. et al. Validating the sensitivity of inhomogeneous magnetization transfer (ihMT) MRI to myelin with fluorescence microscopy. NeuroImage 199, 289–303 (2019).
4. Geeraert, B. L. et al. A comparison of inhomogeneous magnetization transfer, myelin volume fraction, and diffusion tensor imaging measures in healthy children. NeuroImage 182, 343–350 (2018).
5. Girard, O. M. et al. Anisotropy of inhomogeneous Magnetization Transfer (ihMT) in White Matter. in Proc. Intl. Soc. Mag. Reson. Med. 25 0472 (2017).
6. Pampel, A., Müller, D. K., Anwander, A., Marschner, H. & Möller, H. E. Orientation dependence of magnetization transfer parameters in human white matter. NeuroImage 114, 136–146 (2015).
7. Bloom, M., Holmes, K. T., Mountford, C. E. & Williams, P. G. Complete proton magnetic resonance in whole cells. J. Magn. Reson. 1969 69, 73–91 (1986).
8. Manning, A. P., Chang, K. L., MacKay, A. L. & Michal, C. A. The physical mechanism of ‘inhomogeneous’ magnetization transfer MRI. J. Magn. Reson. 274, 125–136 (2017).
9. Ulrich, R., Glaser, R. W. & Ulrich, A. S. Susceptibility corrections in solid state NMR experiments with oriented membrane samples. Part II: Theory. J. Magn. Reson. 164, 115–127 (2003).
10. Bloom, M., Burnell, E. E., Roeder, S. B. W. & Valic, M. I. Nuclear magnetic resonance line shapes in lyotropic liquid crystals and related systems. J. Chem. Phys. 66, 3012–3020 (1977).
11. Burnell, E. E., Capitani, D., Casieri, C. & Segre, A. L. A Proton Nuclear Magnetic Resonance Relaxation Study of C12E6/D2O. J. Phys. Chem. B 104, 8782–8791 (2000).
12. Manning, A. P. T₁ relaxation and inhomogeneous magnetization transfer in brain: physics and applications. (University of British Columbia, 2018).
Figures