0497
The CLARITY procedure of lipid removal from brain tissue sample reveals the lipid-origin of MT contrast in CEST imaging experiment
Anna Orzylowska1, Tymoteusz Słowik2, Agata Chudzik1, Anna Pankowska3, Wilfred W Lam4, and Greg J Stanisz1,4,5
1Department of Neurosurgery and Paediatric Neurosurgery, Medical University of Lublin, Lublin, Poland, 2Center of Experimental Medicine, Medical University of Lublin, Lublin, Poland, 3Department of Radiography, Medical University of Lublin, Lublin, Poland, 4Physical Sciences, Sunnybrook Research Institute, Toronto, ON, Canada, 5Department of Medical Biophysics, University of Toronto, Toronto, ON, Canada
1Department of Neurosurgery and Paediatric Neurosurgery, Medical University of Lublin, Lublin, Poland, 2Center of Experimental Medicine, Medical University of Lublin, Lublin, Poland, 3Department of Radiography, Medical University of Lublin, Lublin, Poland, 4Physical Sciences, Sunnybrook Research Institute, Toronto, ON, Canada, 5Department of Medical Biophysics, University of Toronto, Toronto, ON, Canada
Synopsis
The study compares the differences between Z-spectra derived from CEST imaging of rat brain in vivo and after post-mortem CLARITY lipids removal procedure. The lipids removal nulled-out MT macromolecular-originating signal measured with B1 saturation amplitudes of 3 and 5 µT as compared to in vivo, and resulted in negligible MT contribution to CEST Z-spectra acquired with B1s of 0.5 and 0.75 µT, as opposite to living tissue, where the MT effect was significant. Our results showed that the macromolecular MT contribution into in vivo Z-spectra originates mostly from lipids, since the CLARITY technique removed the MT component from the spectrum.
INTRODUCTION
Chemical Exchange Saturation Transfer (CEST) imaging provides data in the form of Z-spectrum, which in vivo contains the contributions from CEST and rNOE (relayed Nuclear Overhouser Effect) effects of labile proteins and metabolites, as well as from magnetization transfer (MT) from semi-solid macromolecules and direct water saturation effect (DE)1. In this study we aimed to assess the differences in Z-spectrum in rat brain hippocampus and cortex before and after post-mortem CLARITY lipids removal procedure (Clear, Lipid-exchanged, Acrylamide-hybridized Rigid, Imaging/immunostaining compatible, Tissue hydrogel)2. As the rNOE signal is known to originating from lipids3 and manifesting in Z-spectrum as broad peak upfield the water resonance, we hypothesized that CLARITY procedure would influence mostly this effect.METHODS
CLARITY procedure: Five mm slice of rat brain (Fig. 1 A) was fixed with a hydrogel solution containing acrylamide, paraformaldehyde, bis-acrylamide and thermal initiator VA-044, as described in2. For clearing procedure the sodium dodecyl sulphate and boric acid clearing solution was used (Fig. 1 B).Imaging: MRI (7T PharmaScan 70/16 US scanner, Bruker, Germany) was performed twice: in vivo and post-mortem after CLARITY procedure. Five Z-spectra were acquired from single-slice axial (covering hippocampus and cortex) MT-prepared EPI sequence (TE 37ms, TR 5s, NA 3, FOV 30×30mm2, slice thickness 1mm), with block RF saturation pulses of 4,900 ms duration, and five different B1 peak amplitudes: 0.5 and 0.75 µT in a frequency offsets range of -6 to +6 ppm (139 offsets for in vivo scans, and 424 offsets every 10 Hz post-mortem) for CEST imaging, 3.0 and 5.0 µT (at 32 offsets between +300 to -300 ppm) for MT-sensitive effects, and 0.1 µT at 24 offsets between +0.5 and -0.5 ppm for DE measurement. High flip angle 3D FLASH scans and inversion recovery RARE scans were performed for B1 scale correction and R1 mapping, respectively.
Data analysis: The Z-spectra were derived from segmented hippocampal and cortical area (Fig. 1 C), B0‑corrected and averaged in ROI. Z-spectra with saturations B1s of 3 and 5 µT, and the average R1 were fitted to a two-pool MT model4, giving four quantitative MT parameters: the transverse relaxation times of the liquid (T2,A) and macromolecular (T2,B) pools, the initial magnetization of the macromolecular pool (M0,B) and the exchange rate between liquid and macromolecular pools (R). The estimated model parameters were used for simulating MT semisolid macromolecular pool contributions to the CEST Z-spectra acquired with B1s of 0.5 and 0.75 µT.
RESULTS
The lipids removal almost nulled-out MT macromolecular-originating signal measured with B1s of 3 and 5 µT as compared to in vivo data (Fig. 2). Fitting two-pool model to these data revealed prolonged T2 times from both liquid (T2,A) and macromolecular (T2,B) pools after CLARITY, and reduced both R1 and R exchange rate (Table 1).The CLARITY procedure also resulted in substantially decreased CEST signal within the whole range of spectrum received with both saturation B1 powers of 0.5 and 0.75 μT (Fig. 3). After CLARITY the z-spectra were flattened as compared to in vivo, with remaining distinct peaks at +3.5, +2.8, +2 and -3.5 ppm. For the saturation impulse power 0.5 μT, an average signal decrease was 12 ± 3% and for B1 of 0.75 μT an average signal decrease was 21 ± 4%. The simulated for B1s of 0.5 and 0.75 μT MT signal contribution to the Z-spectra was distinctly substantial in the in vivo data, as opposite to post-CLARITY measurements.
DISCUSSION & CONCLUSIONS
The study showed that the macromolecular MT contribution into in vivo z-spectra originates mostly from lipids, since the CLARITY technique removed the MT component from the spectrum. The additionally observed drop-down of the CEST effect was associated mostly with increased water content in comparison to molecules, as the CLARITY procedure resulted in swelling of the tissue sample (Fig. 1 B). Our results suggest that lipid-originating signal manifests not only in the rNOE part of the Z-spectrum, but has also significant contribution to the resonances downfield the water. The above conclusions are in agreement with biological data, from which lipids are known as the biggest group of macromolecules (around 11%) of the brain tissue5.Acknowledgements
This work was supported by the National Science Centre, Poland (2015/17/B/NZ4/02986) and Canadian Institute for Health Research, Canada (PJT148660).References
- van Zijl PCM, Yadav NN. Chemical exchange saturation transfer (CEST): What is in a name and what isn’t? Magn Reson Med. 2011;65(4):927-948. doi:10.1002/mrm.22761
- Chung K, Wallace J, Kim SY, et al. Structural and molecular interrogation of intact biological systems. Nature. 2013;497(7449):332-337. doi:10.1038/nature12107
- Lu J, Zhou J, Cai C, Cai S, Chen Z. Observation of true and pseudo NOE signals using CEST-MRI and CEST-MRS sequences with and without lipid suppression. Magn Reson Med. 2015;73(4):1615-1622. doi:10.1002/mrm.25277
- Henkelman RM, Huang X, Xiang Q-S, Stanisz GJ, Swanson SD, Bronskill MJ. Quantitative interpretation of magnetization transfer. Magn Reson Med. 1993;29(6):759-766. doi:10.1002/mrm.1910290607
- Jain M, Ngoy S, Sheth SA, et al. A systematic survey of lipids across mouse tissues. Am J Physiol - Endocrinol Metab. 2014;306(8). doi:10.1152/ajpendo.00371.2013
Figures
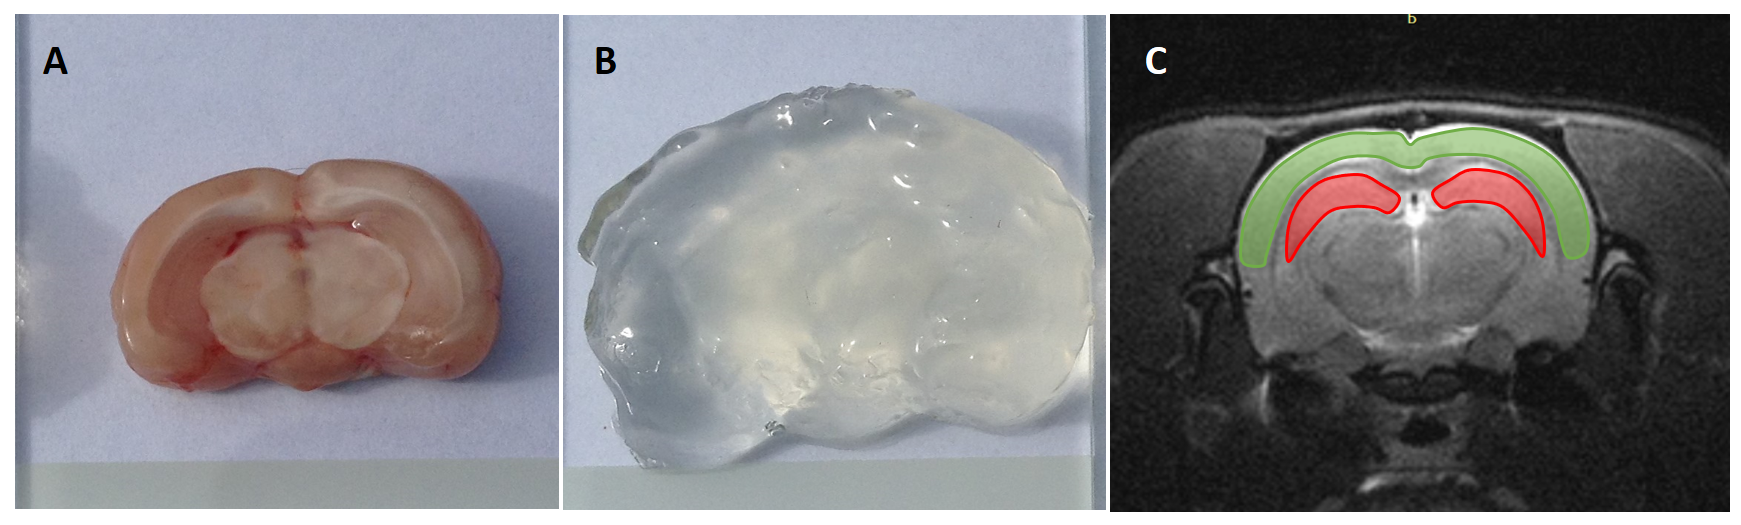
Figure 1. (A) Five mm brain
tissue sample, (B) the same sample after the post-mortem
lipid removal procedure (CLARITY), and (C) the corresponding anatomical MRI scan
with segmented hippocampal and cortical areas (red and green, respectively).

Figure 2. Mean MT-sensitive Z-spectra obtained from
brain in vivo (orange lines) and after CLARITY procedure (blue lines), with
two B1 saturation powers 3 µT and 5 µT
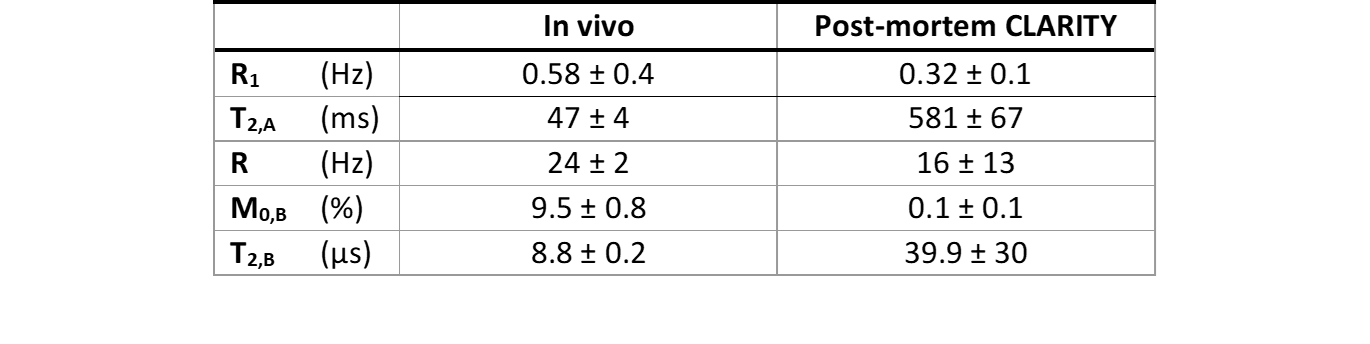
Table 1. The measured R1 (=1/T1) and
estimated parameters of the two-pool MT model derived from Z-spectra with B1
saturation powers 3 µT and 5 µT
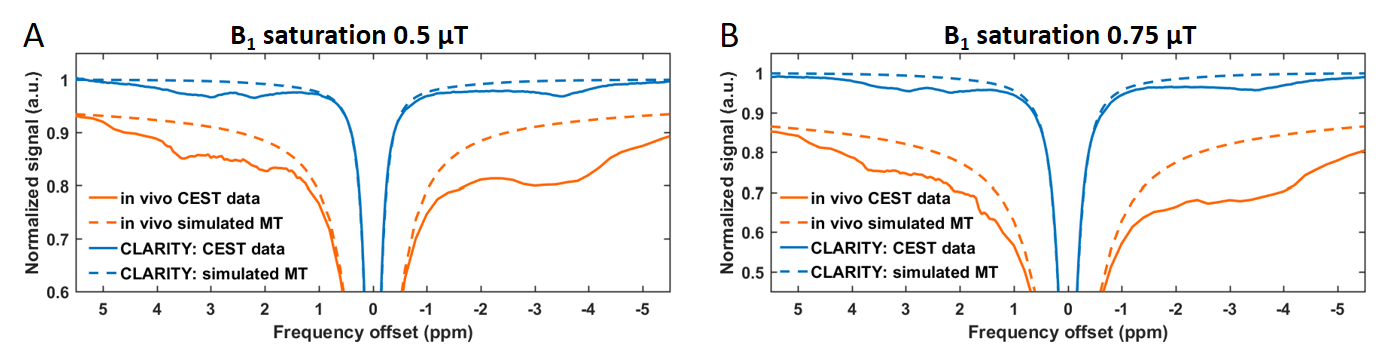
Figure 3. Mean Z-spectra from hippocampus
and cortex in vivo (orange, solid
line) and corresponding area after CLARITY procedure (blue, solid line),
obtained with two B1 saturation powers of A) 0.5 µT and B) 0.75 µT.
The dashed lines represent MT macromolecular pool + DE contribution to the
spectra, which was simulated based on MT-sensitive scans.