0496
Multimodal assessment of brain energy metabolism in a rat model of hepatic encephalopathy using 1H-MRS and 18F-FDG PET – a pilot study1Center for biomedical imaging (CIBM), EPFL, Lausanne, Switzerland, 2Laboratory for functional and metabolic imaging (LIFMET), EPFL, Lausanne, Switzerland
Synopsis
Hepatic encephalopathy (HE) is a severe complication of chronic liver disease which drastically affects patient lives. Its underlying mechanisms are still unknown and energy metabolism studies are of key interest. Here, we combined 18F-FDG PET and 1H-MRS and found a 2-fold decrease in brain glucose uptake in a rat model of HE compared to SHAM rats, associated with a previously reported increase in brain glutamine and decrease in osmolytes. Although the difference in glucose uptake measured by PET results from a combination of brain and systemic effects, this finding provides a new perspective on HE pathophysiology.
Introduction
Hepatic encephalopathy (HE) is a severe complication of chronic liver disease and leads to metabolic dysfunction and cognitive impairment, which are often lethal. The underlying mechanisms leading to this condition are still debated but the main focus so far has been on glutamine (Gln) metabolism. It is widely acknowledged1 that chronic liver disease induces an excess of blood ammonia, which is not properly excreted and causes an increase in Gln in the brain. An increased brain Gln content is responsible for the decrease of the main osmolytes (Ins, Tau, tCho, tCr) through an osmotic regulation mechanism which possibly results in brain oedema2. However, very few studies on HE focused on energy metabolism so far. None of them showed significant changes in energy metabolites, neither for glucose steady state concentrations with 1H-MRS2 or metabolic fluxes with 13C-MRS3, nor for γ-ATP with 31P-MRS4. Here we report a pioneering study on energy metabolism and glucose uptake by 18F-FDG PET in a rat model of HE, combined with 1H-MRS for disease assessment.Methods
BDL rats - The bile duct ligated (BDL) rat model for chronic liver disease leading to HE5 was used. Surgery was performed on adult male Wistar rats (n=12). Plasma bilirubin and ammonium were measured longitudinally. For all experiments, rats were under isoflurane anaesthesia (1.5-2%) and body temperature and breathing rate were monitored.1H-MRS - 1H-MRS experiments on BDL rats were performed on an actively shielded 9.4T scanner, using SPECIAL6 sequence (TE=2.8ms, TR=4s, 160 averages). Acquisitions were performed at weeks 0, 4 and 6 post surgery on two brain regions, hippocampus (week 0: n=4, week 6: n=9) and cerebellum (week 0: n=3, week 6: n=4), with a voxel size of 2x2.8x2 mm3 and 2.5x2.5x2.5 mm3, respectively. Absolute quantification of metabolites was performed with LCModel using the water signal as internal reference.
PET - PET experiments on BDL (n=10) and SHAM (n=8) rats were conducted after 1H-MRS experiments at week 6, on an avalanche photodiode detector-based LabPET 4 scanner. After injection of a bolus of 18F-FDG in the tail vein of the rat, a 45-min dynamic acquisition was performed on the region of the vena cava to extract the arterial input function (AIF)7. A 15-min static acquisition was then performed on the brain and a 3D map of the glucose cerebral metabolic rate (CMRglc) was reconstructed using the Solokoff method8. MLEM algorithm with the LabPET-4 built-in calibration tool was used to obtain quantified PET images in Bq/mL (1x1x1.18 mm3 nominal resolution), corrected for radioactivity decay. The Lumped Constant (LC) was set to 0.717 and glycaemia values were assumed to be constant over the time of the experiment and were measured for each rat after the static acquisition. Averages of CMRglc maps over spectroscopic voxels were computed for comparison with 1H-MRS.
Results
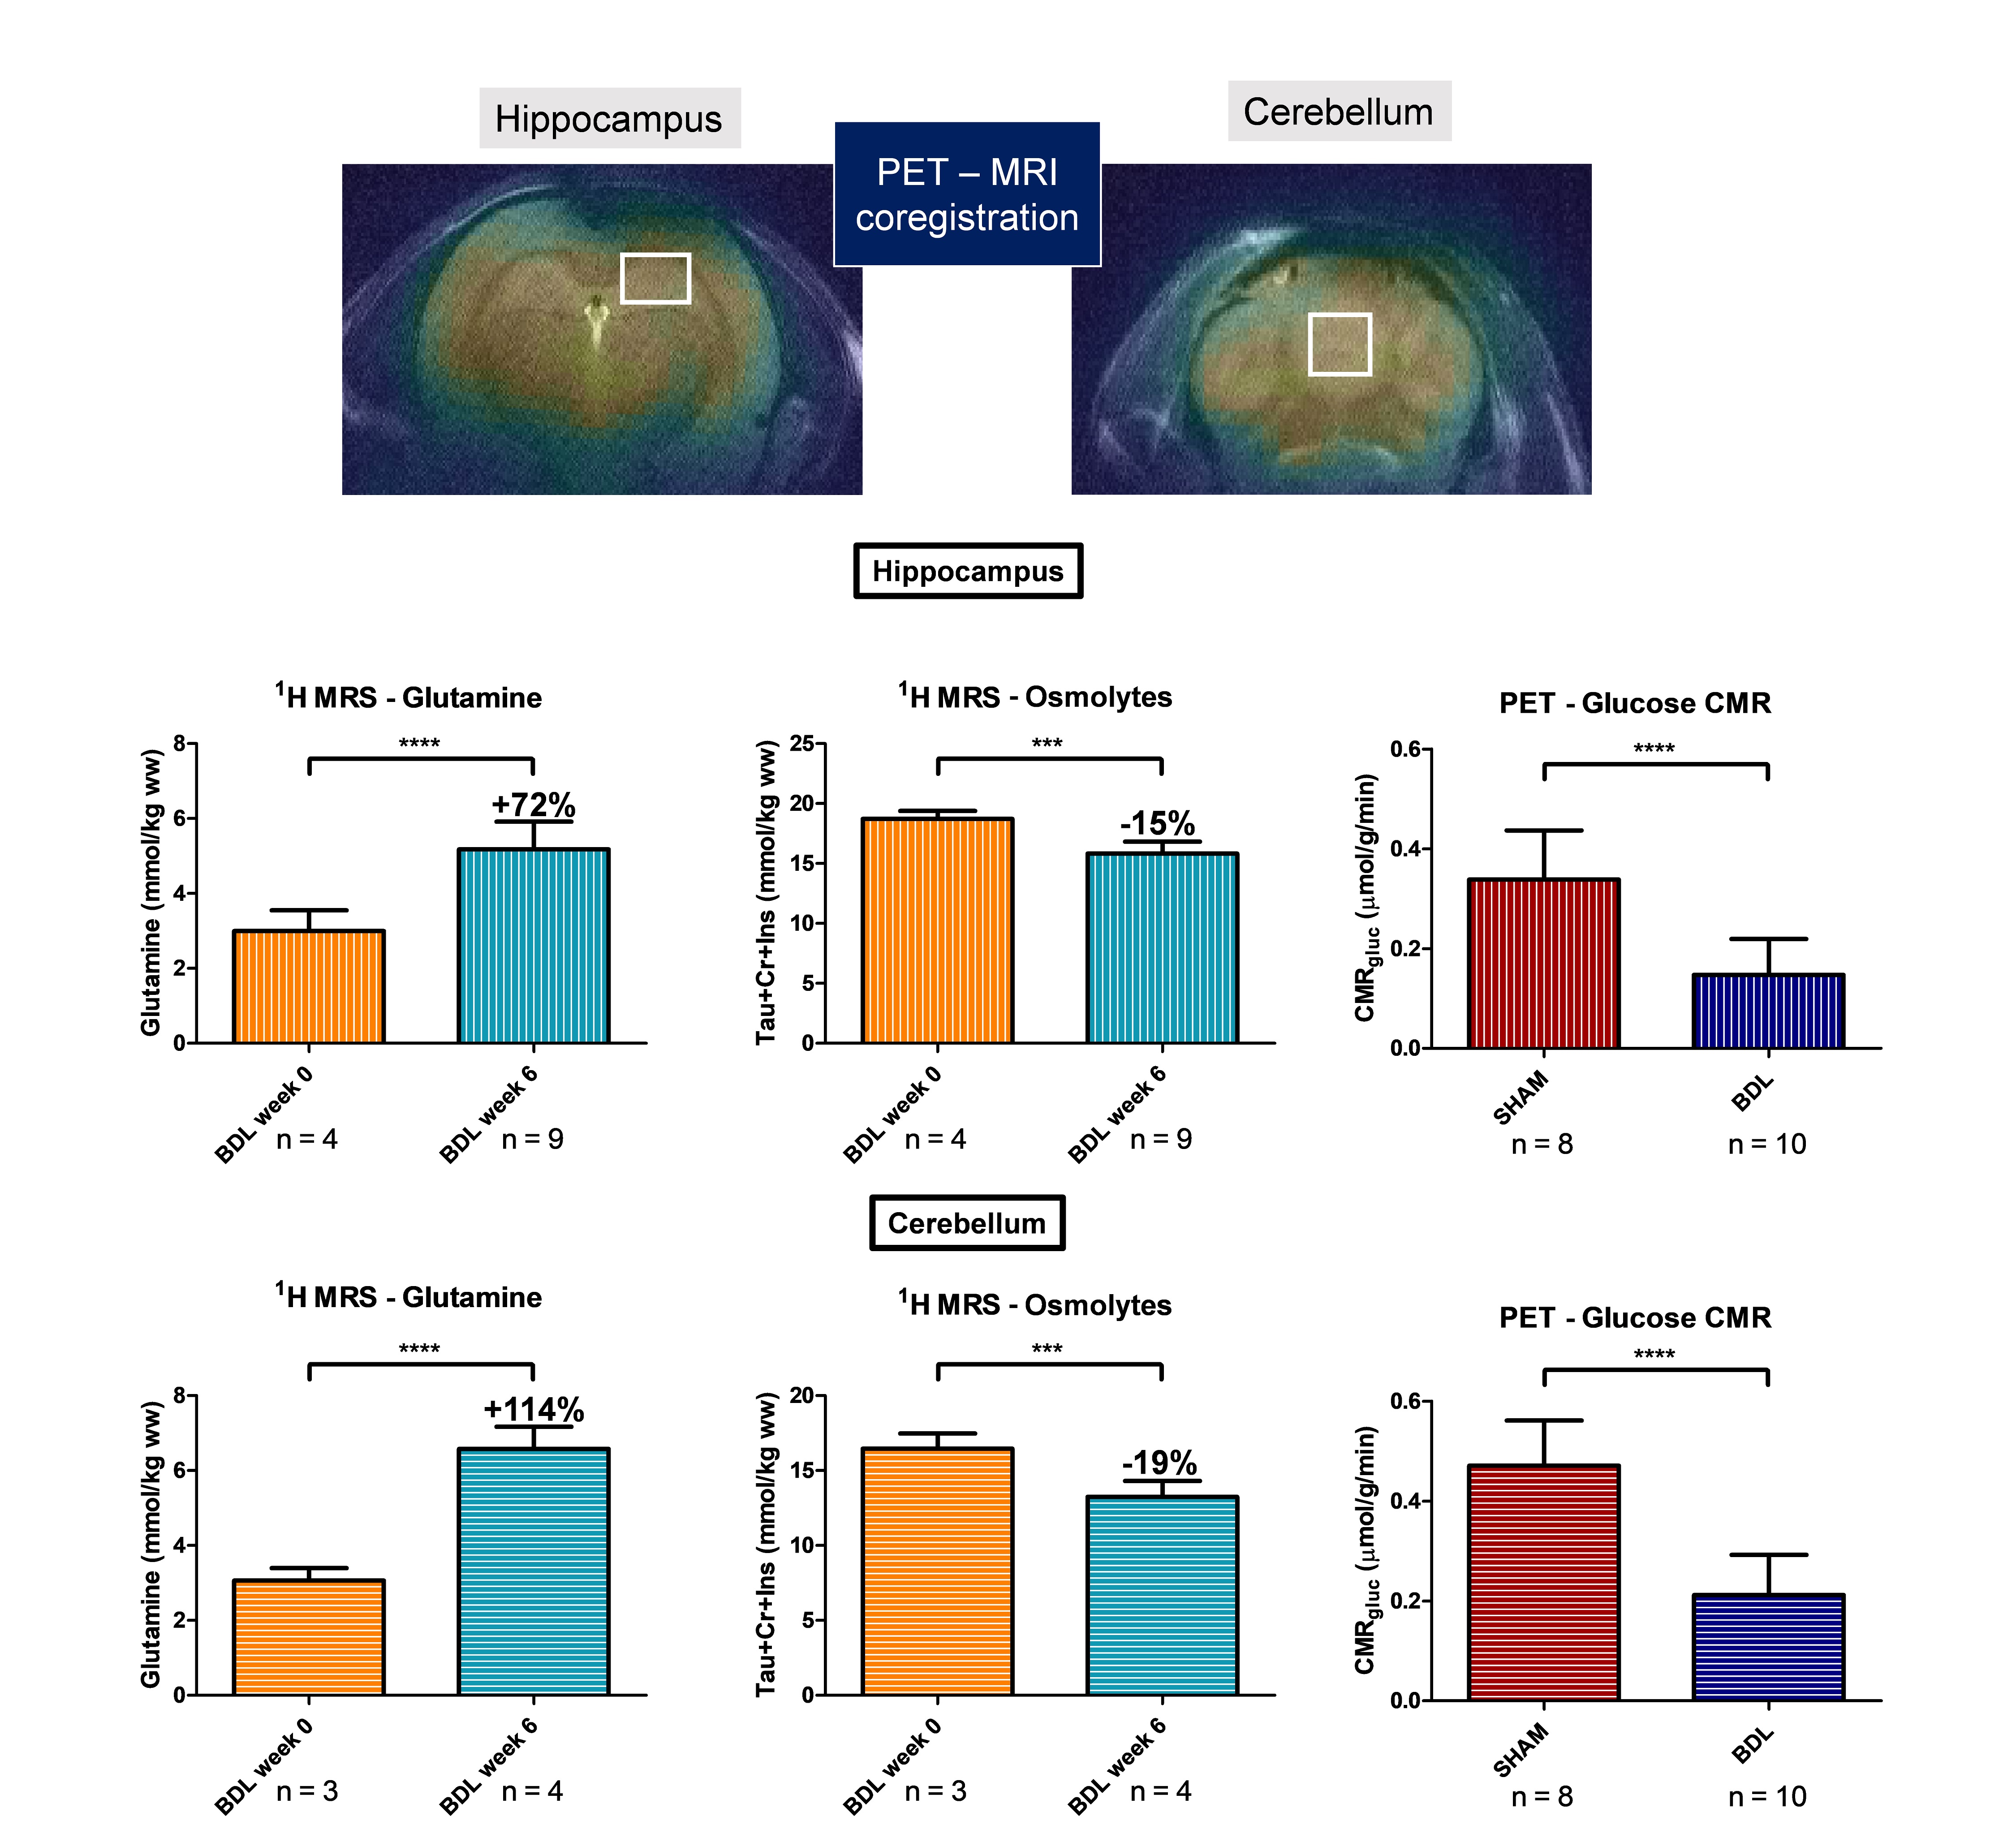
Plasma bilirubin (<0.5 at week 0 (n=1) to 8.1mg/dl at week 6 (n=10)) and ammonia (26+/-7 at week 0 (n=8) to 60+/-30μM at week 6 (n=4)) increased in all BDL rats, confirming the induced chronic liver disease. The 1H-MRS data confirmed the previously reported increase in brain glutamine2 in both regions (fig 2), yet stronger in the cerebellum than in the hippocampus9 (152% versus 73%). As expected, this increase was compensated by a significant decrease in the main osmolytes (Ins, Tau, tCr) (-15, -19%). The FDG input function was reliably measured from the dynamic PET images over the vena cava (fig 3A). The Sokoloff method, using the area under the curve of the FDG input function, LC, the steady-state brain image and glycaemia as inputs enabled the construction of high resolution metabolic maps (fig 3B). A typically 2-fold higher CMRglc was observed in SHAM versus BDL rats on all coronal slices. PET-MRI coregistration allowed a quantitative comparison between PET and 1H-MRS data (fig 4). A significant 2-fold decrease of CMRglc in BDL rats compared to SHAM rats was measured in both brain regions, associated with a significant 2-fold increase in brain glutamine and 1.2-fold decrease in brain osmolytes in BDL rats at week 6.Discussion
While 1H-MRS provided a steady state information on metabolic pools in the hippocampus and the cerebellum, 18F-FDG PET gave an additional and complementary information on glucose uptake. Because 18F-FDG is converted to FDG-6P and no further degraded through the glycolysis, the PET signal at steady-state results from an accumulation of FDG-6P. It should be noted that the difference observed in CMRglc is due to combined systemic and brain effects. Blood glycaemia values were significantly lower in BDL rats compared to SHAM rats. Yet, the difference measured between the two groups for CMRglc maps (120%) was lower than the difference measured between glycaemia values (179%), suggesting an effect not restricted to systemic differences. Future blood glucose clamp PET studies are planned to separate the contribution of systemic and local metabolic changes on the CMRglc of BDL rats.Conclusion
A 2-fold decrease in glucose metabolic fluxes was observed in the hippocampus and cerebellum of BDL rats versus SHAM using 18F-FDG PET. This finding correlates with an increase in glutamine and a decrease in osmolytes in both brain regions of BDL rats and paves the way for new insights on glucose function in the pathophysiology of HE.Acknowledgements
Supported by CIBM of the UNIL, UNIGE, HUG, CHUV, EPFL, the Leenaards and Jeantet Foundations, the SNSF project No 310030_173222/1 and the European Union's Horizon 2020 research and innovation program under the Marie Sklodowska-Curie grant agreement No 813120 (INSPiRE-MED).References
1. Albrecht, J. & Jones, E. A. Hepatic encephalopathy: molecular mechanisms underlying the clinical syndrome. J. Neurol. Sci. 170, 138–146 (1999).
2. Braissant, O. et al. Longitudinal neurometabolic changes in the hippocampus of a rat model of chronic hepatic encephalopathy. J. Hepatol. 71, 505–515 (2019).
3. Lanz, B. In Vivo 13C MRS Investigation of Alterations in Cerebral Oxidative Metabolism in a Chronic Liver Disease Rat Model. in ISMRM (2013).
4. Rackayova, V. et al. 1H and 31P magnetic resonance spectroscopy in a rat model of chronic hepatic encephalopathy: in vivo longitudinal measurements of brain energy metabolism. Metab. Brain Dis. 31, 1303–1314 (2016).
5. Butterworth, R. F. et al. Experimental models of hepatic encephalopathy: ISHEN guidelines. Liver Int. 29, 783–788 (2009).
6. Mlynárik, V., Gambarota, G., Frenkel, H. & Gruetter, R. Localized short-echo-time proton MR spectroscopy with full signal-intensity acquisition. Magn. Reson. Med. 56, 965–970 (2006).
7. Lanz, B., Poitry-Yamate, C. & Gruetter, R. Image-derived input function from the vena cava for 18F-FDG PET studies in rats and mice. J. Nucl. Med. Off. Publ. Soc. Nucl. Med. 55, 1380–1388 (2014).
8. Sokoloff, L. et al. The [14c]deoxyglucose Method for the Measurement of Local Cerebral Glucose Utilization: Theory, Procedure, and Normal Values in the Conscious and Anesthetized Albino Rat. J. Neurochem. 28, 897–916 (1977).
9. Simicic, D. et al. P: 33 In Vivo Longitudinal 1H MRS Study of Hippocampal, Cereberal and Striatal Metabolic Changes in the Adult Brain Using an Animal Model of Chronic Hepatic Encephalopathy. Am. J. Gastroenterol. 114, S17 (2019).
Figures
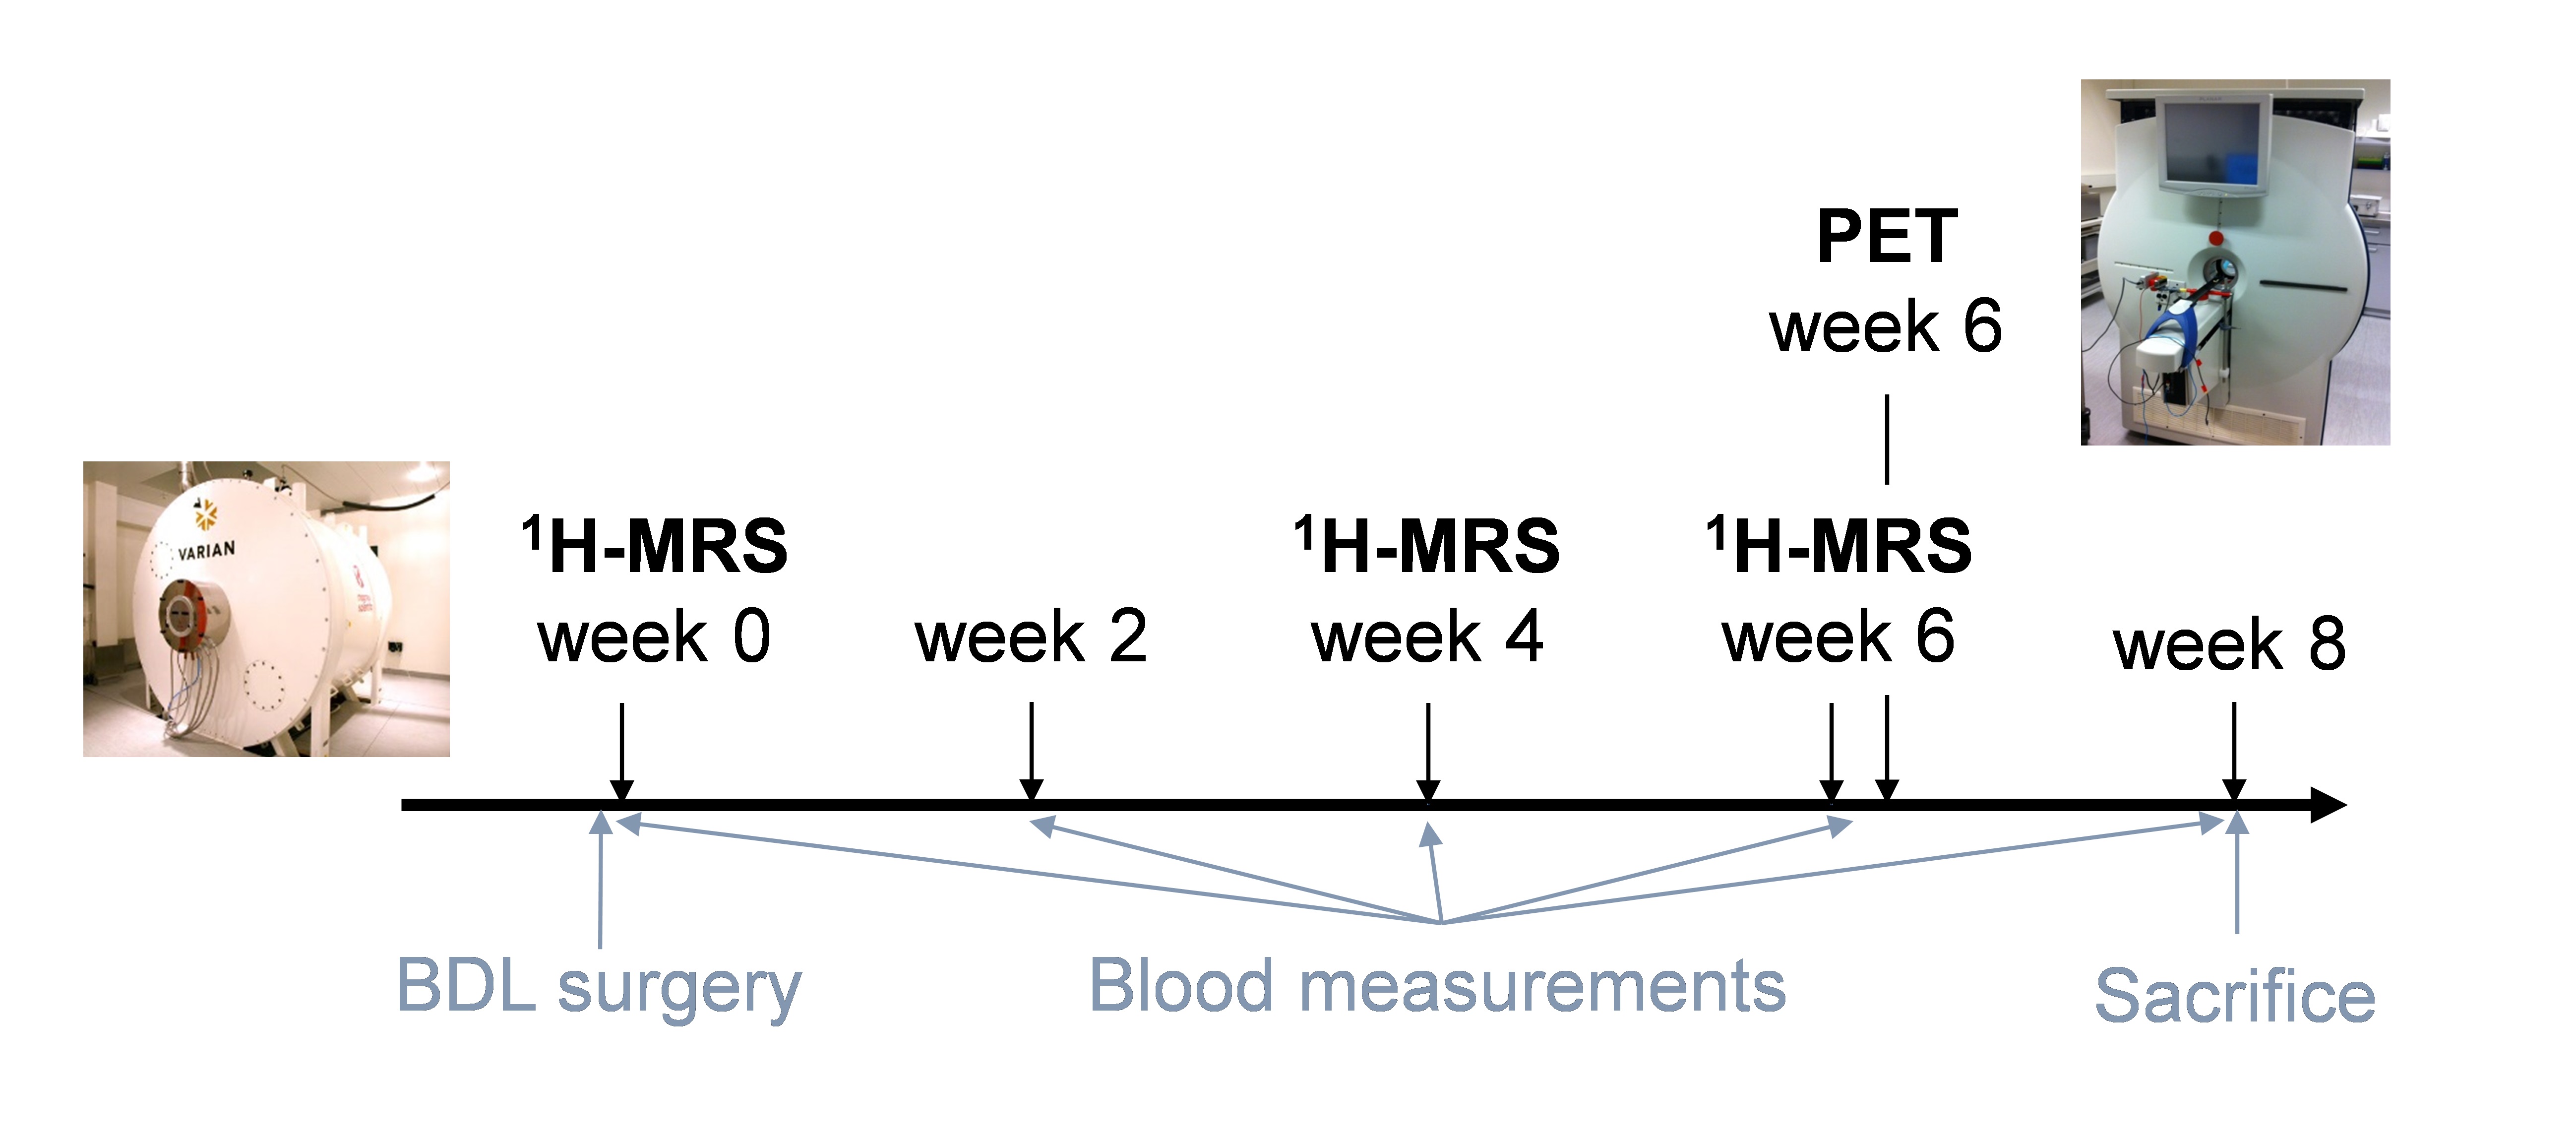
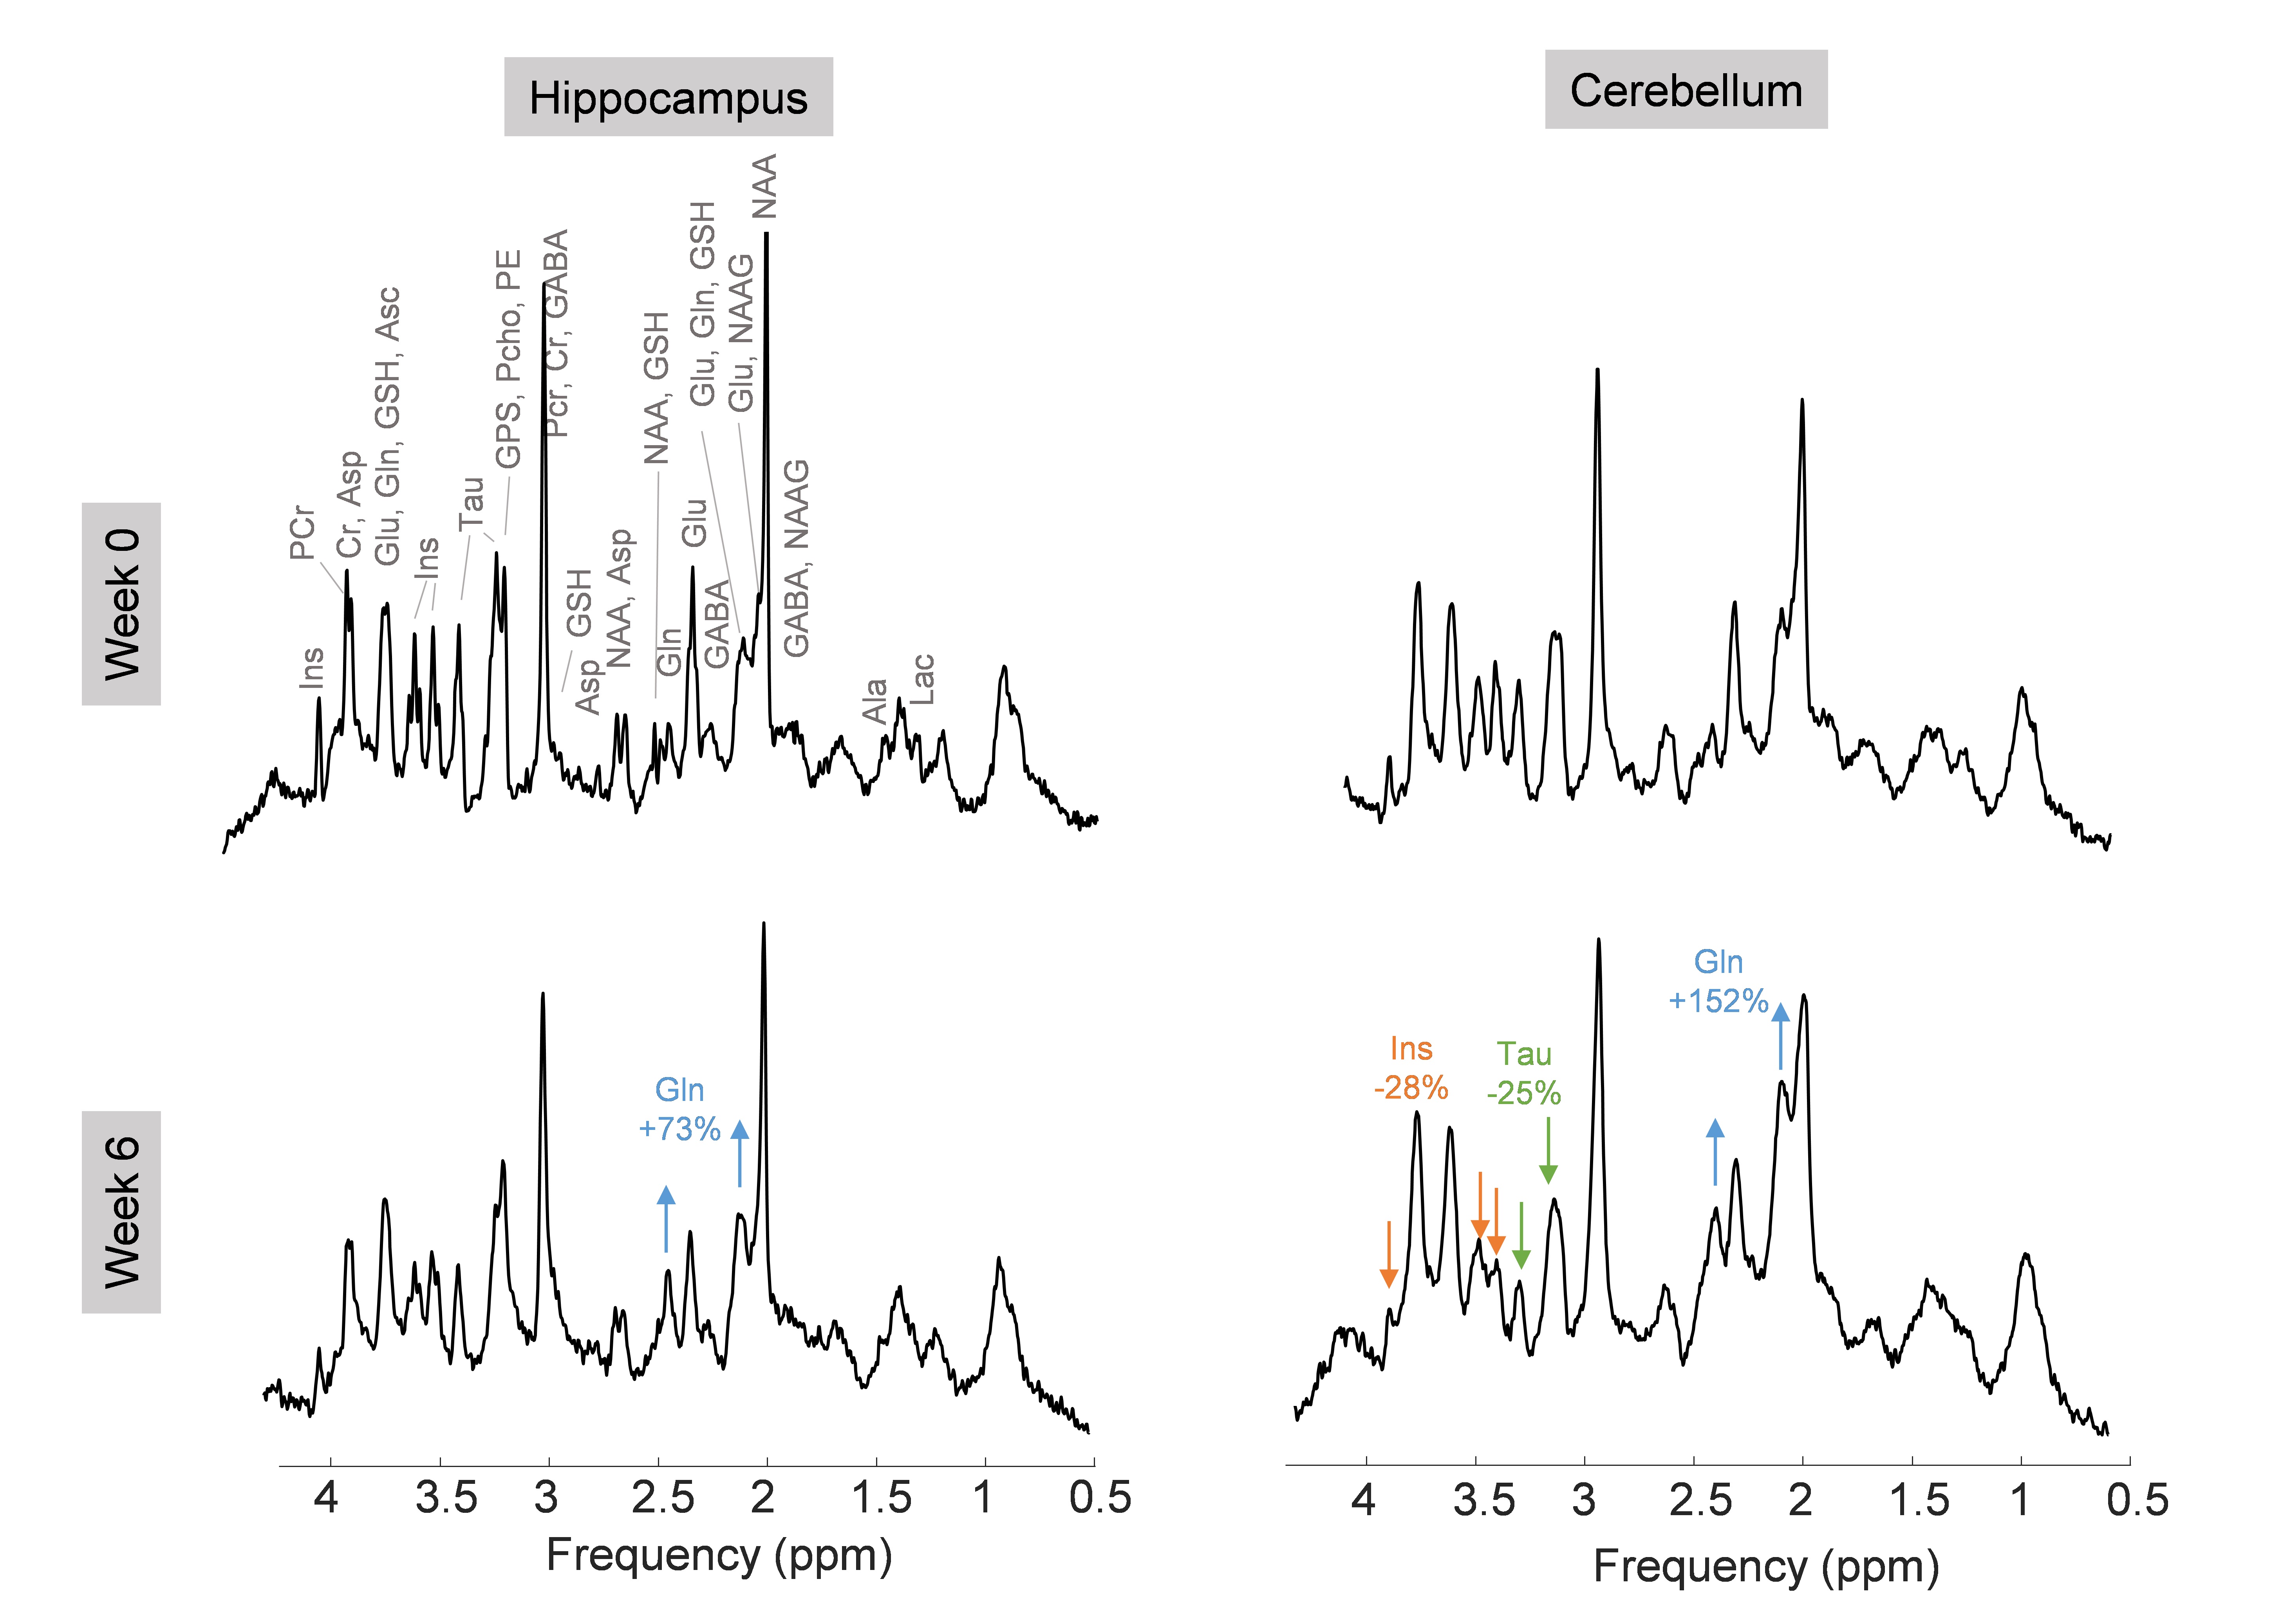
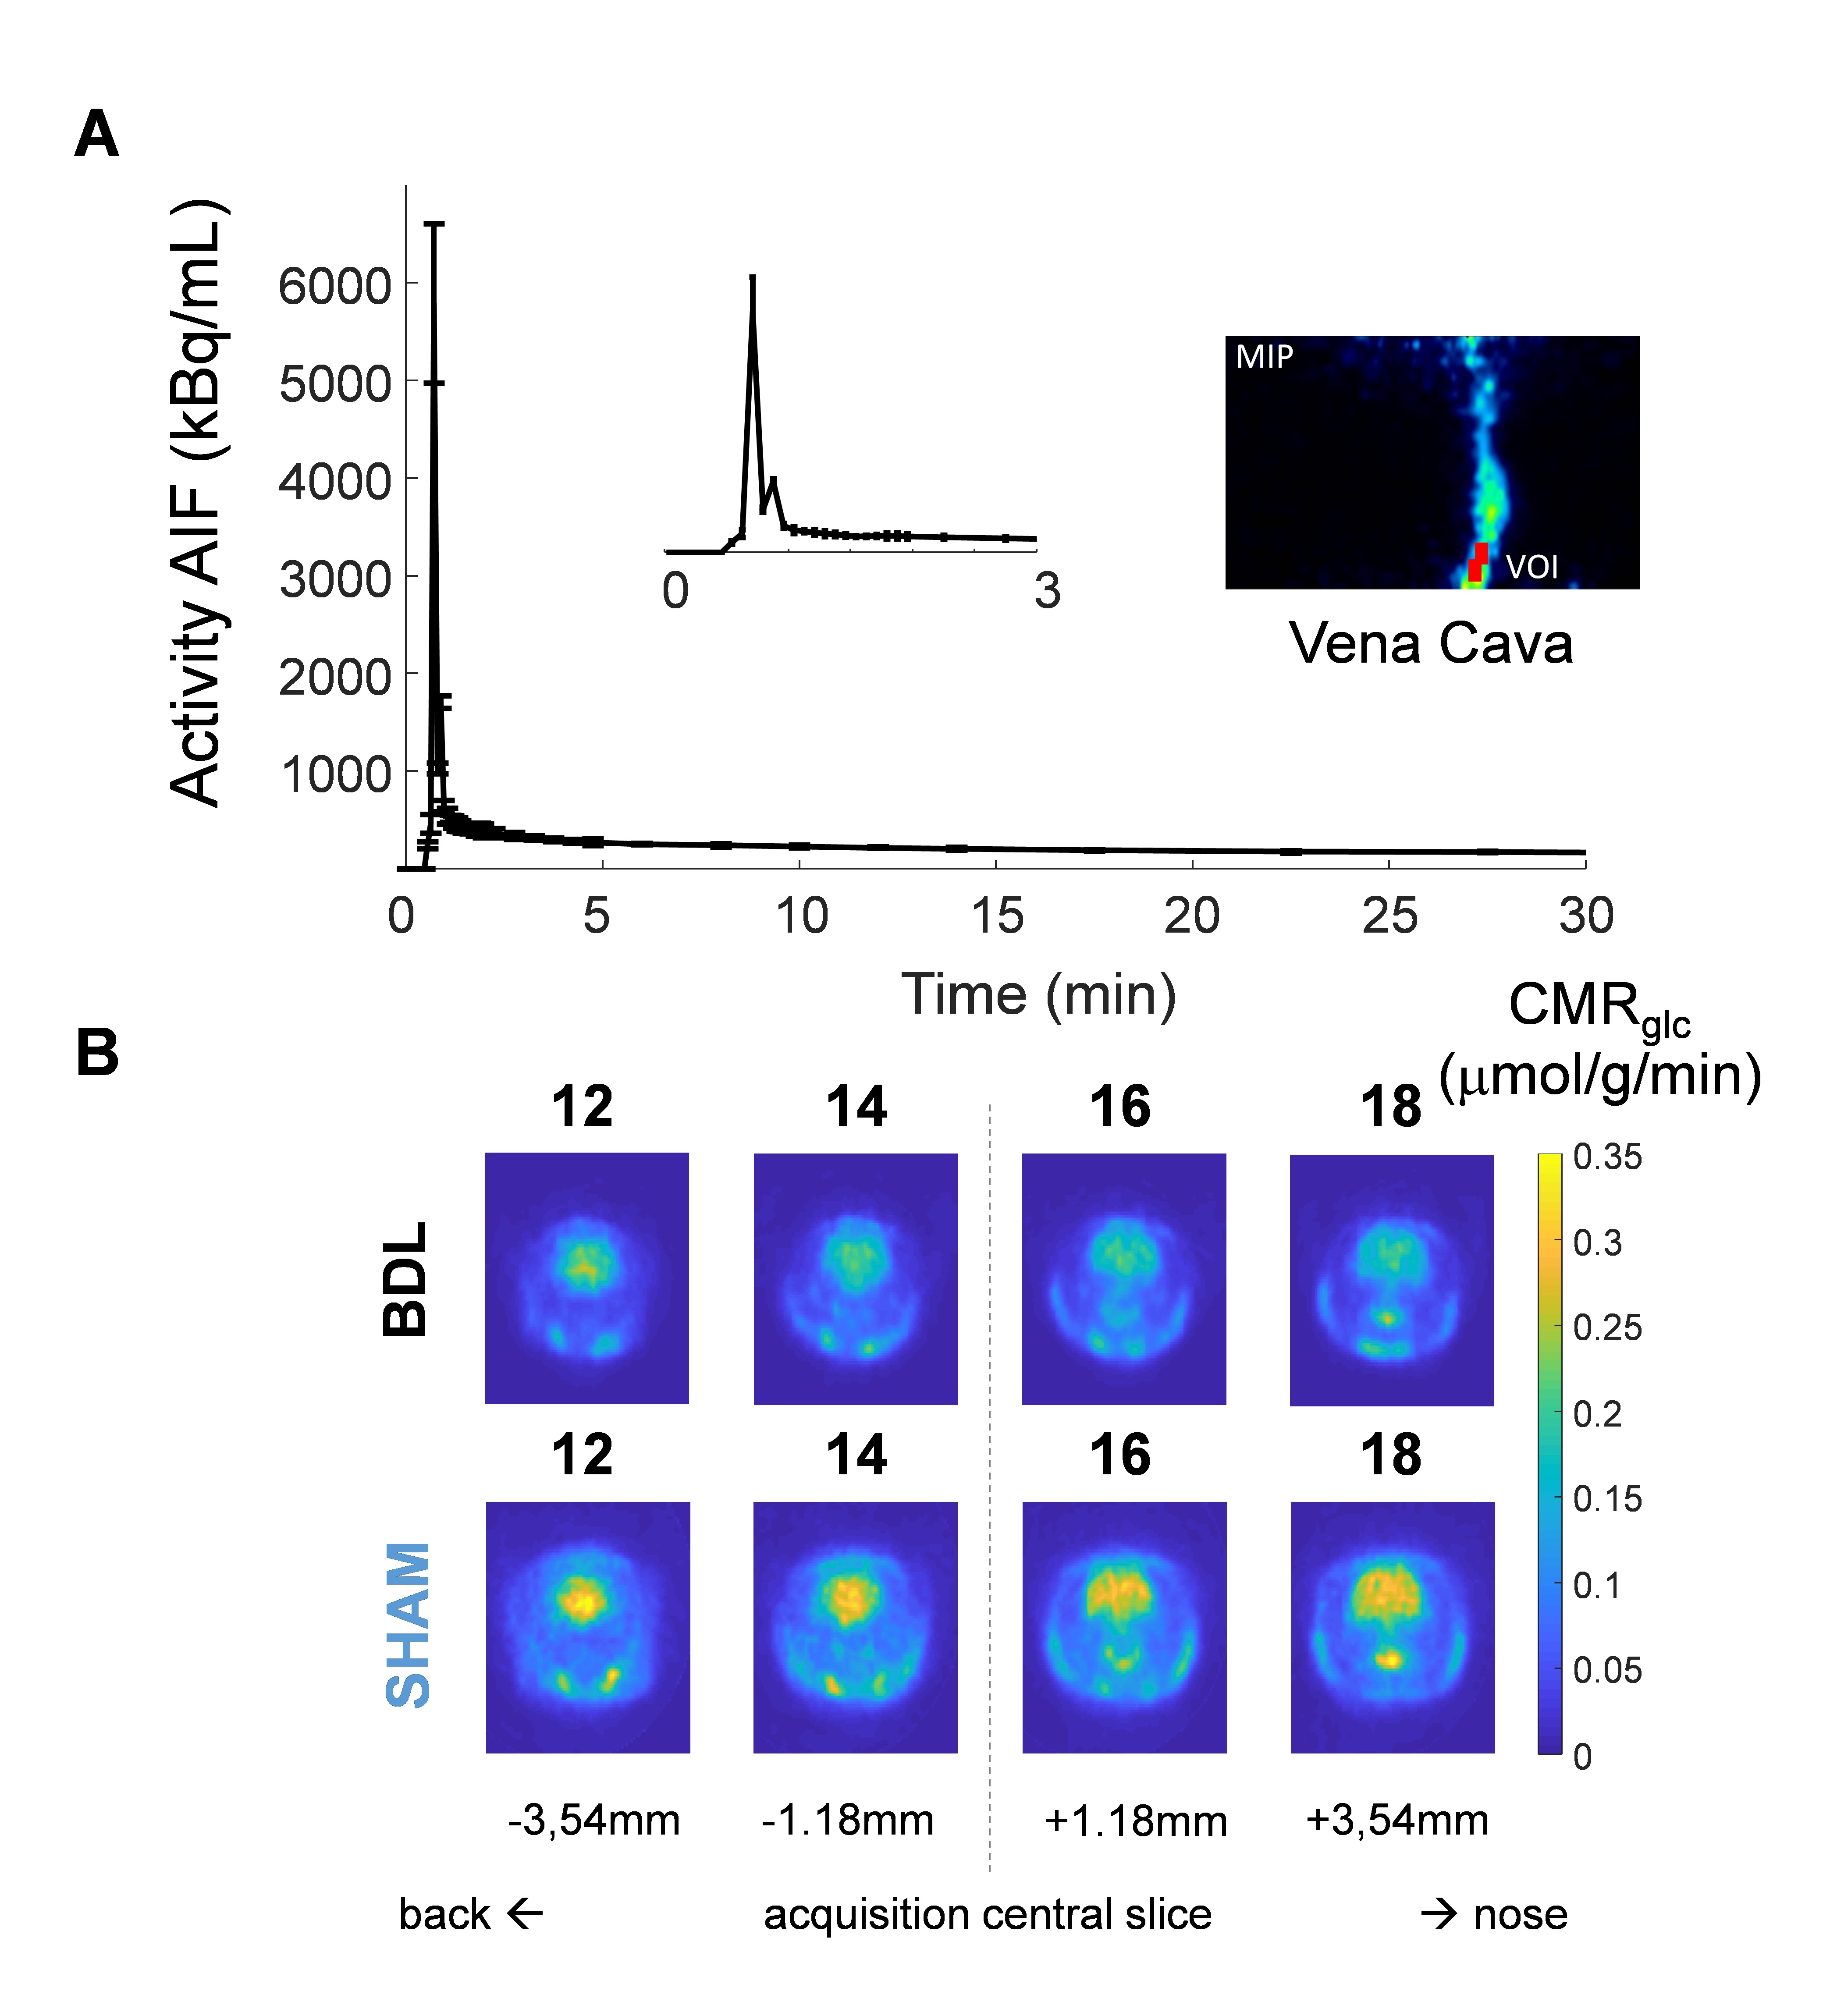
Figure 3 - PET experiments on BDL and SHAM rats. A, typical AIF over time for a BDL rat, with a zoom on the first 3 minutes after the bolus injection. The maximum intensity projection of the vena cava with the voxel is displayed. B, CMRglc maps of BDL and SHAM rats on 4 coronal slices.