0495
Metabolic reprogramming associated with IDH1-targeted treatments in low-grade glioma cell models: a 1H and 13C MRS study1Radiology and Biomedical Imaging, University of California, San Francisco, San Francisco, CA, United States, 2Department of Neurological Surgery, University of California, San Francisco, San Francisco, CA, United States, 3Brain Tumor Research Center, University of California, San Francisco, San Francisco, CA, United States
Synopsis
Mutant IDH1 (IDH1mut) drives glioma development, and targeted IDH1mut inhibitors show promising results in clinical trials. However, treatment is not associated with tumor shrinkage, and there is an urgent need for early imaging biomarkers of response. Our studies in IDH1mut-expressing glioma cells indicate that treatment with IDH1mut inhibitors leads to 1H and 13C-MRS-detectable metabolic changes. Specifically, we show a decrease in 2-HG and increase in glutamate, as well as an increase in metabolic flux from glutamine to glutamate. Furthermore, hyperpolarized [1-13C] α-ketoglutarate can probe these alterations in metabolism. This identifies potential non-invasive biomarkers of response to IDH1mut inhibition in glioma.
Introduction
Mutations in the cytosolic enzyme isocitrate dehydrogenase 1 (IDH1) are reported in 70-90% of low-grade gliomas and secondary glioblastomas1, 2. Mutant IDH1 (IDH1mut) induces MRS-detectable metabolic reprogramming and catalyzes the reduction of α-ketoglutarate (α-KG) to 2-hydroxyglutarate (2-HG), an oncometabolite that drives tumorigenesis1, 2. Inhibition of IDH1mut is therefore an attractive therapeutic approach and targeted inhibitors of IDH1 and pan-IDH1/2 such as AG-120 and AG-881, respectively, have shown promising results in clinical trials for gliomas7, 8. However, response is typically associated with inhibition in tumor growth rather than tumor shrinkage. Therefore, there is an urgent need to identify non-invasive methods of imaging response to IDH1mut inhibitor therapy. Prior work from our laboratory has revealed the role of 2-HG in inducing a broad magnetic resonance spectroscopy (MRS)-detectable metabolic reprogramming in IDH1mut glioma cells3-6. Therefore, the goal of this study was to examine the utility of 1H and 13C magnetic resonance spectroscopy (MRS) to non-invasively image response to IDH1mut inhibition in low-grade gliomas.Methods
Two genetically engineered cell lines were transduced to express IDH1mut (U87IDH1mut and NHAIDH1mut) and maintained in culture as described3. Cells were labeled with [1-13C] glucose or [3-13C] glutamine4 and treated every 24 hours with 1µM AG-120, 1µM AG-881, or DMSO (vehicle, >0.1%) for 72 hours. Metabolites were extracted using the dual-phase extraction method as described9 and 1H-MRS (90˚ FA, 3s TR, 384 acquisitions) and 13C-MRS (30˚ FA, 3s TR, 2048 acquisitions) spectra were acquired using a 500MHz Bruker Avance spectrometer. Detectable metabolites were quantified by peak integration using Mnova (Mestrelab), corrected for saturation effects and NOE and normalized to cell number and external reference (43mM TSP)3. Statistical significance of differences was determined using an unpaired Student’s t-test, with p<0.05 considered significant. For hyperpolarized 13C-MRS experiments, [1-13C] α-ketoglutarate was prepared as described6, polarized (Oxford HyperSense DNP), dissolved in isotonic buffer, and injected into cell suspensions or lysates in a 5mm NMR tube. 13C-MRS spectra were acquired every 3 seconds for 300 seconds using a 1.5T pulsar spectrometer or 500MHz Varian spectrometer. Spectrophotometric enzyme assays were performed on an Infinite m200 spectrophotometer (Tecan Systems) using appropriate activity assay kits (Biovision).Results and Discussion
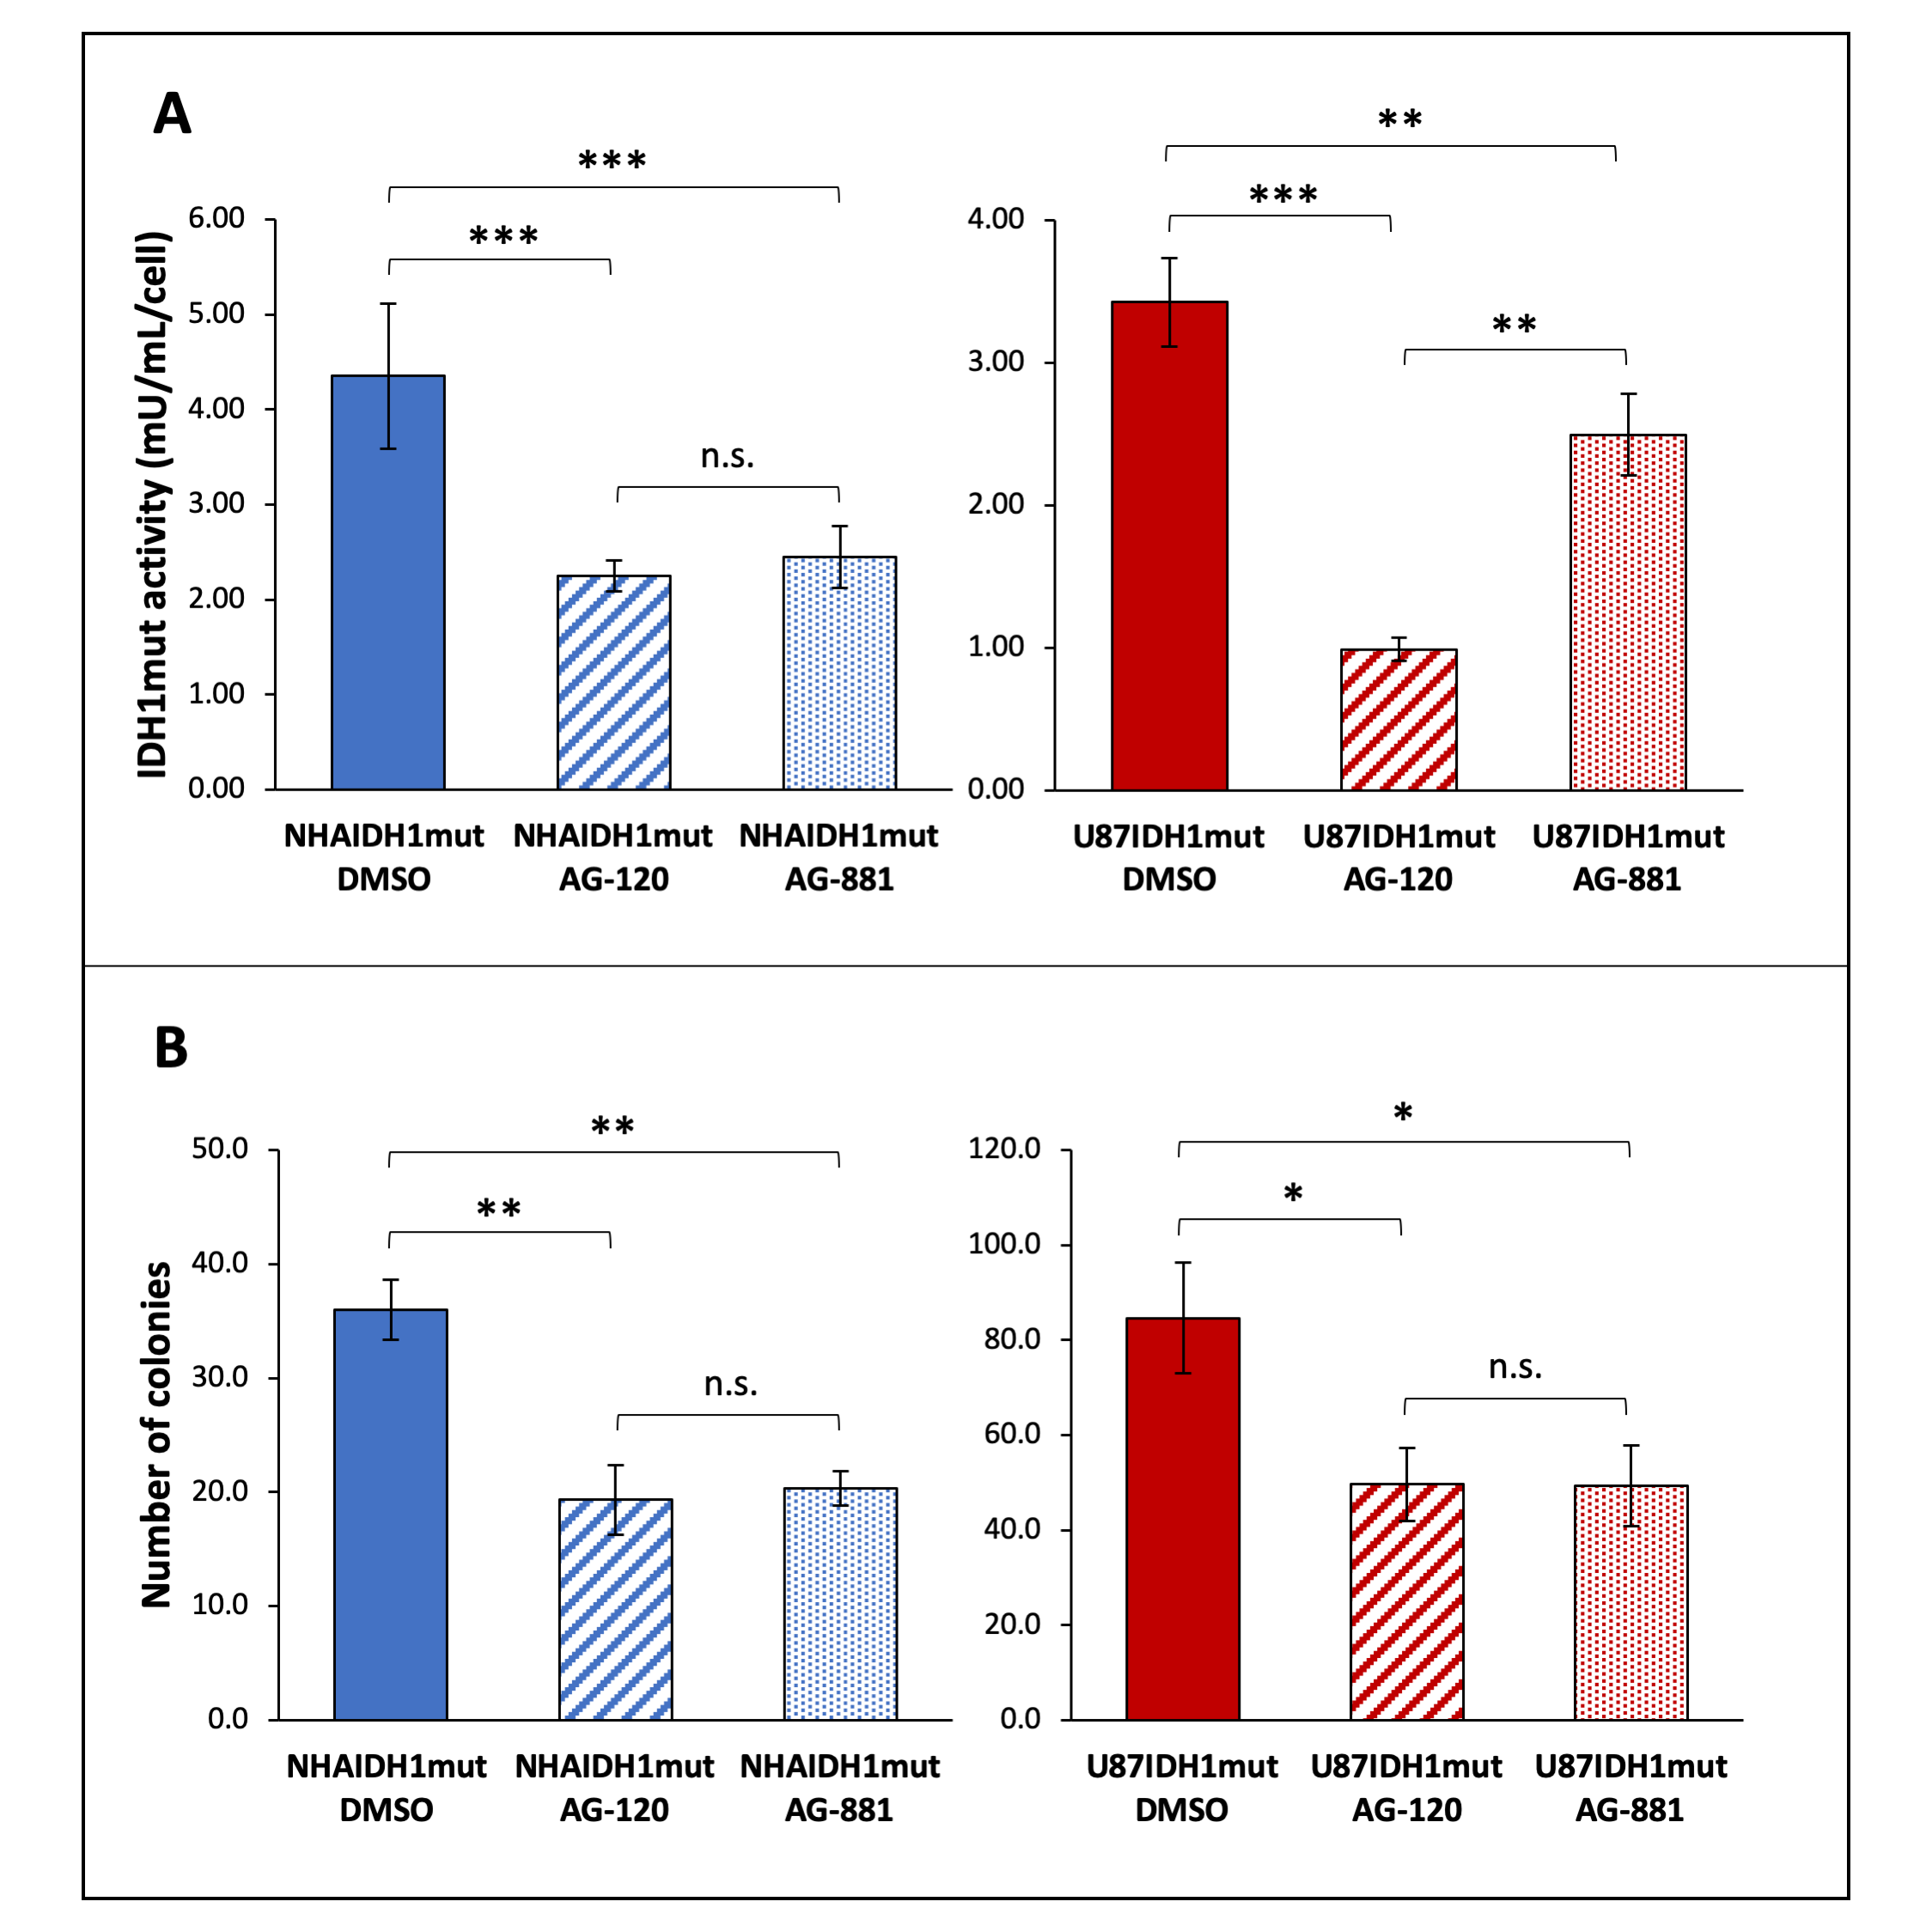
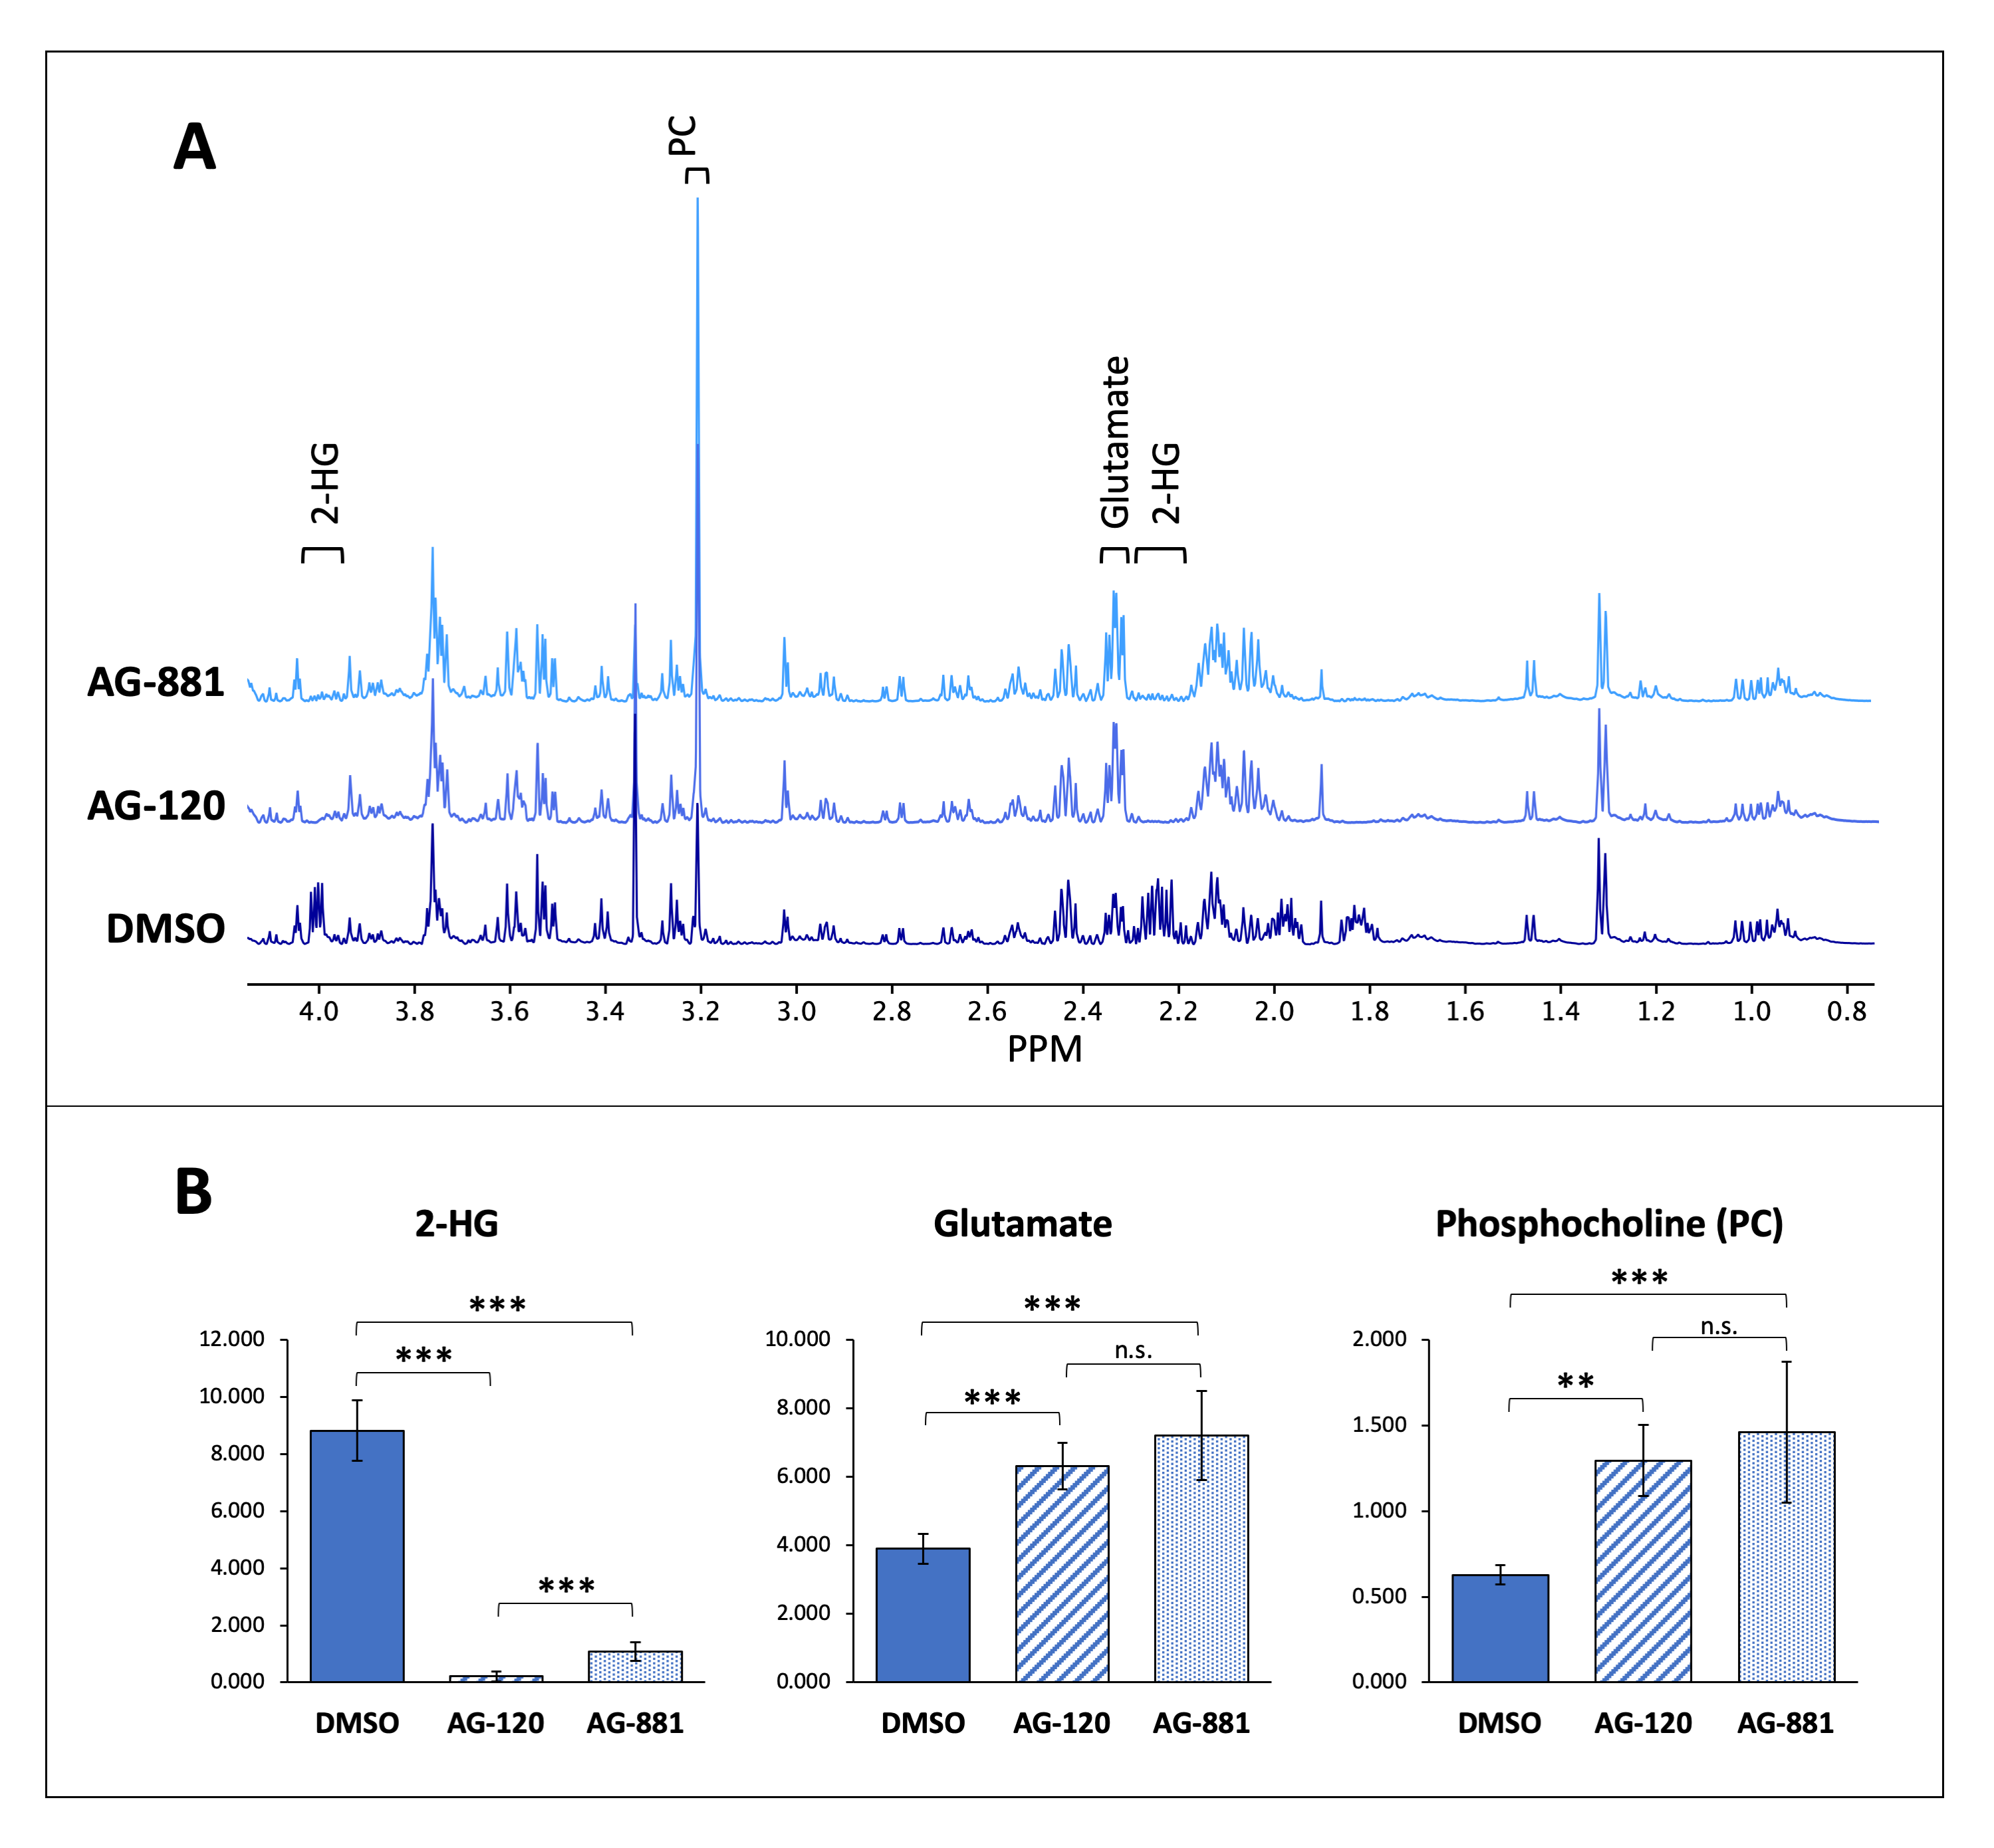
Prior to investigating the metabolic effects of AG-120 and AG-881, we confirmed that treatment results in a significant drop (30-70%) in IDH1mut activity in both cell models (NHAIDH1mut and U87IDH1mut) compared with DMSO-treated control cells (Fig. 1A). Additionally, IDH1mut inhibition was associated with a significant drop (40-50%) in the number of colonies produced by both cell models (Fig. 1B).As expected, our 1H-MRS data indicated that treatment of both cell models with AG-120 or AG-881 induced a significant decrease in steady-state 2-HG compared with control cells. Interestingly however, we also observed a significant increase in steady-state glutamate and phosphocholine, pointing to broader changes in the metabolism of treated cells and a unique MRS-detectable signature (Fig. 2A-2B, data shown only for NHAIDH1mut model; similar data observed for U87IDH1mut).
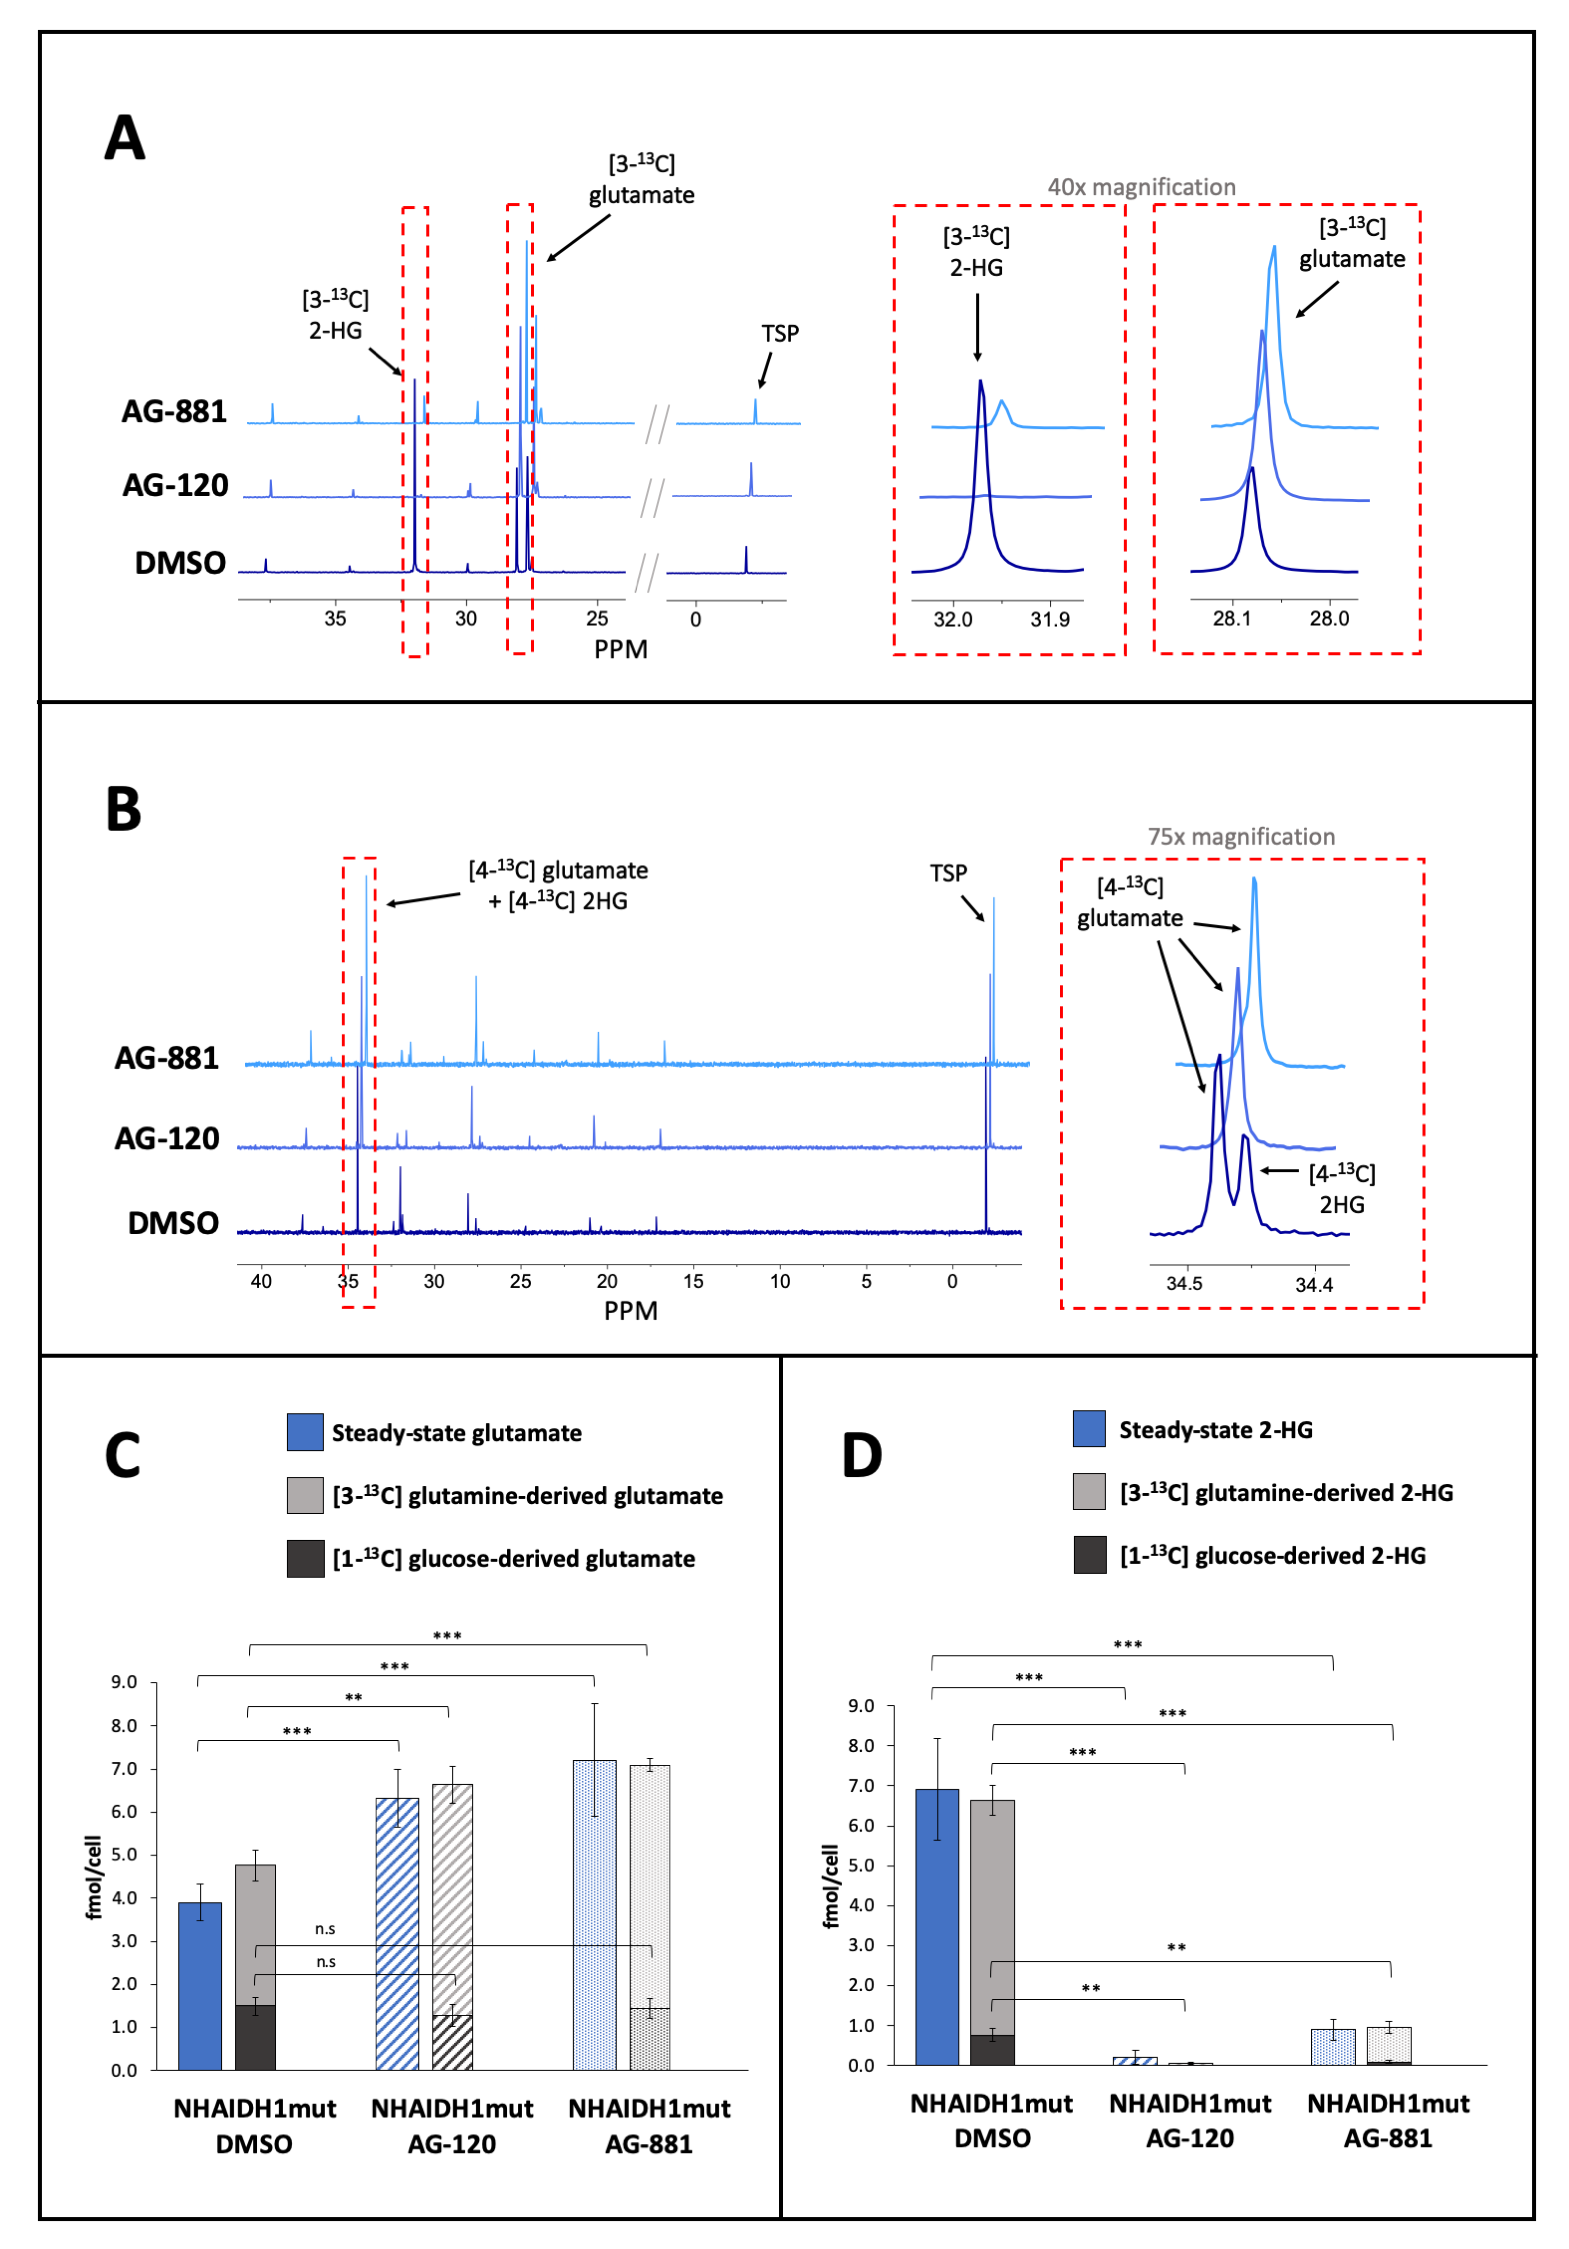
To further evaluate whether changes in steady-state levels of glutamate and 2-HG were associated with altered metabolic fluxes, we probed glutamate and 2-HG synthesis from [1-13C] glucose or [3-13C] glutamine, the main metabolic precursors of these metabolites3. 13C-MRS data showed a significant increase in the flux of [3-13C] glutamine to glutamate following AG-120 or AG-881 treatment in both cell models (Fig. 3A&3C). The flux of [1-13C] glucose to glutamate remained unchanged in the NHAIDH1mut model (Fig. 3B&3C) and was slightly increased in the U87IDH1mut model. Fluxes from both [1-13C] glucose and [3-13C] glutamine to 2-HG were significantly decreased following treatment in both cell models (Fig. 3D).
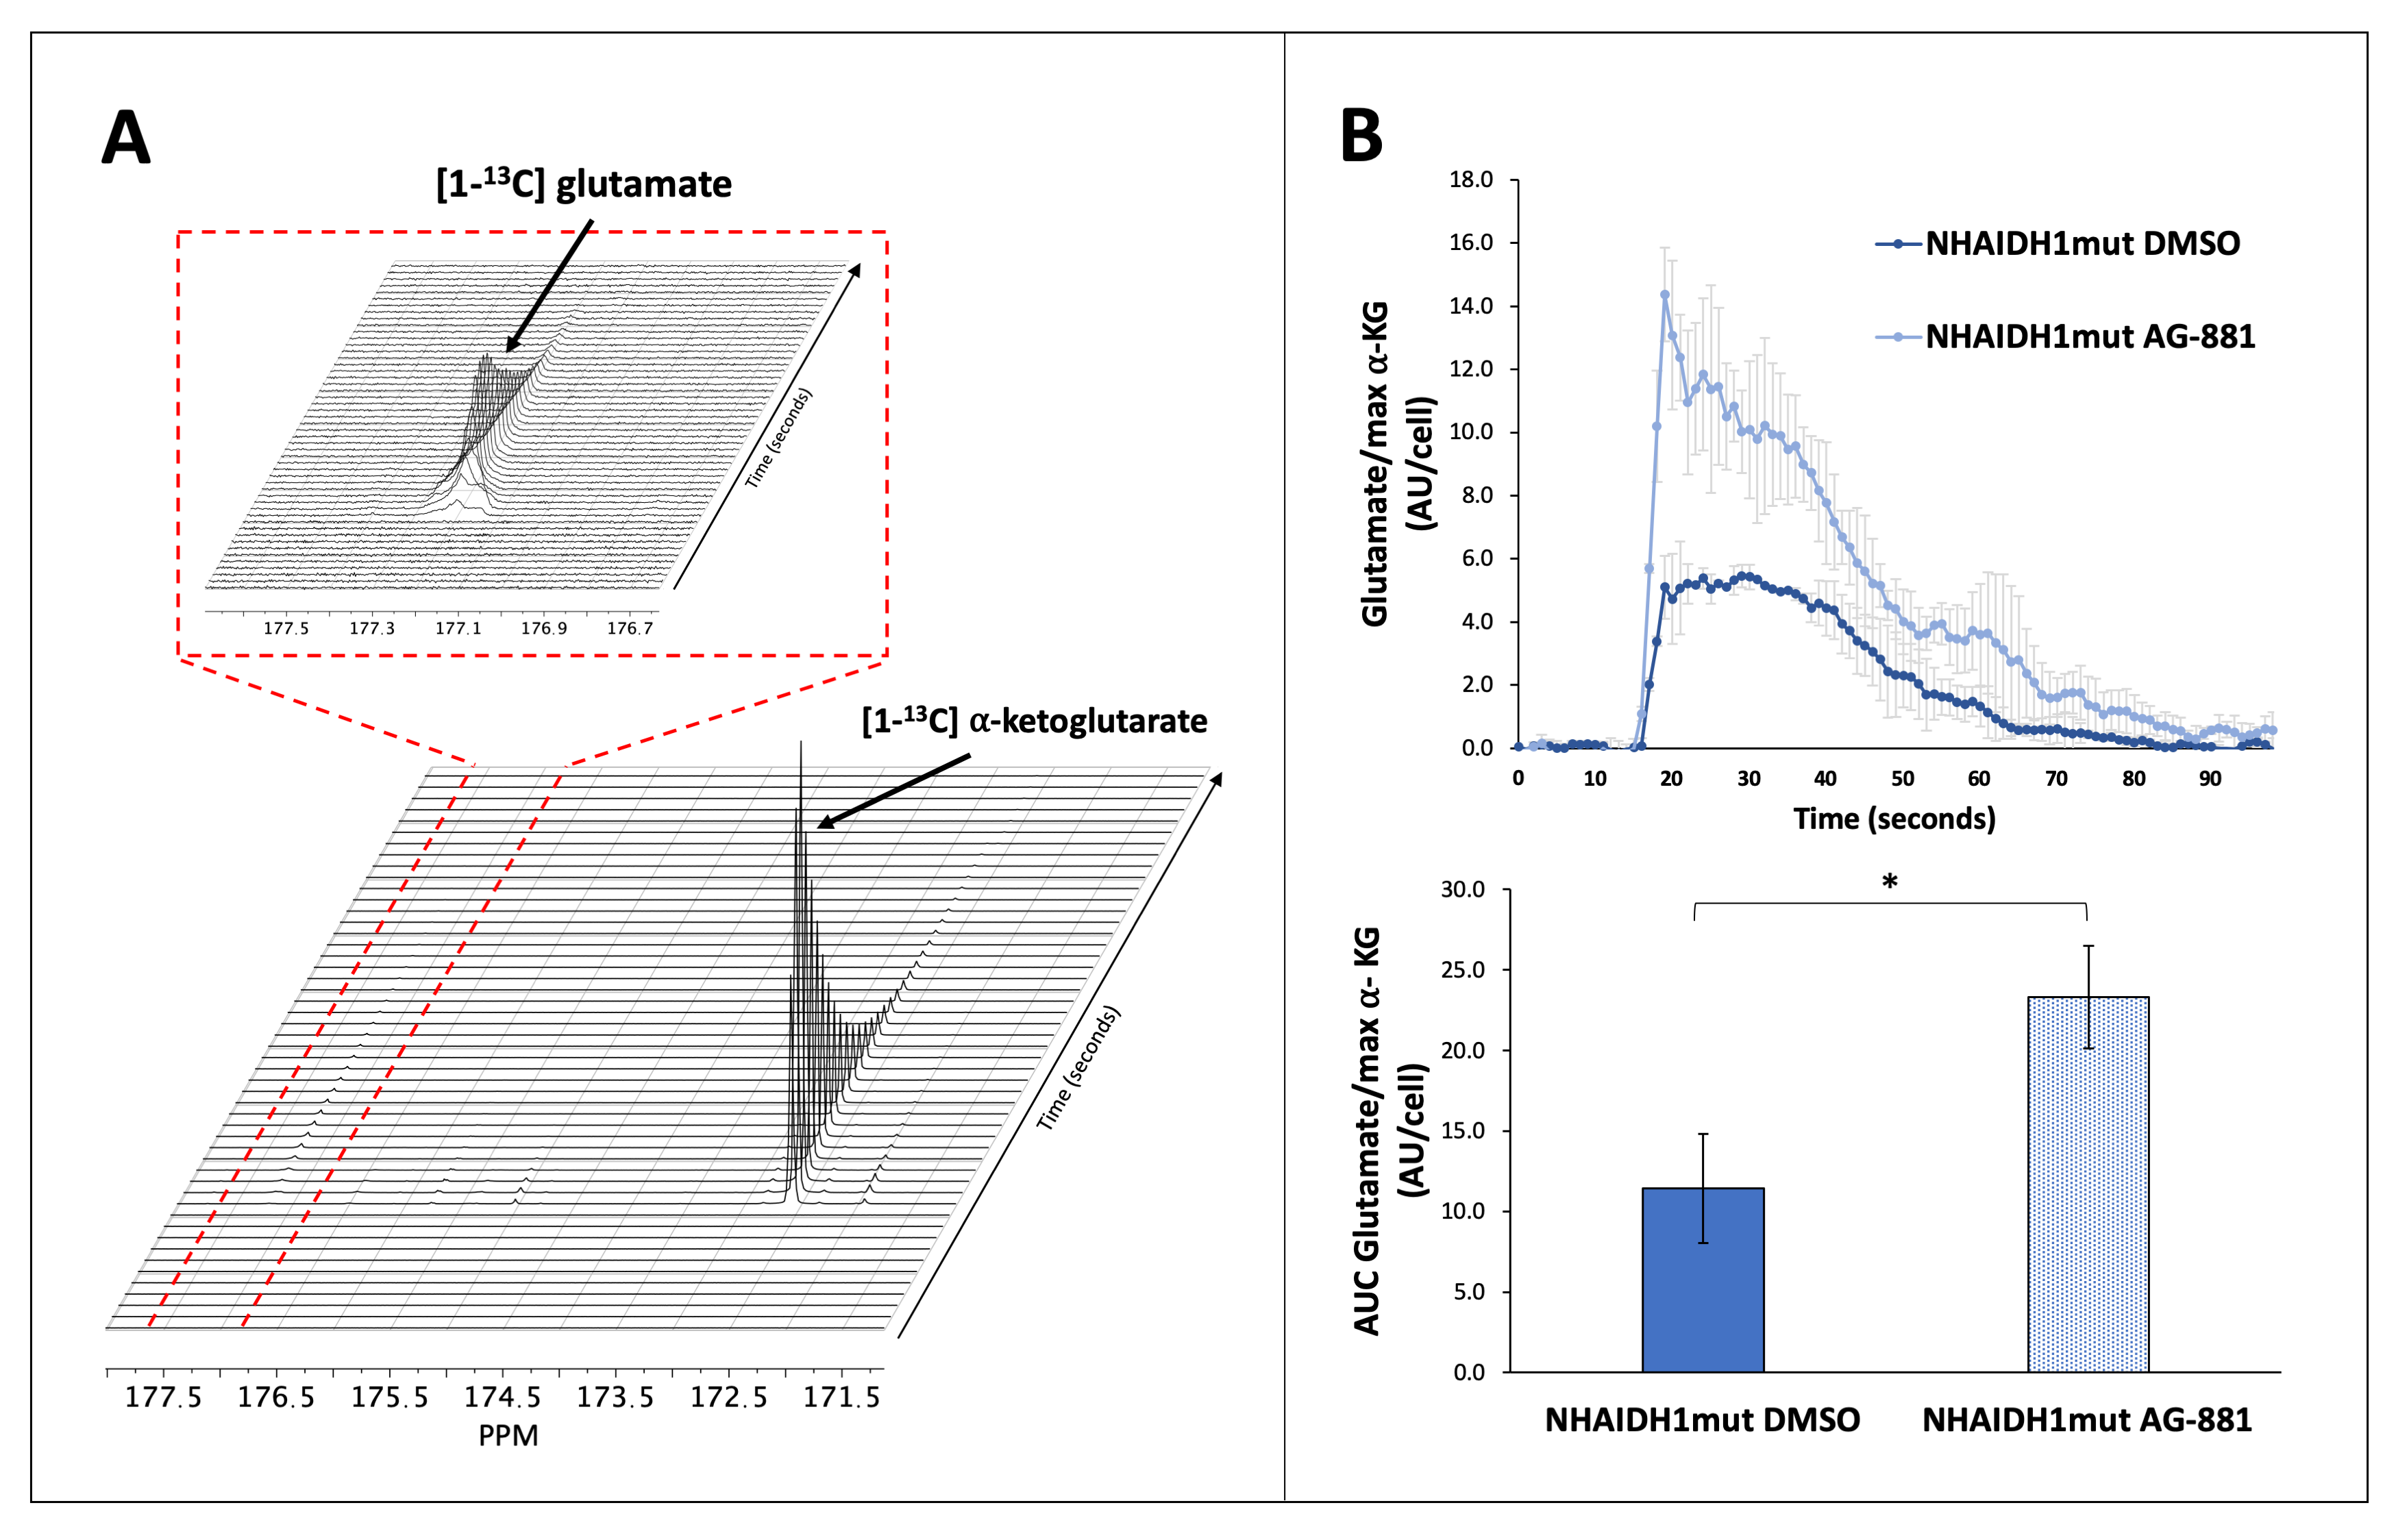
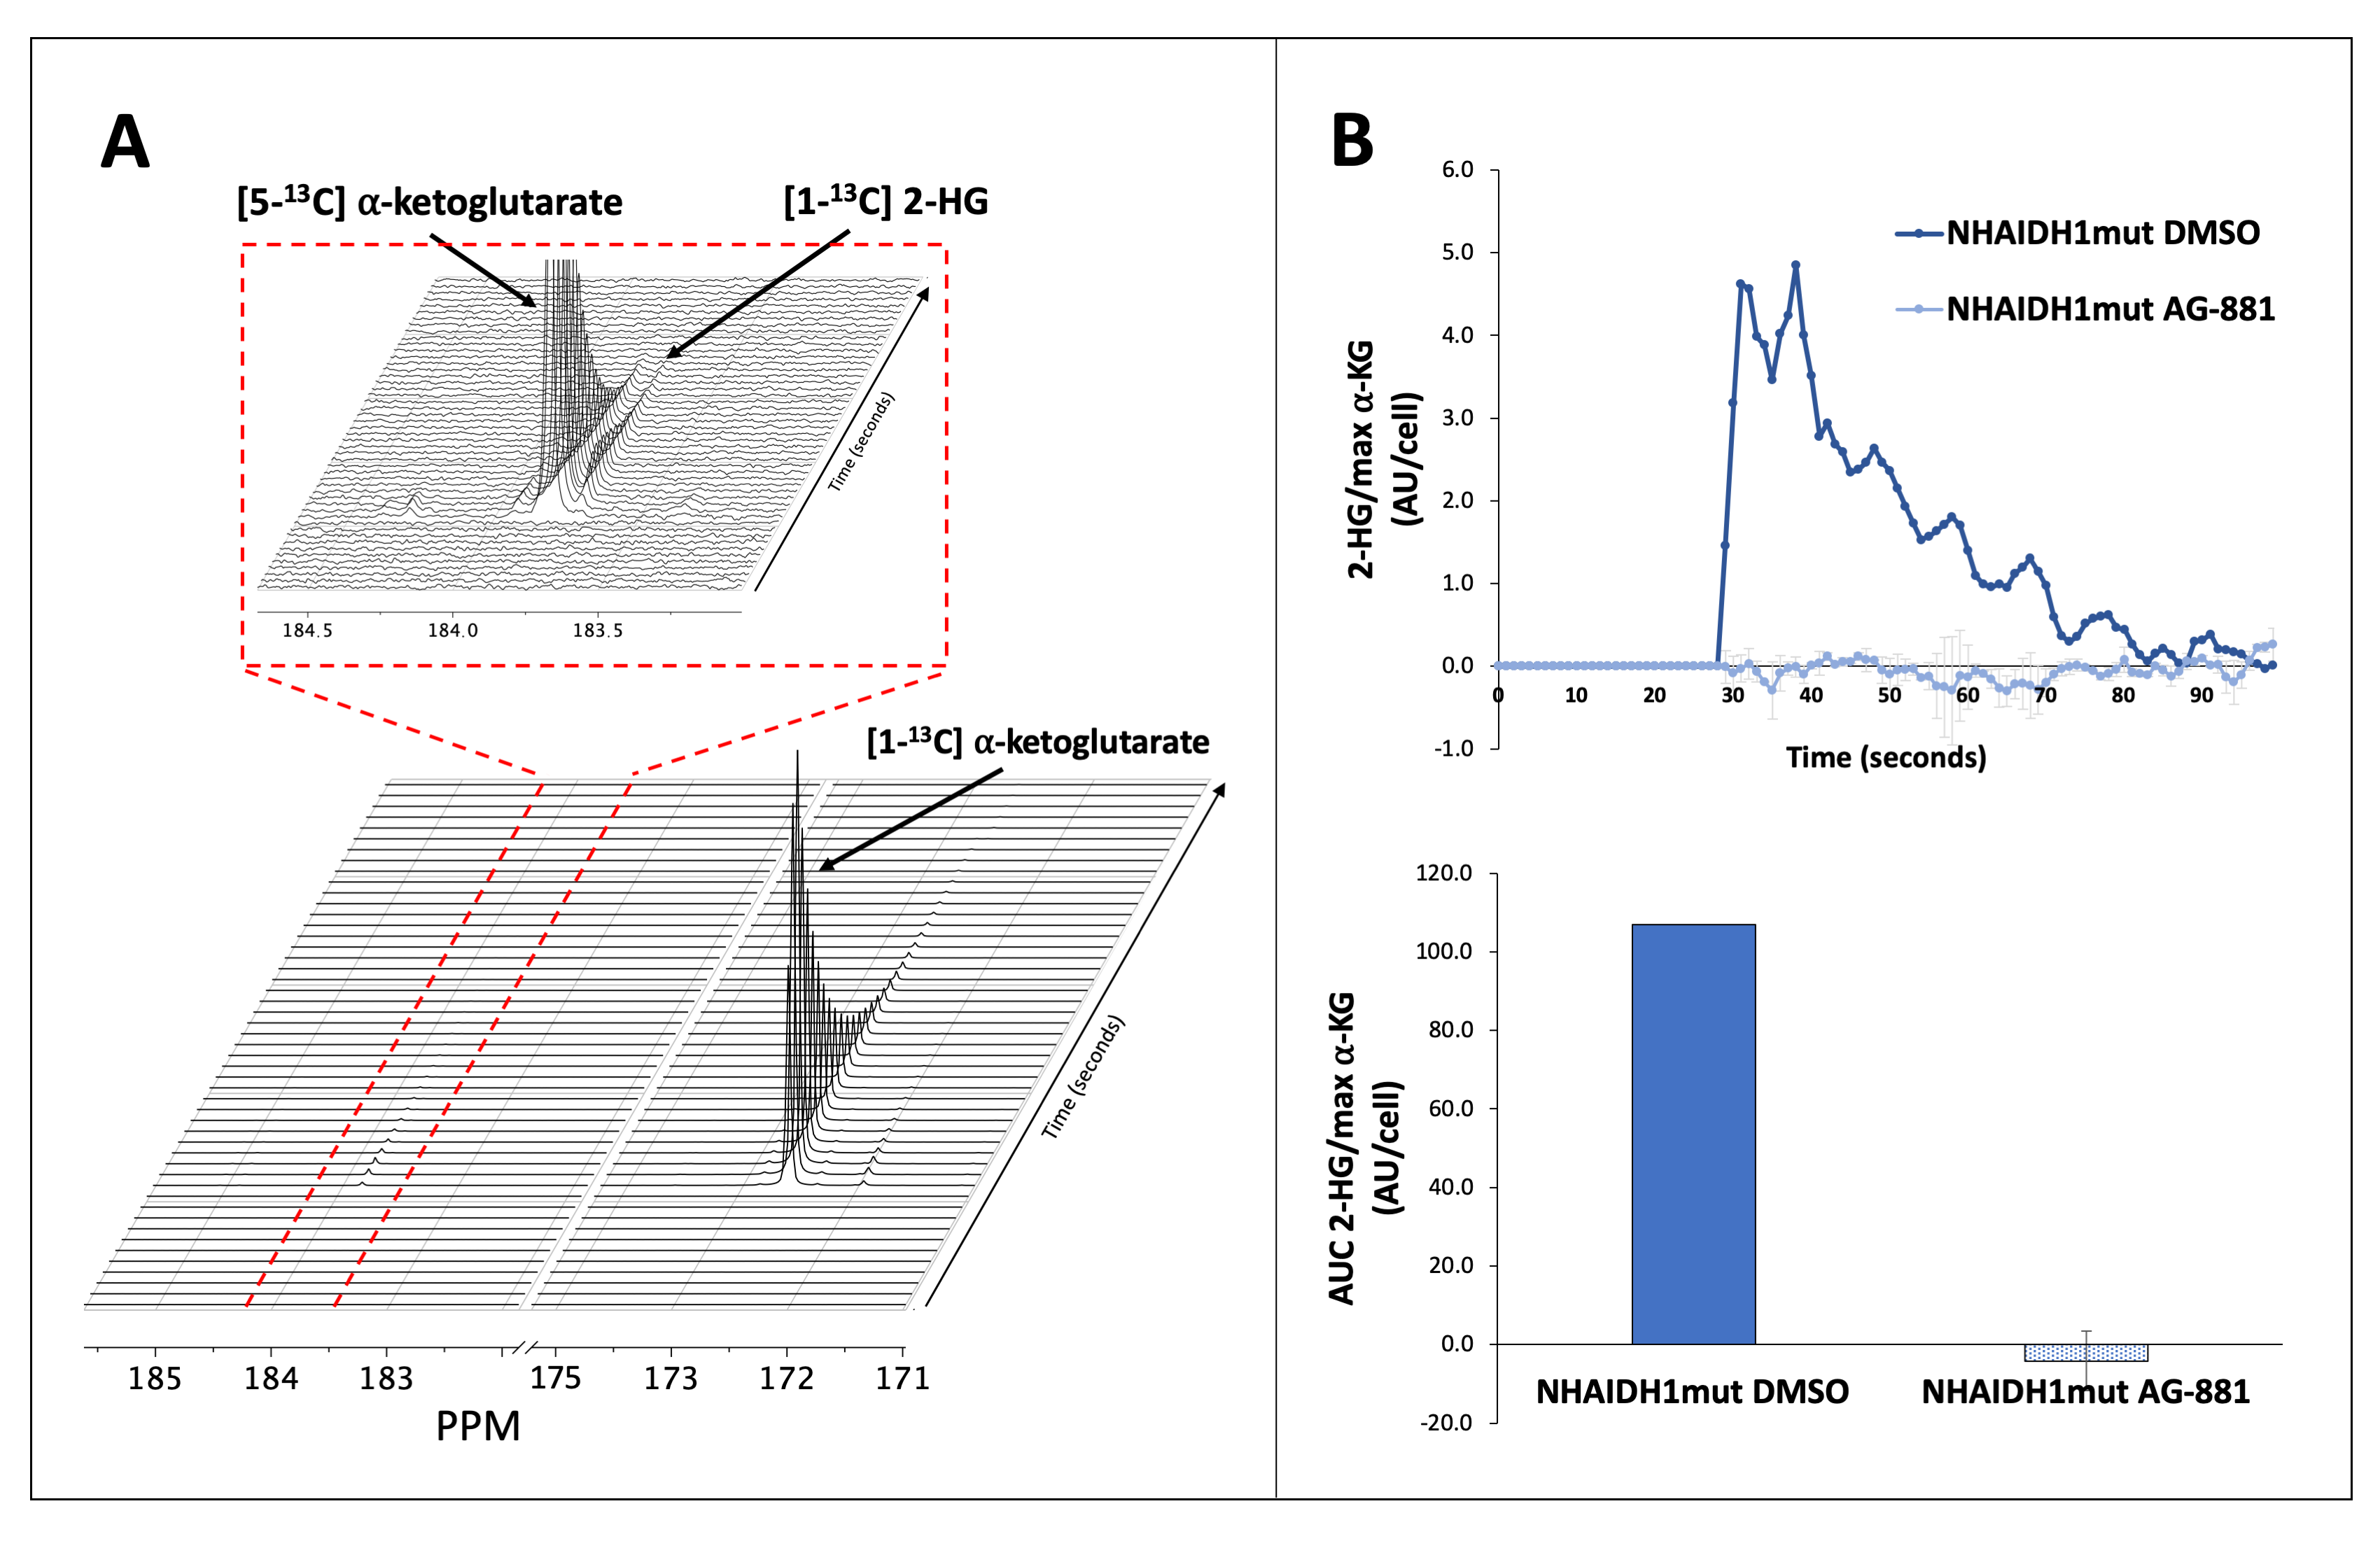
Based on these results, we dynamically probed the metabolism of glutamate and 2-HG from hyperpolarized [1-13C] α-ketoglutarate. We found an increase in metabolism to glutamate (Fig. 4A-4B) and a decrease in metabolism to 2-HG (Fig. 5A-5B) from [1-13C] α-ketoglutarate in treated cells, consistent with the above-mentioned labeling and steady-state results.
Taken together, our studies indicate that IDH1mut inhibition induces unique MRS-detectable metabolic alterations that can potentially be exploited for early non-invasive, clinically translatable detection of response to emerging IDH1mut inhibitors.
Conclusion
In this study, we have identified potential 1H and 13C-MRS detectable biomarkers of response to two IDH1mut inhibitors in glioma. Although further studies are needed to evaluate the utility of these biomarkers in vivo, we expect that hyperpolarized [1-13C] α-ketoglutarate could serve as a metabolic imaging probe for response to treatment.Acknowledgements
This work is supported by NIH R01CA197254, NIH R01CA172845, American Brain Tumor Association grant BRF1700006, UCSF Brain Tumor Loglio CollectiveReferences
1. Yang, H., et al., IDH1 and IDH2 mutations in tumorigenesis: mechanistic insights and clinical perspectives. Clin Cancer Res, 2012. 18(20): p. 5562-71.
2. Dang, L., et al., Cancer-associated IDH1 mutations produce 2-hydroxyglutarate. Nature, 2010. 465(7300): p. 966.
3. Izquierdo-Garcia, J.L., et al., Metabolic reprogramming in mutant IDH1 glioma cells. PLoS One, 2015. 10(2): p. e0118781.
4. Izquierdo-Garcia, J.L., et al., IDH1 Mutation Induces Reprogramming of Pyruvate Metabolism. Cancer Res, 2015. 75(15): p. 2999-3009.
5. Chaumeil, M.M., et al., Hyperpolarized [1-13C] glutamate: a metabolic imaging biomarker of IDH1 mutational status in glioma. Cancer Res, 2014. 74(16): p. 4247-57.
6. Chaumeil, M.M., et al., Non-invasive in vivo assessment of IDH1 mutational status in glioma. Nat Commun, 2013. 4: p. 2429.
7. Yen, K., et al., Abstract B126: AG-881, a brain penetrant, potent, pan-mutant IDH (mIDH) inhibitor for use in mIDH solid and hematologic malignancies. Mol Cancer Ther.
8. Mellinghoff, I.K., et al., ACTR-46. AG120, a first-in-class mutant IDH1 inhibitor in patients with recurrent or progressive IDH1 mutant glioma: results from the phase 1 glioma expansion cohorts. Neuro Oncol. 18(suppl_6): p. vi12.
9. Ronen, S.M., et al., Magnetic resonance detects changes in phosphocholine associated with Ras activation and inhibition in NIH 3T3 cells. Br J Cancer, 2001. 84(5): p. 691-6.
Figures