0494
Cerebral energy metabolism and neurotransmission in a schizophrenia mouse model: a combined 1H-[13C] MRS and 13C MRS study at 14.1T1LIFMET, Ecole Polytechnique Fédérale de Lausanne, Lausanne, Switzerland, 2Center for Psychiatric Neuroscience, Department of Psychiatry, Lausanne University Hospital (CHUV), Prilly, Switzerland, 3Center for Biomedical Imaging (CIBM), Ecole Polytechnique Fédérale de Lausanne, Lausanne, Switzerland, 4HES-SO, University of Applied Sciences of Western Switzerland, HEIA-FR, Institute of Chemical Technology, Fribourg, Switzerland
Synopsis
In this study, we applied interleaved localized 1H-[13C]-MRS and direct 13C MRS with polarization transfer to characterize brain energy metabolism in the early development of a GCLM-KO mouse model with infusion of [2-13C]acetate. This strategy enabled to measure simultaneously the [2-13C]acetate input function, glutamate and glutamine C4 and C3 enrichment and pool size changes. Two-compartment metabolic modelling was then applied to characterize mitochondrial metabolism and glutamate/glutamine cycling and compare it to a control group.
Introduction
Schizophrenia(SZ) is a neurodevelopment disorders involving both genetic and environmental risk factors. Large amount of 1H MRS studies have shown changes in glutamate and glutamine levels in brains of schizophrenic patients are generally interpreted as markers of glutamatergic dysfunction1. How this relates to alterations of the glutamate/glutamine neurotransmission cycle remains unclear. Mice with genetic deletion (knockout) of the GCLM gene (KO) display a chronic GSH deficit and phenotypic anomalies that are similar to those observed in patients2. These deficits are aggravated by additional oxidative stress during particular developmental periods. To investigate this, we investigated brain energy metabolism and glutamate-glutamine cycling with dynamic 13C MRS under infusion of [2-13C]acetate in GCLM-KO mice under early postnatal oxidative challenge.Methods
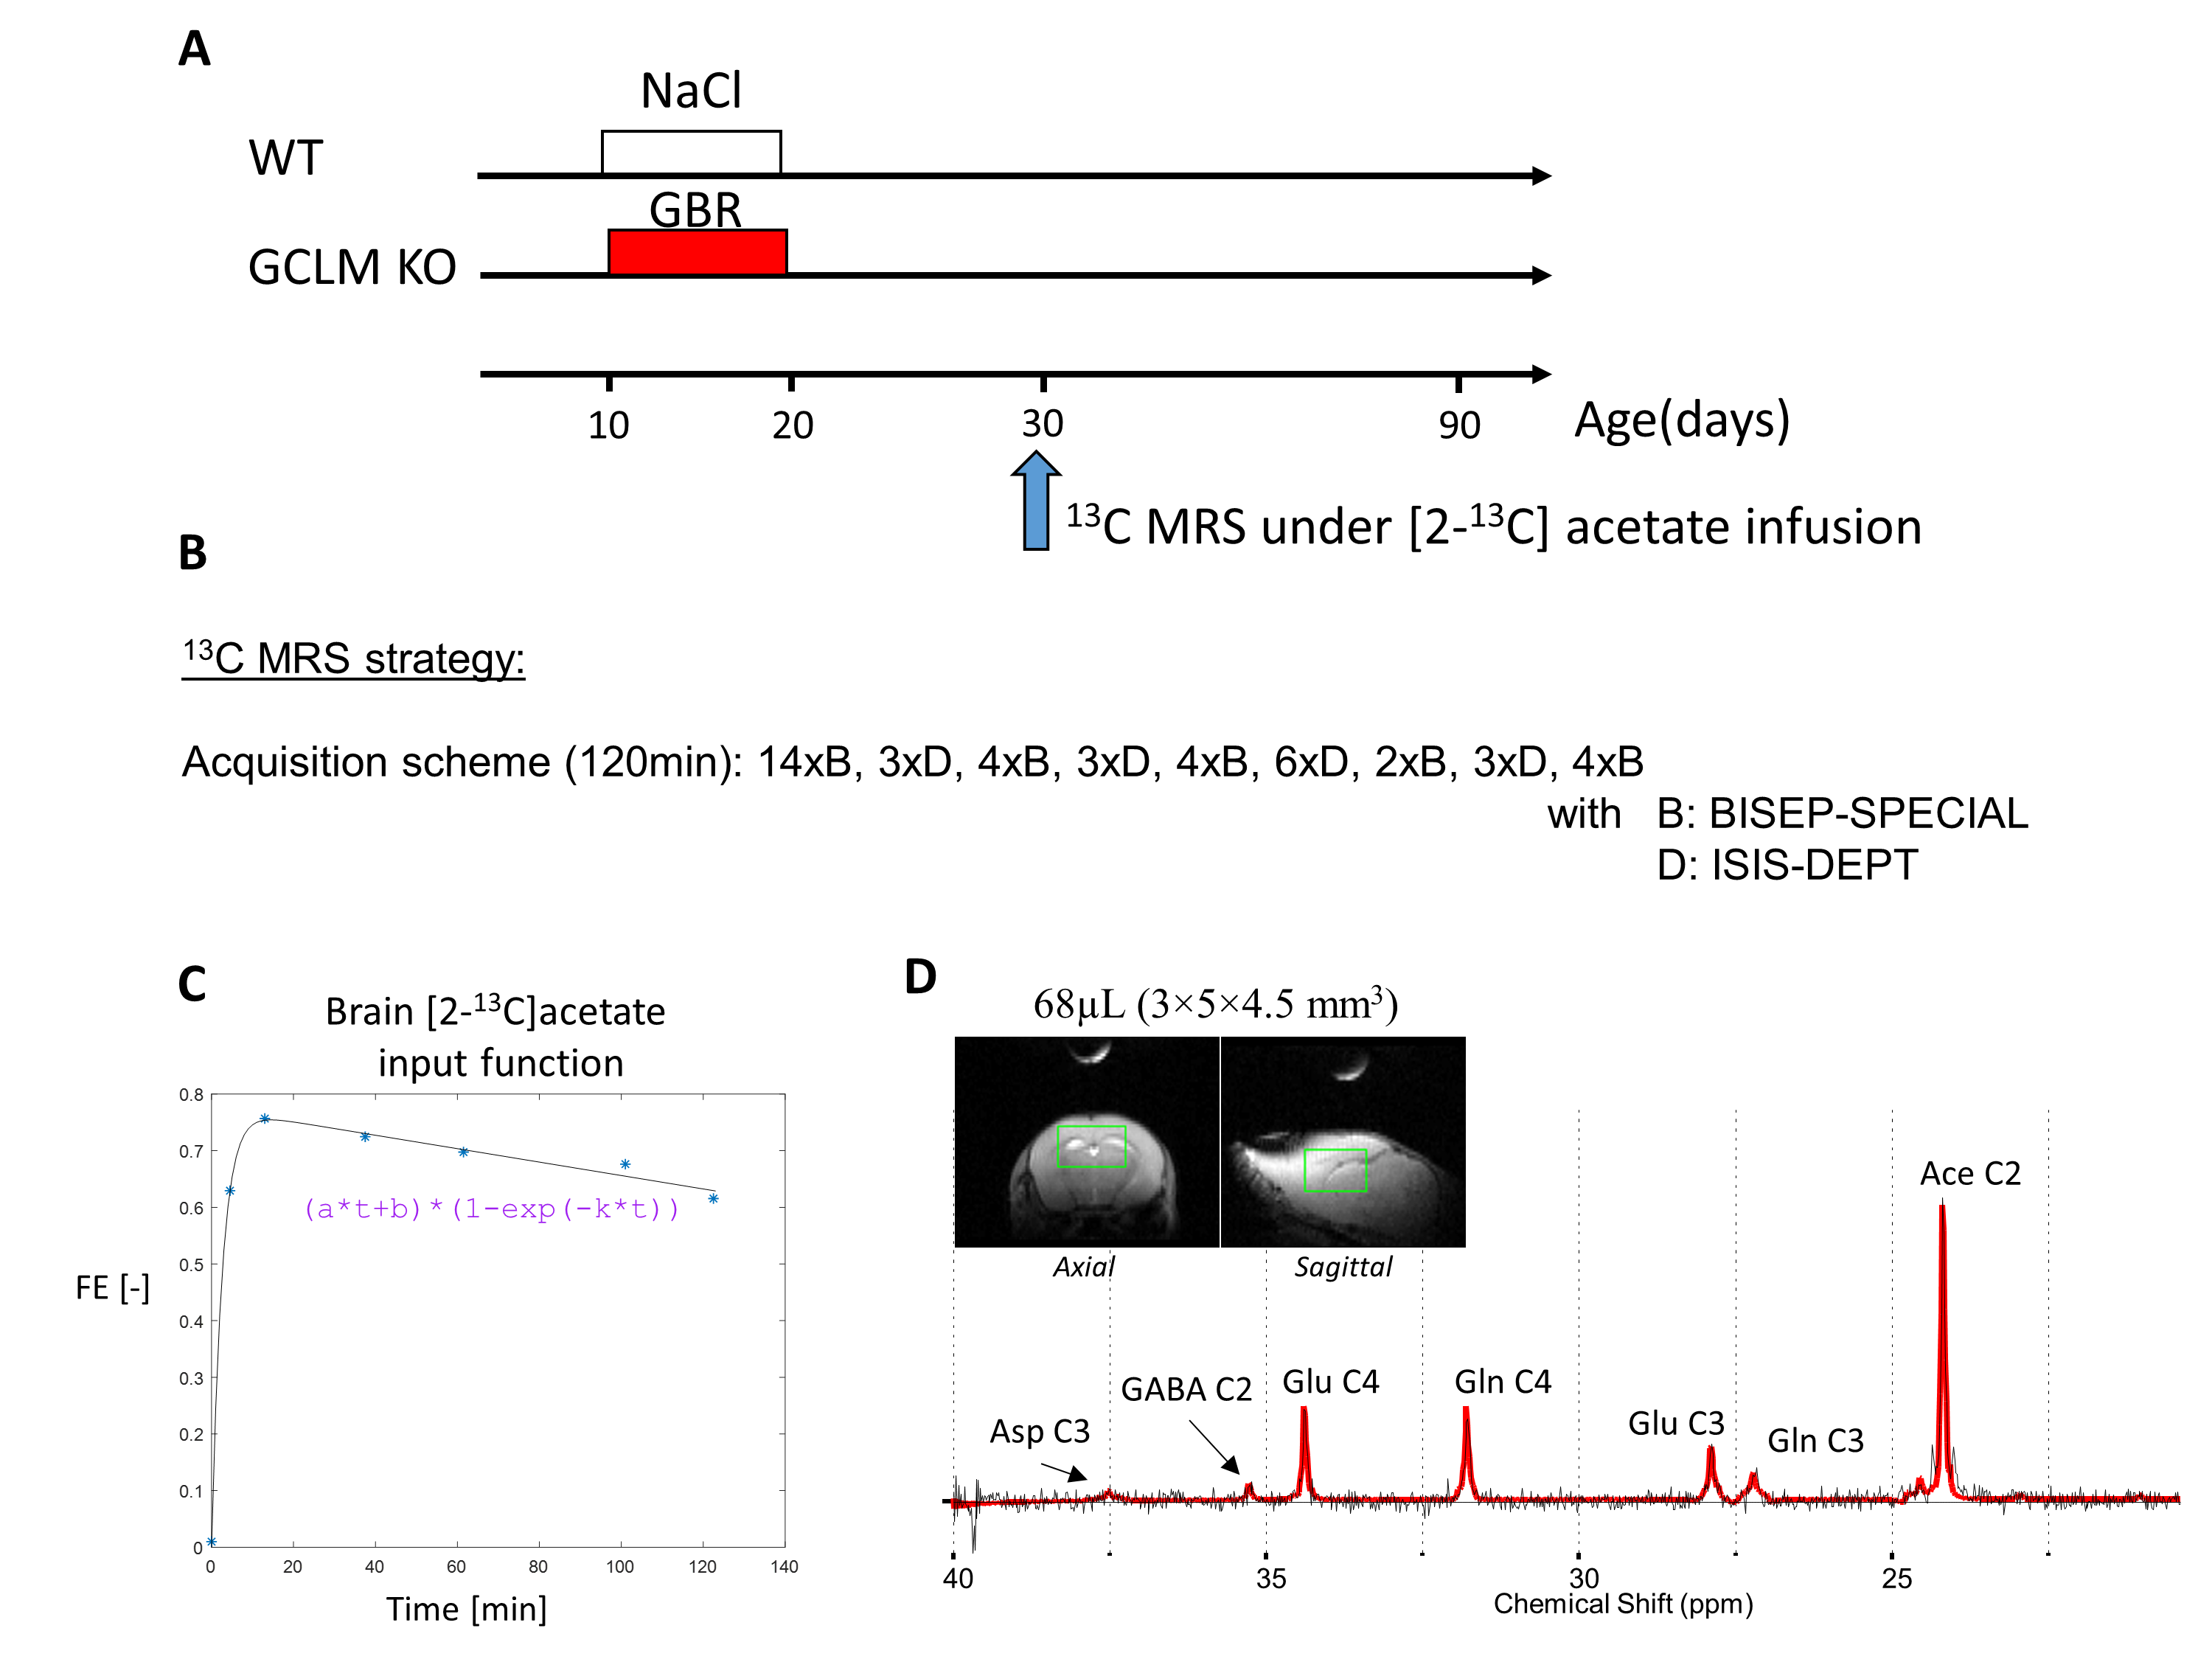
Animal preparationTwo groups of 30 days old C57BL6/J mice (9.3-17.0g) were used in this study: a first group of GCLM-KO mice (n=13, 7 females) with early postnatal oxidative challenge by administration of dopamine uptake inhibitor GBR12909 during postnatal development (P10-20), and a second group of wild type (WT) mice (n=10, 6 females) as control (Figure 1A). Animals were anesthetized by a mixture of air and O2 (1:1 ratio) and 0.9-1.2% isoflurane and prepared for femoral vein substrate infusion. During the whole experiment, the body temperature was kept at 37±0.5°C by a tubing with circulating warm water. The respiration rate and the body temperature were monitored by a small animal monitor (SA Instruments Inc.). All animal procedures were performed according to federal guidelines and were approved by the local ethics committee.
Dynamic 13C MRS protocol
[2-13C]acetate was chosen as labeling substrate to be more sensitive to astrocytic metabolism and glutamate/glutamine cycling3. [2-13C]acetate injection bolus dosage and infusion was calculated to quickly reach 70% fractional enrichment (FE) (Figure 1C)4. MRS experiments were performed on a 14.1T magnet with a 26cm horizontal bore (Agilent/Magnex) using a home-built 9-mm(13C)/15-mm(1H quad) surface coil as transceiver. B0 inhomogeneity was optimized using first- and second-order shimming with FAST(EST)MAP5, resulting in water linewidth of 25-30 Hz for a VOI of 68µL (3×5×4.5 mm3) in the frontal region of the brain (Figure 1D). To characterize the 13C-acetate fractional enrichment (FE) input function and optimize the early detection of glutamate (Glu) and glutamine (Gln) C4 labeling, BISEP-SPECIAL (6 and references therein) was used for the first 17min (13C-edited and non-edited spectra were acquired in 14 blocks of 8-scans in an interleaved mode (TE/TR=2.8/4000ms)). At later time points where the 13C enrichment in those metabolites gets higher and to measure Glu and Gln C4 and C3 with better spectral separation, it was then interleaved with 13C MRS measured with a semi-adiabatic DEPT polarization transfer sequence (blocks of 128 scans, TR=2.5s, interpulse delay 3.8ms (JCH=130Hz), 45° for last 1H pulse to simultaneously measure signals from CH, CH2, CH3 groups)7. The interleaved scheme is given in Figure 1B. The last BISEP FE measurement for GluC4 was used to scale the DEPT 13C spectra. BISEP-SPECIAL was also used to measure the initial concentration and time course of the Glu and Gln pools, necessary for the metabolic modelling interpretation. All spectra were frequency corrected and quantified with LCModel8.
Metabolic Modelling
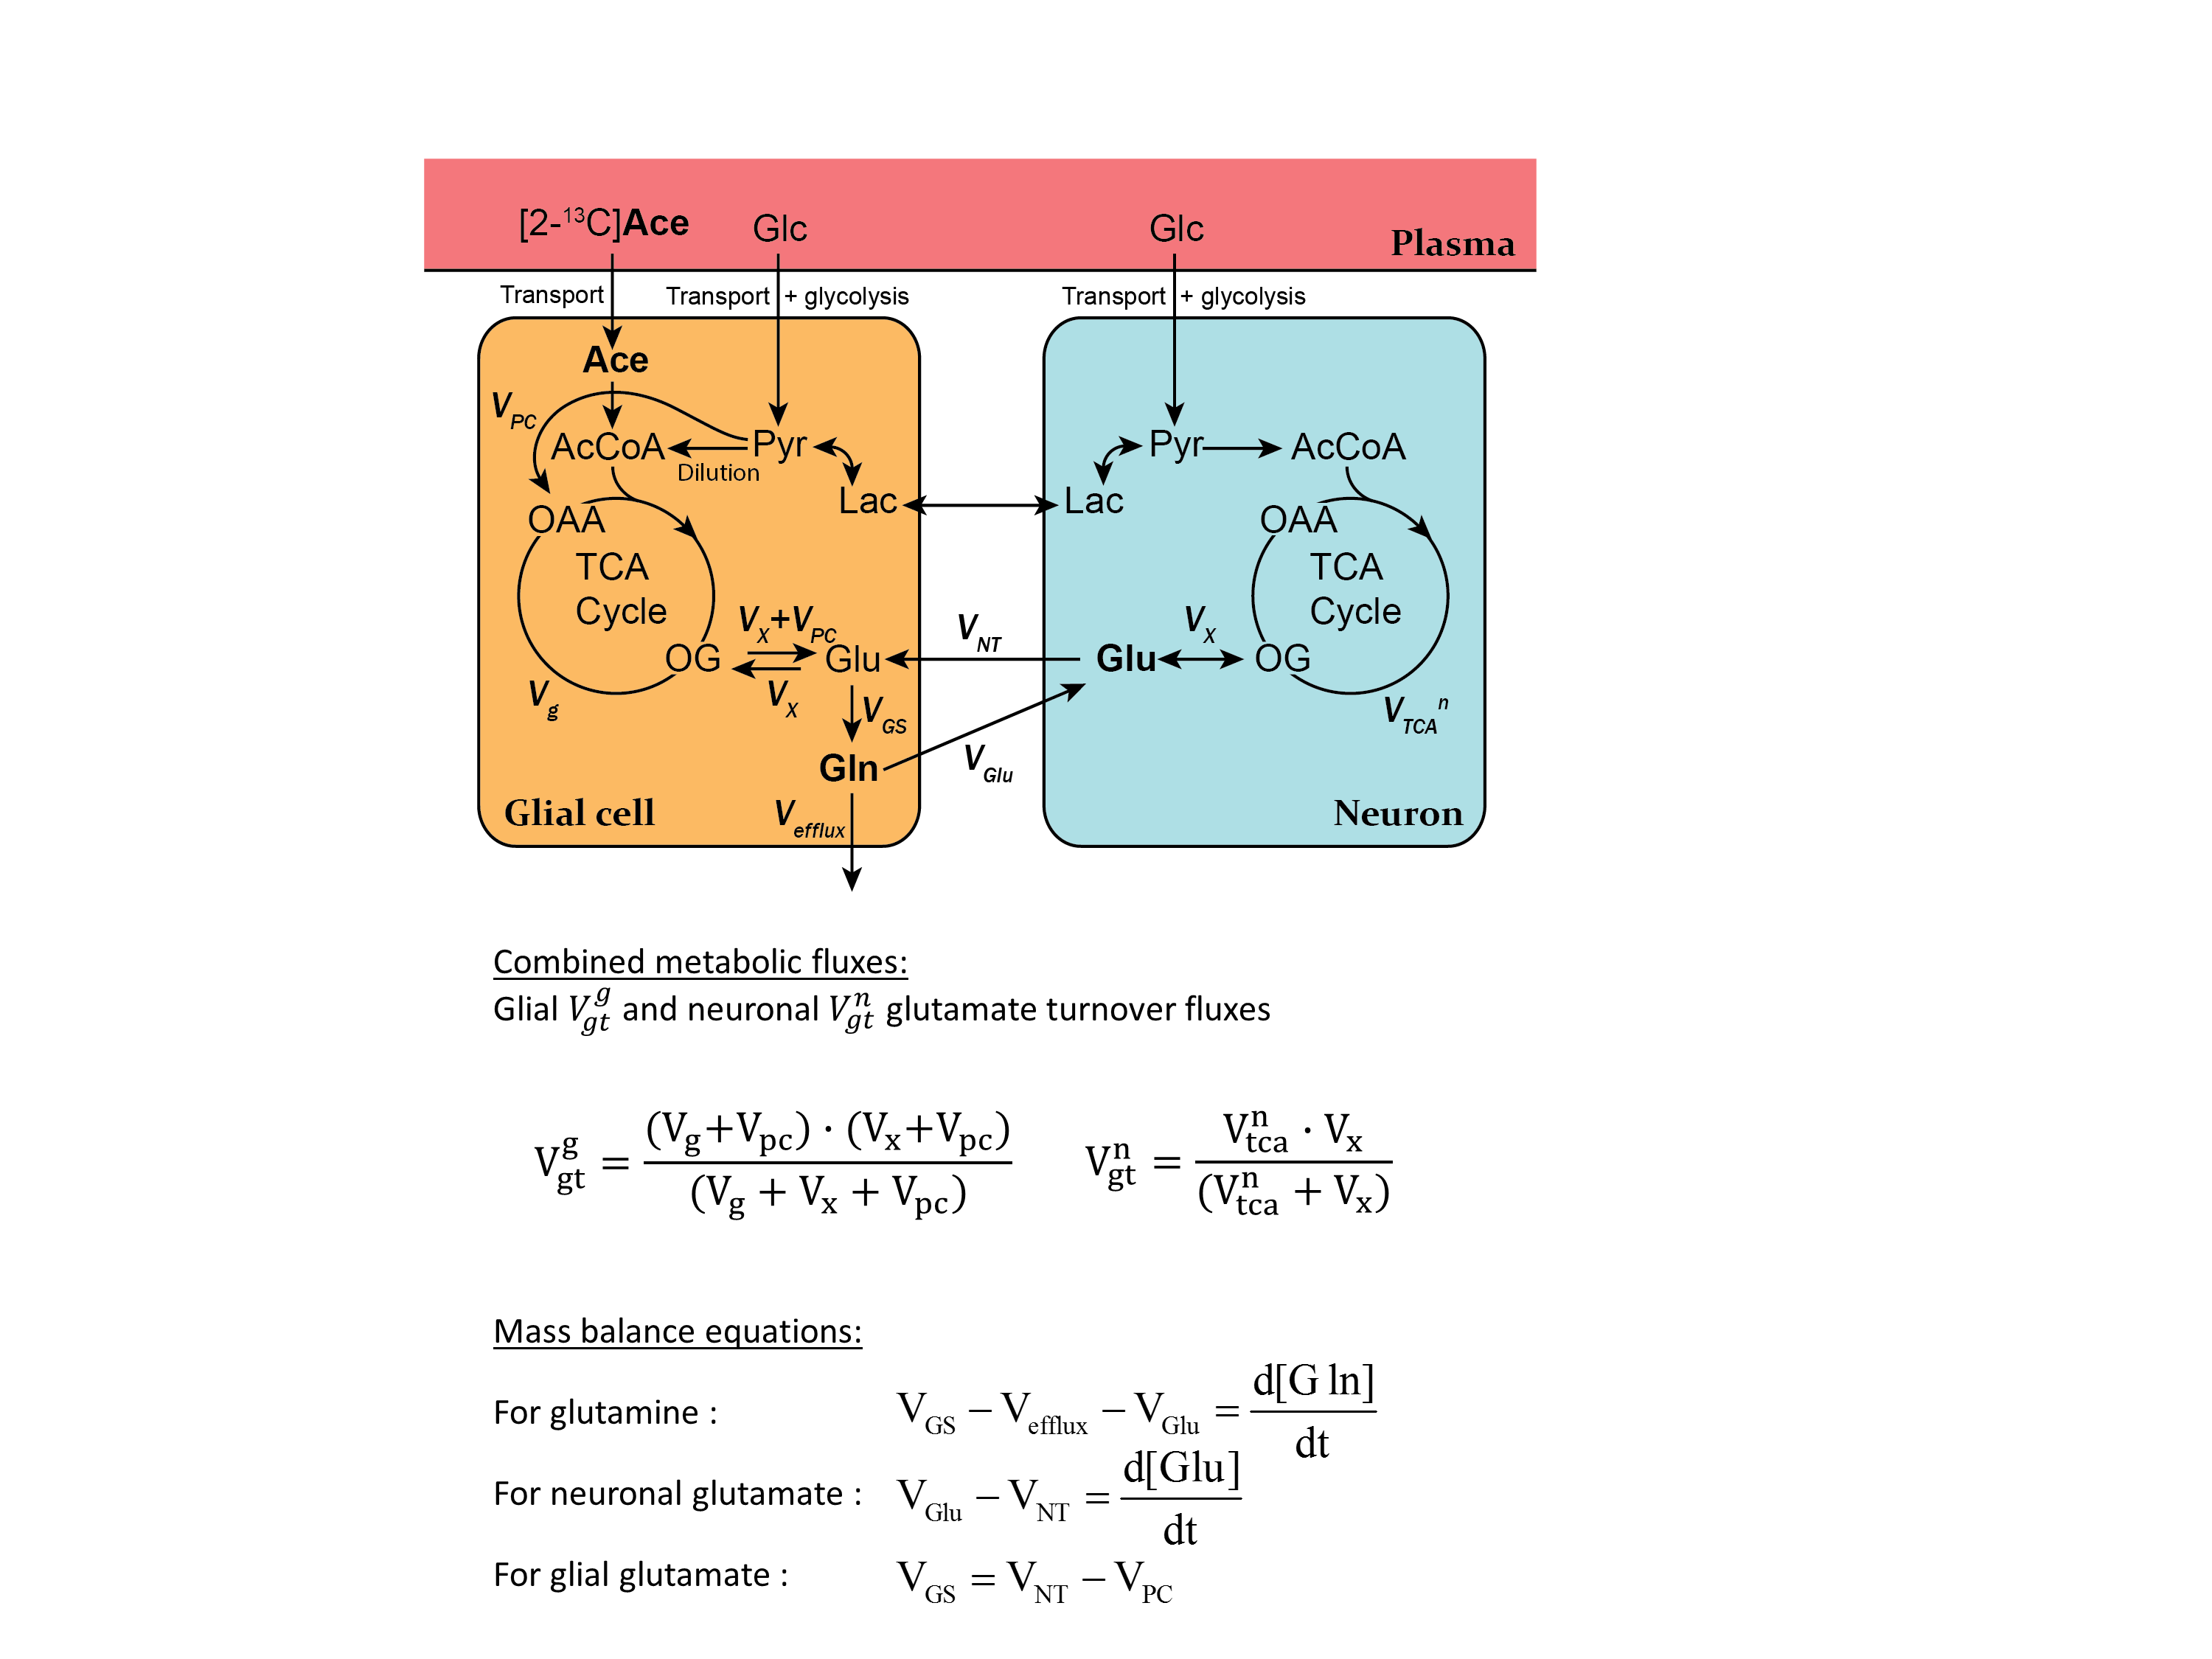
Two-compartment modeling of [2-13C]acetate (Ace) metabolism was applied to extract metabolic fluxes from the dynamic 13C enrichment curves GluC4, GluC3, GlnC4 and GlnC3, using the measured AceC2 as input function (Figure 2)3. Four independent metabolic fluxes were adjusted in this process: the glial tricarboxylic acid (TCA) cycle flux Vg, the transmitochondrial transport Vx, the glutamate-glutamine cycle Vnt and neuronal TCA cycle Vtcan. The variance of the obtained metabolic rates was estimated by Monte-Carlo simulations (500 iterations).
Results and Discussion
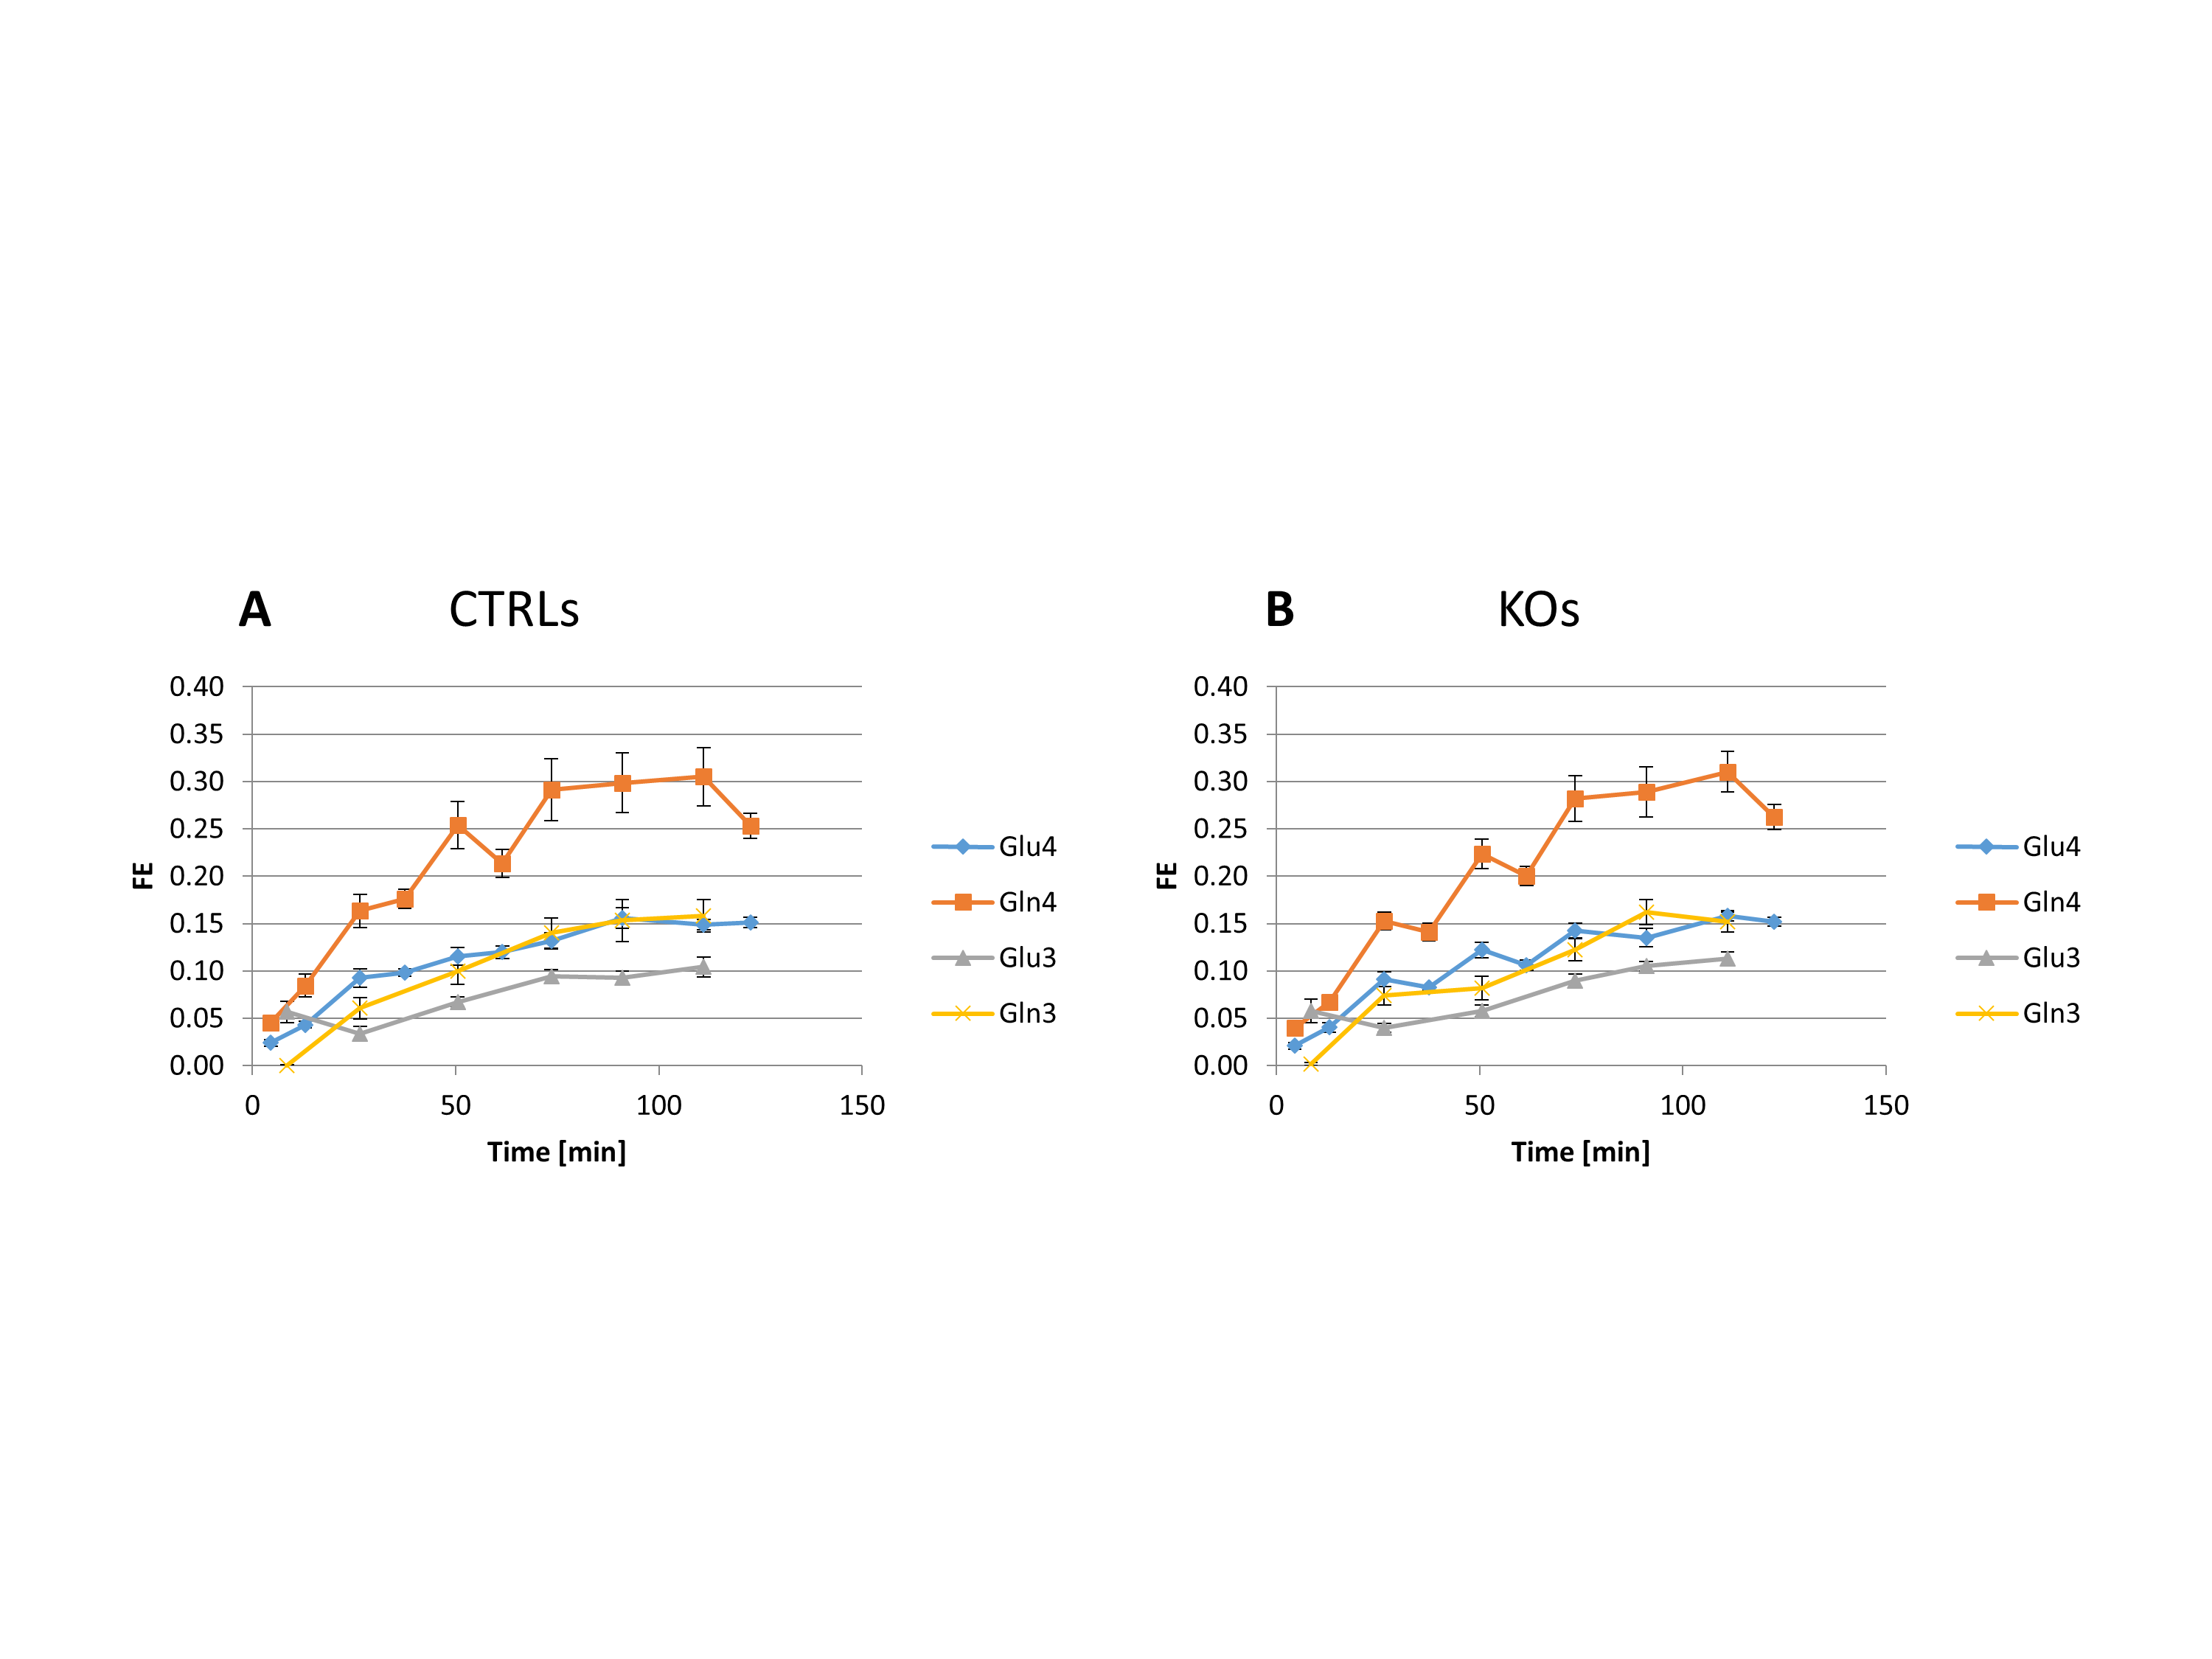
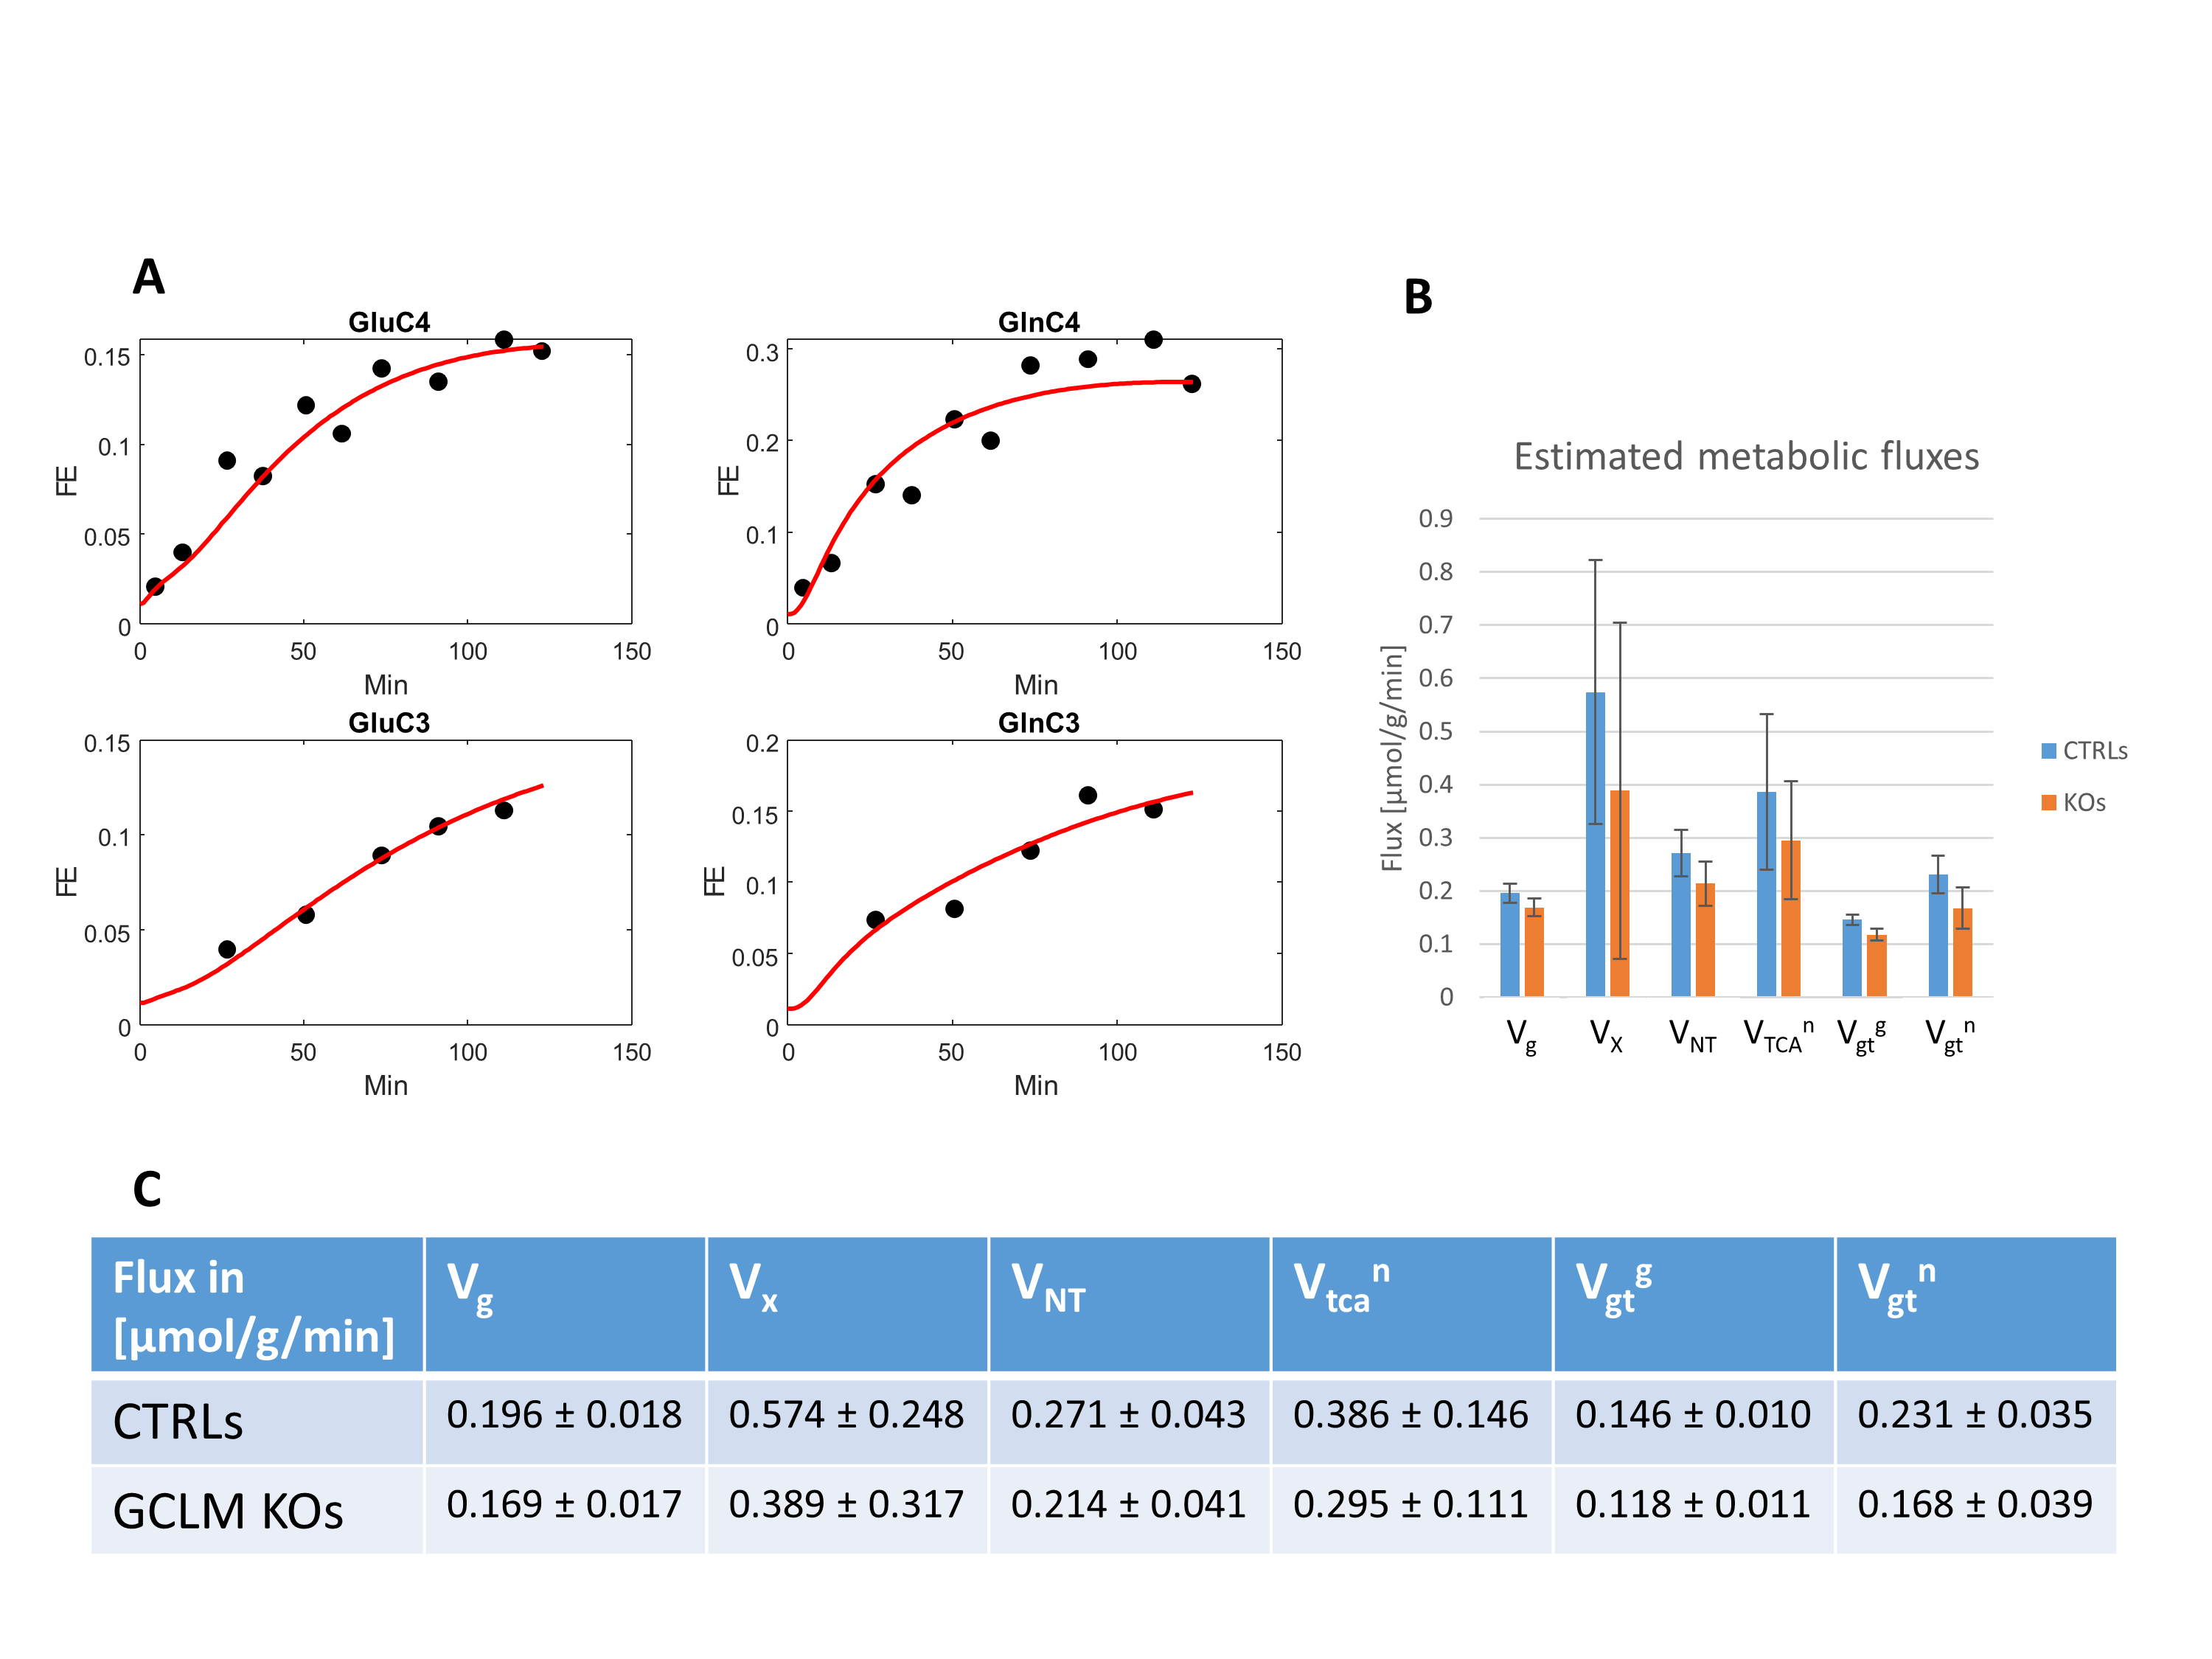
Despite the low steady-state fractional enrichment achieved when infusing [2-13C]acetate as compared to 13C-glucose and the small acquisition volume achievable in a P30 mouse brain, the quality of the obtained spectra (Figure 1D) enabled both the measurement of MRS-derived metabolic input function (Figure 1C) and 13C time courses for Glu and Gln C4 and C3, both for the control group and GCLM-KO group (Figure 3). Using the proposed two-compartment metabolic model, these four group-averaged labeling curves were successfully described (Figure 4A) and enabled the determination of characteristic oxidative metabolism and glutamate/glutamine cycling rates (i.e. Vg, Vx, Vnt, Vtcan, Vgtg and Vgtn) for the control and GCLM-KO groups (Figure 4B and 4C). GCLM-KO mice presented a trend towards lower Vgtg, Vgtn, and Vnt, however without reaching statistical significance (two-samples t-test).We conclude that despite the challenge represented by the low isotopic enrichment resulting from cerebral [2-13C] acetate metabolism and by applying localized dynamic 13C MRS to brains of mice pups, we successfully demonstrated for the first time the measurement of acetate input function and dynamic Glu and Gln labeling, enabling metabolic modelling interpretation in GCLM-KO mice with early postnatal oxidative challenge. This study provides perspectives for studying cerebral metabolism during brain development. Furthermore, GCLM-KO mice presented a trend towards slower oxidative metabolism and glutamate-glutamine exchange, however without reaching statistical significance, which motivates further investigations in a larger sample size.
Acknowledgements
The work was supported by the Center of Biomedical Imaging (CIBM) of the École Polytechnique Fédérale de Lausanne (EPFL), the Université de Lausanne (UNIL), Université de Genève (UNIGE), the Hôpitaux Universitaires de Genève (HUG) and the Centre Hospitalier Universitaire Vaudois (CHUV), the Leenaards, Jeantet Foundations and Biaggi foundation.References
1. Duarte, JMN et al., Magnetic Resonance Spectroscopy in Schizophrenia: Evidence for Glutamatergic Dysfunction and Impaired Energy Metabolism, Neurochem Res (2019) 44: 102
2. Duarte, JMN et al., N-Acetylcysteine Normalizes Neurochemical Changes in the Glutathione-Deficient Schizophrenia Mouse Model During Development, Biol Psychiatry. 2012 Jun 1;71(11):1006-14
3. Lanz, B et al., In vivo quantification of neuro-glial metabolism and glial glutamate concentration using 1H-[13C] MRS at 14.1T, J Neurochem. 2014 Jan;128(1):125-39
4. Patel, AB et al., The contribution of GABA to glutamate/glutamine cycling and energy metabolism in the ratcortex in vivo, PNAS April 12, 2005 102 (15) 5588-5593
5. Gruetter R, Tkac I. Field mapping without reference scan using asymmetric echo-planar techniques. Magn Reson Med 2000; 43(2): 319-23.
6. Xin, L et al. Assessment of metabolic fluxes in the mouse brain in vivo using 1H-[13C] NMR spectroscopy at 14.1 Tesla. Journal of cerebral blood flow and metabolism: 35, 759-765, doi:10.1038/jcbfm.2014.251 (2015)
7. Henry, PG et al., 1H-localized broadband 13C NMR spectroscopy of the rat brain in vivo at 9.4 T, Magn Reson Med. 2003 Oct;50(4):684-92
8. Provencher SW. Estimation of metabolite concentrations from localized in vivo proton NMR spectra. Magn Reson Med 1993; 30(6): 672-9.
Figures