0492
Simultaneous Acquisition of Spin-density-weighted and SNR-enhanced Fluid-attenuated 23Na MRI Images (SELA)1Biomedical Engineering, The University of Melbourne, Parkville, Australia
Synopsis
This work presents SELA, a 23Na MRI sequence that can simultaneously acquire spin-density-weighted (SDW) and SNR-enhanced fluid-attenuated (FLAIR) images in one scan. The sequence was examined by numerical simulation and phantom experiment in a 7T preclinical scanner. Preliminary results support the design purpose to improve 23Na MRI efficiency and 23Na-FLAIR image quality.
INTRODUCTION
Spin-density-weighted (SDW) and fluid-attenuated (FLAIR) 23Na MRI provide information on total sodium concentration and potential insight into intracellular sodium distribution, respectively1. However, low SNR and SAR limitations in 23Na MRI necessitate long acquisition times, making the sequential acquisition of these two forms of image contrast very time-consuming. To address this issue, SELA is proposed for the simultaneous acquisition of Spin-density-weighted and SNR-Enhance fLuid-attenuated 23NA images, providing more information in one scan under SAR values equivalent to a conventional hard-pulse inversion recovery (HIR) acquisition. In addition to the efficiency advantage, SELA also produces stronger signal in the FLAIR image, indicating its potential of improving intracellular 23Na imaging which is generally hampered by poor SNR.METHODS
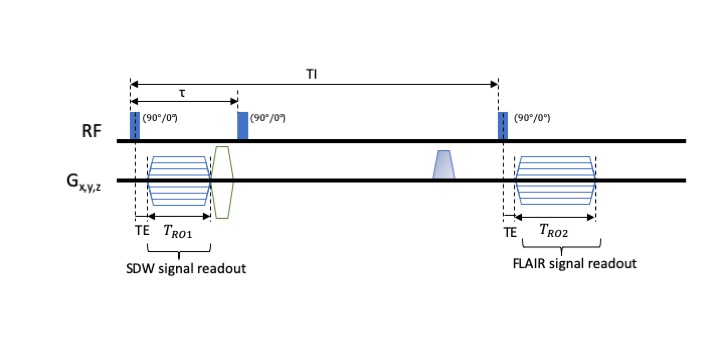
The SELA sequence (block diagram is shown in Figure 1) consists of three $$$90^\circ$$$ hard pulses along the same axis and two UTE readouts. The first pulse tips the magnetisation into the transverse plane, followed by a UTE readout acquiring SWD data and a subsequent rewinder gradient. During the delay time $$$\tau$$$ between the first two pulses, the magnetisations in different types of environment are differentiated by $$$T^*_2$$$ relaxation. The second pulse completes the inversion. Subsequently, the third pulse is applied at the inversion time that selectively nullifies the fluid signal, producing FLAIR signals from non-nulled environments. Both SDW and FLAIR acquisitions are based on 3D radial UTE readouts.Simulations
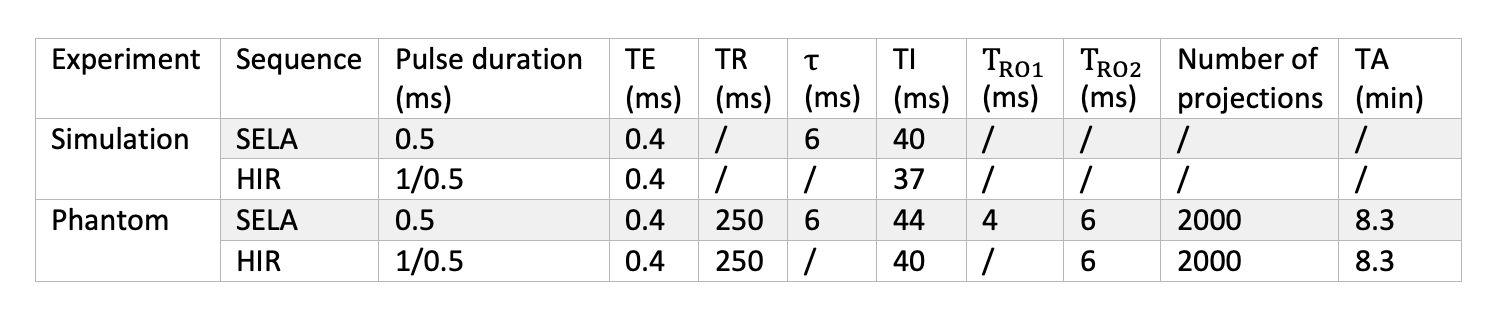
23Na spin dynamical simulation was done in MATLAB based on the tensor operator formalism2. Three sets of parameters were obtained from the literature3: i) spectral density $$$J_0/J_1/J_2 = 190/21/14\,$$$Hz, residual quadrupolar interaction frequency $$$\omega_0 = 0\,$$$Hz for simulation of 50 mM 23Na in 3% agar; ii) $$$J_0/J_1/J_2 = 300/31/18\,$$$Hz, $$$\omega_0 = 0\,$$$Hz for 50 mM 23Na in 6% agar; iii) $$$J_0/J_1/J_2 = 9.4/9.4/9.4\,$$$Hz, $$$\omega_0 = 0\,$$$Hz for 50 mM 23Na in saline. SELA and HIR were simulated with sequence parameters listed in Table 1. The inversion pulse duration and the excitation pulse duration for HIR were respectively chosen to be 1 ms and 500 µs, resulting in SAR equivalent to SELA which consists of three 500-µs pulses. The delay time $$$\tau$$$ was optimised for 23Na in 6% agar through simulation.
7T Experimental Acquisition
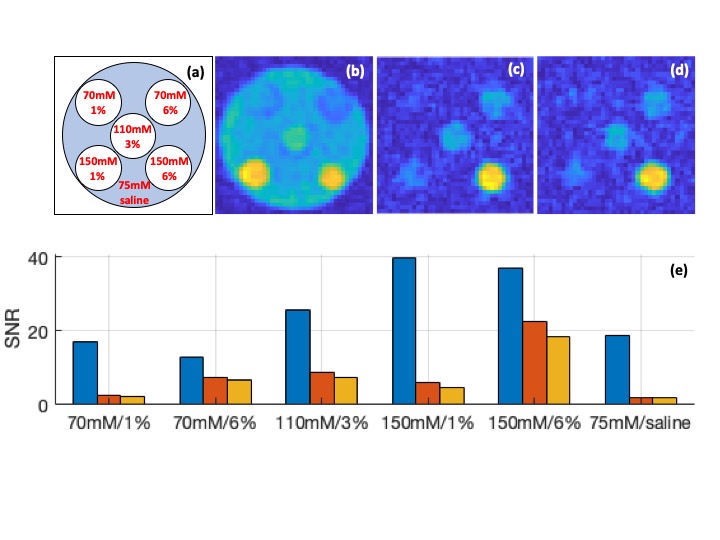
Phantom experiment was performed on a research 7T MRI scanner (Siemens Healthineers, Erlangen,Germany) with a dual-tuned 1H-23Na transmit/receive head coil (QED, USA). The phantom consisted of 5 vials with varying concentrations of sodium and agar submerged in a cylindrical container with saline (Figure 3a). All images were reconstructed offline via re-gridding in MATLAB onto an isotropic 3.1 mm resolution grid. Prior to image acquisition, shimming was performed using a vendor-provided 1H-based shimming procedure. Images were corrected for Rician noise and analysed for SNR4.
RESULTS
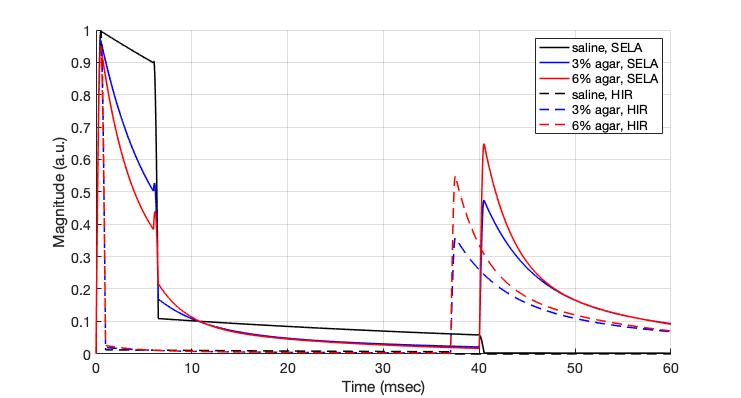
The simulated 23Na transverse magnetisations are plotted in Figure 2. Peaks occurring around 40 ms represent FLAIR signals. In 3% agar environment, the peak signal produced by SELA is 31% higher than the one by HIR. In 6% agar, the peak produced by SELA is 18% higher.Phantom schematic, the SDW image and the FLAIR images acquired by SELA and HIR are presented in Figure 3a-d. SNR of the phantom images is shown in the bar graph in Figure 3e. SNR is at least 12 and as high as 40 in the SDW image. In terms of FLAIR images, significant signal attenuation is seen in saline and 1% agar while signals in 3% and 6% agar vials are mostly retained. SNR in FLAIR image is improved by 6 – 30% using SELA sequence. Both SELA and HIR take 8.3 minutes to acquire 2000 projections.
DISCUSSION
Although the delay time $$$\tau$$$, optimised in the simulation, limits the achievable readout duration for the SDW UTE readout, phantom image shows good contrast and SNR, demonstrating that the time window is sufficient for SWD readout. Analysing FLAIR image quality, both simulation and phantom experiment indicate that the signals from slow-motion environments are stronger using SELA sequence. This is the result of the $$$T^*_2$$$ relaxation during the delay $$$\tau$$$ which expands the difference between magnetisations in fast-motion and slow-motion environments. SELA improves SNR in FLAIR images, and further increase is expected by extending the readout duration (currently a short 6-ms readout duration was employed). Increasing the number of projections or averaging is another way to enhance SNR, however in the cost of increasing acquisition time. These aspects will be optimised in future phantom experiments and validated in in-vivo experiments.CONCLUSION
This work demonstrates that the proposed sequence SELA yields SDW and FLAIR images in one scan at no additional SAR expense. The sequence improves 23Na MRI scan efficiency and SNR, offering multiple markers of sodium content with potential clinical relevance for both diagnosis and treatment monitoring5.Acknowledgements
We acknowledge the facilities, and the scientific and technical assistance of the Australian National Imaging Facility, a National Collaborative Research Infrastructure Strategy (NCRIS) capability, at the Melbourne Brain Centre Imaging Unit of the University of Melbourne. The work was also supported by a research collaboration agreement with Siemens Healthcare Australia.References
[1] Madelin G, Regatte RR. Biomedical applications of sodium MRI in vivo. Journal of Magnetic Resonance Imaging. 2013 Sep;38(3):511-29.
[2] Van der Maarel JR. Thermal relaxation and coherence dynamics of spin 3/2. I. Static and fluctuating quadrupolar interactions in the multipole basis. Concepts in Magnetic Resonance Part A: An Educational Journal. 2003;19(2):97-116.
[3] Stobbe RW, Beaulieu C. Exploring and enhancing relaxation-based sodium MRI contrast. Magnetic Resonance Materials in Physics, Biology and Medicine. 2014 Feb 1;27(1):21-33.
[4] Gudbjartsson H, Patz S. The Rician distribution of noisy MRI data. Magnetic resonance in medicine. 1995 Dec;34(6):910-4.
[5] Thulborn KR. Quantitative sodium MR imaging: a review of its evolving role in medicine. Neuroimage. 2018 Mar 1;168:250-68.
Figures