0490
Combining CEST and 1H MR Spectroscopy for simultaneous determination of metabolite concentrations and effects of magnetization exchange1Departments of Radiology and Biomedical Research, University of Bern, Bern, Switzerland
Synopsis
A new sequence design was used to combine the CEST saturation method with traditional MRS. Using non-water suppressed metabolite-cycled spectroscopy offers the time-saving simultaneous recording of the traditional CEST z-spectrum and the metabolite spectrum under frequency selective saturation and allows the detection of exchange and magnetization transfer effects on metabolites and macromolecules. This technique might offer additional possibilities for quantifying the metabolite and macromolecular content or give further insight into the composition of the traditional CEST z-spectrum and is also relevant for judging the influence of water-suppression on absolute metabolite signals.
Introduction
CEST MRI is by now an established method to investigate metabolites that show magnetization exchange with water, thus complementing traditional spectroscopy for a specific range of metabolites with the benefit of drastically improved sensitivity, but also with the challenge of limited specificity (spectral overlap, other effects on exchange rates) and applicability. Aspects of sequence design and quantification of the components of the z-spectrum have recently been reviewed in detail1–4. Spectroscopy has been combined with CEST previously to correct the z-spectrum for fat signals in extracranial human applications5 and in rat brain6. Specific magnetization transfer (MT) effects from water to metabolites have also been studied in human and animal brain and muscle7–10. However, the acquisition of the complete metabolite spectrum in combination with CEST saturation over the whole spectral range has not been reported for human studies previously, and furthermore the currently proposed method allows for acquisition of MRS and CEST water data in simultaneous fashion.Methods
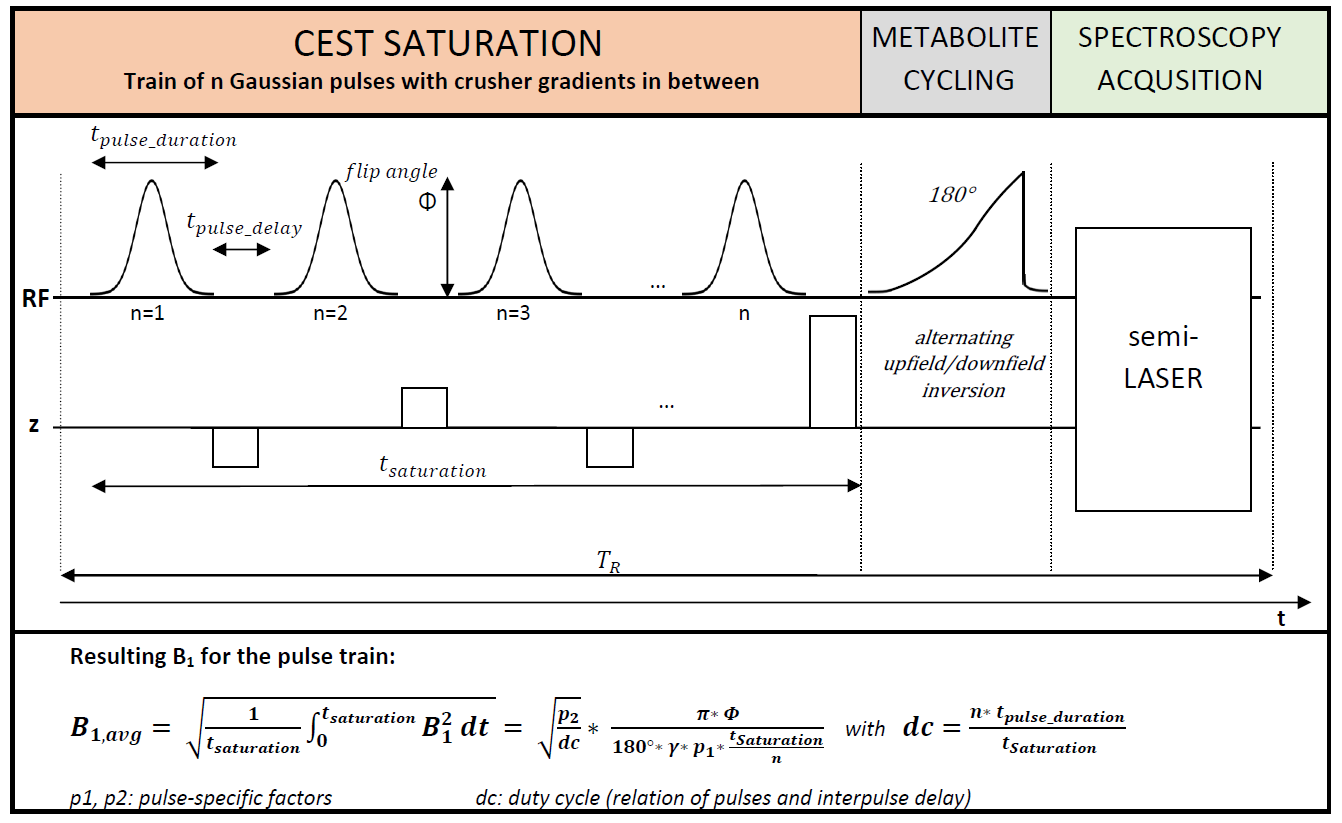
Sequence Design:The basic design of the sequence is shown in Figure 1. A CEST saturation block consisting of a train of Gaussian RF pulses and spoiler gradients is placed before a metabolite-cycled semiLASER spectroscopy localization sequence. The saturation parameters (number of pulses, duty cycle, flip angle, saturation duration) are adjustable to allow optimization of the saturation for a specific target.
Data acquisition:
Data was acquired on 10 healthy volunteers (aged 37±16 years) with the following conditions: 3T MR scanner (Prisma, Siemens, Germany), 64-channel headcoil; supraventricular voxel (45x70x20 mm3); second-order shim (option “brain”); TR 3300 ms; TE 45 ms; 41 measurements with saturation from -6 to 6 ppm (0.3 ppm spacing; one scan at -100 ppm), 24 averages each (60 min acquisition); 2000 ms saturation, duty cycle 80% (see Figure 1), 50 pulses (32 ms each), flip angle 180° (B1 =0.36 µT); additional reference scan without CEST train with 64 averages.
Data evaluation:
Metabolite-cycled data was aligned and eddy-current-corrected in MATLAB and residual water removed using HLSVD. Z-spectra were calculated from the water intensity of each measurement (second point in time domain) and fitted using a 8-pool Lorentzian model, including direct saturation, MT effect, exchange effects from amines, amides, guanidines, hydroxyls, plus two NOE pools (at -1.6 and -3.5 ppm). MT effect was approximated as Lorentzian given the small ppm range investigated. Metabolite spectra fitted in FitAID11 using a model consisting of 18 metabolites and a macromolecular background (MMBG) represented by 64 equally spaced Voigt lines (∆=0.05 ppm, 0.7-4.1 ppm, 5 Hz Gaussian, 9 Hz Lorentzian broadening). Offset, phase, Lorentzian/Gaussian broadening fitted simultaneously for the whole dataset, areas of metabolites and macromolecules (MM) allowed to adapt for each measurement independently in a subsequent step.
Results and Discussion
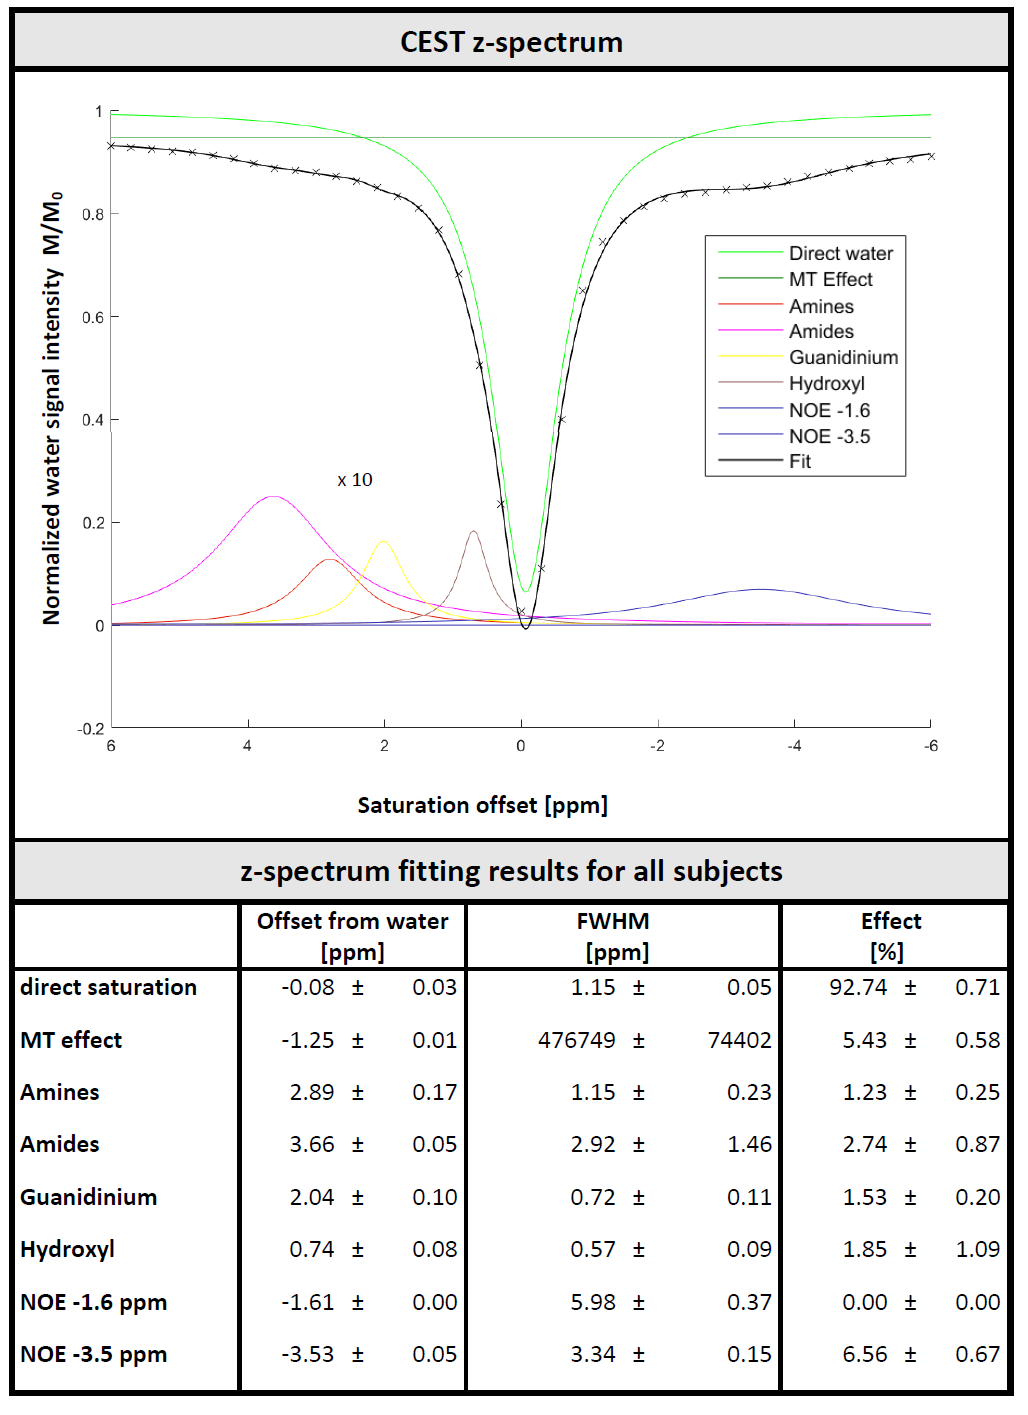
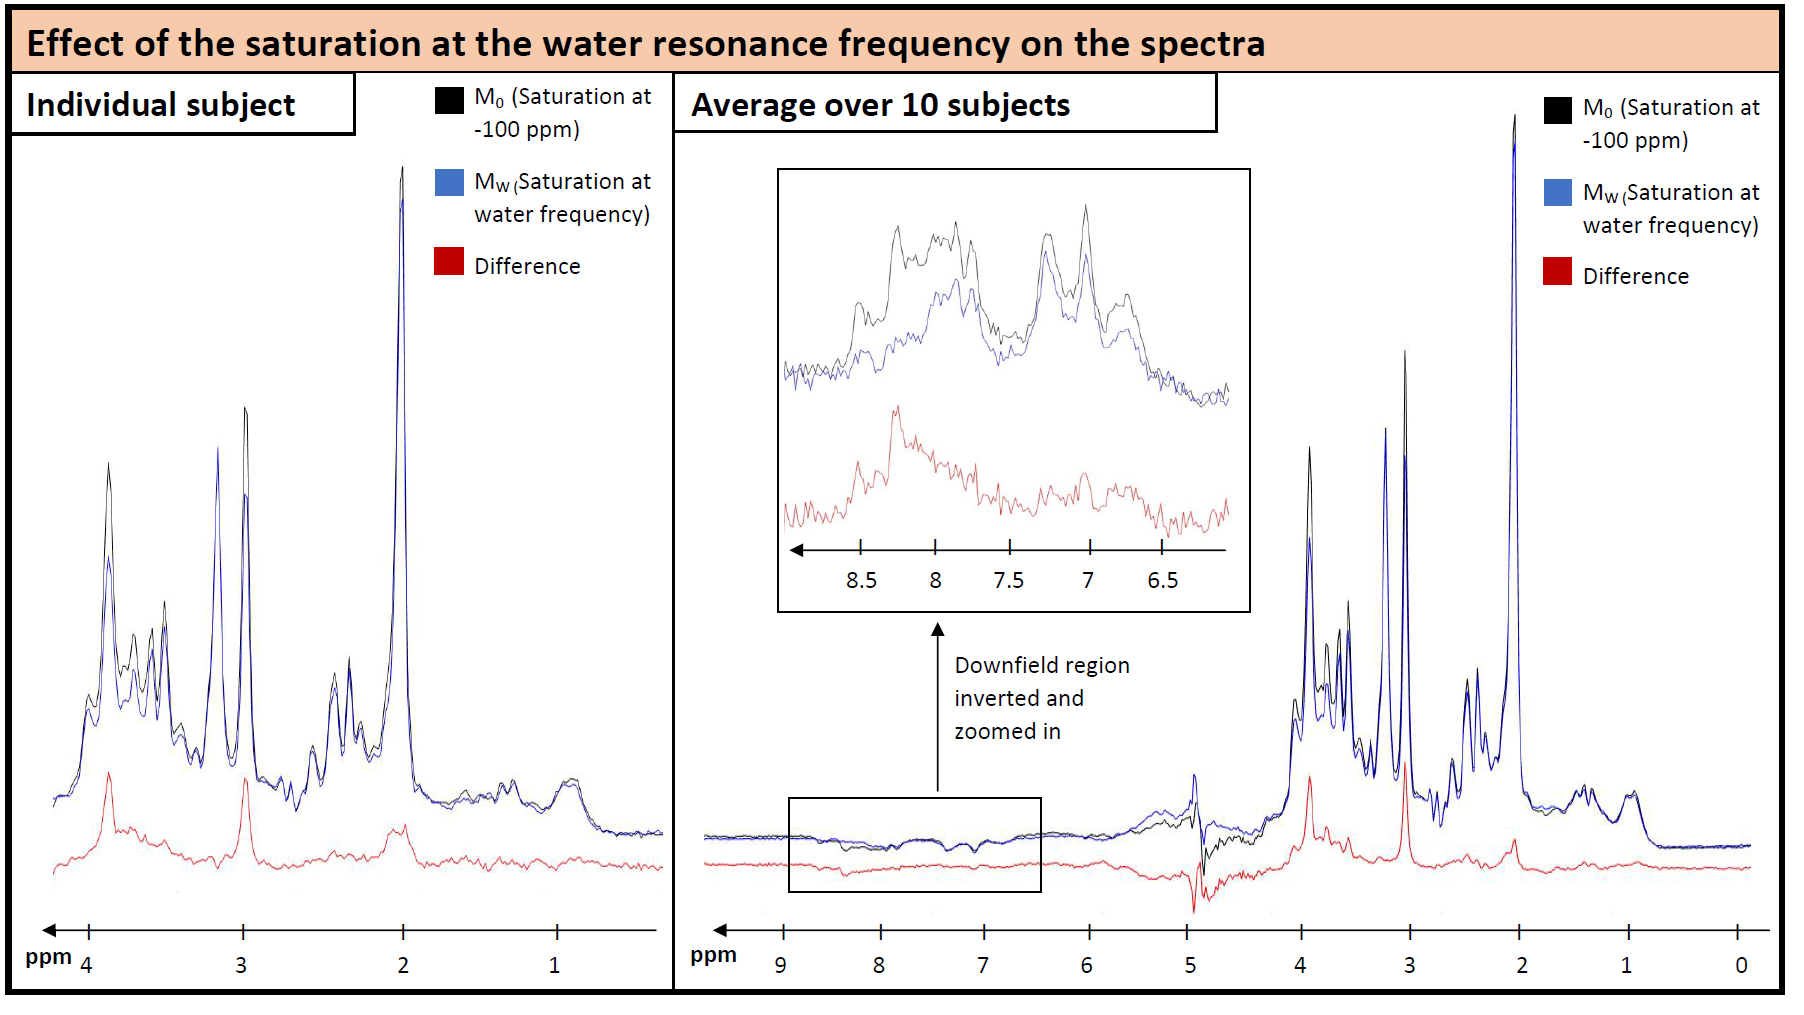
The effect of the saturation on water and metabolite signals is illustrated in Figure 2. Figure 3 illustrates the water signal intensity used to evaluate the traditional CEST z-spectrum for a representative subject. Fitting of the z-spectrum showed the expected exchange and NOE effects. The MT effect is small‑as expected for a low B1 value. The standard deviations of the fitting results for the cohort reflect good agreement between subjects. No NOE effect at -1.6 ppm (reported for rat brain12) was found in this study.The magnetization transfer effect from water to metabolites is visualized in Figure 4 for a single subject and the cohort average. The average spectrum also reflects effects on certain parts of the MMBG, especially between 2.0 - 2.8 ppm and 3.4 - 4.1 ppm. Parts of the signal drop might be caused by interfering influence of direct saturation effects close to the water resonance. Furthermore, irradiation at -100 ppm did not have any effect on main metabolites compared to the non-saturated reference scan.
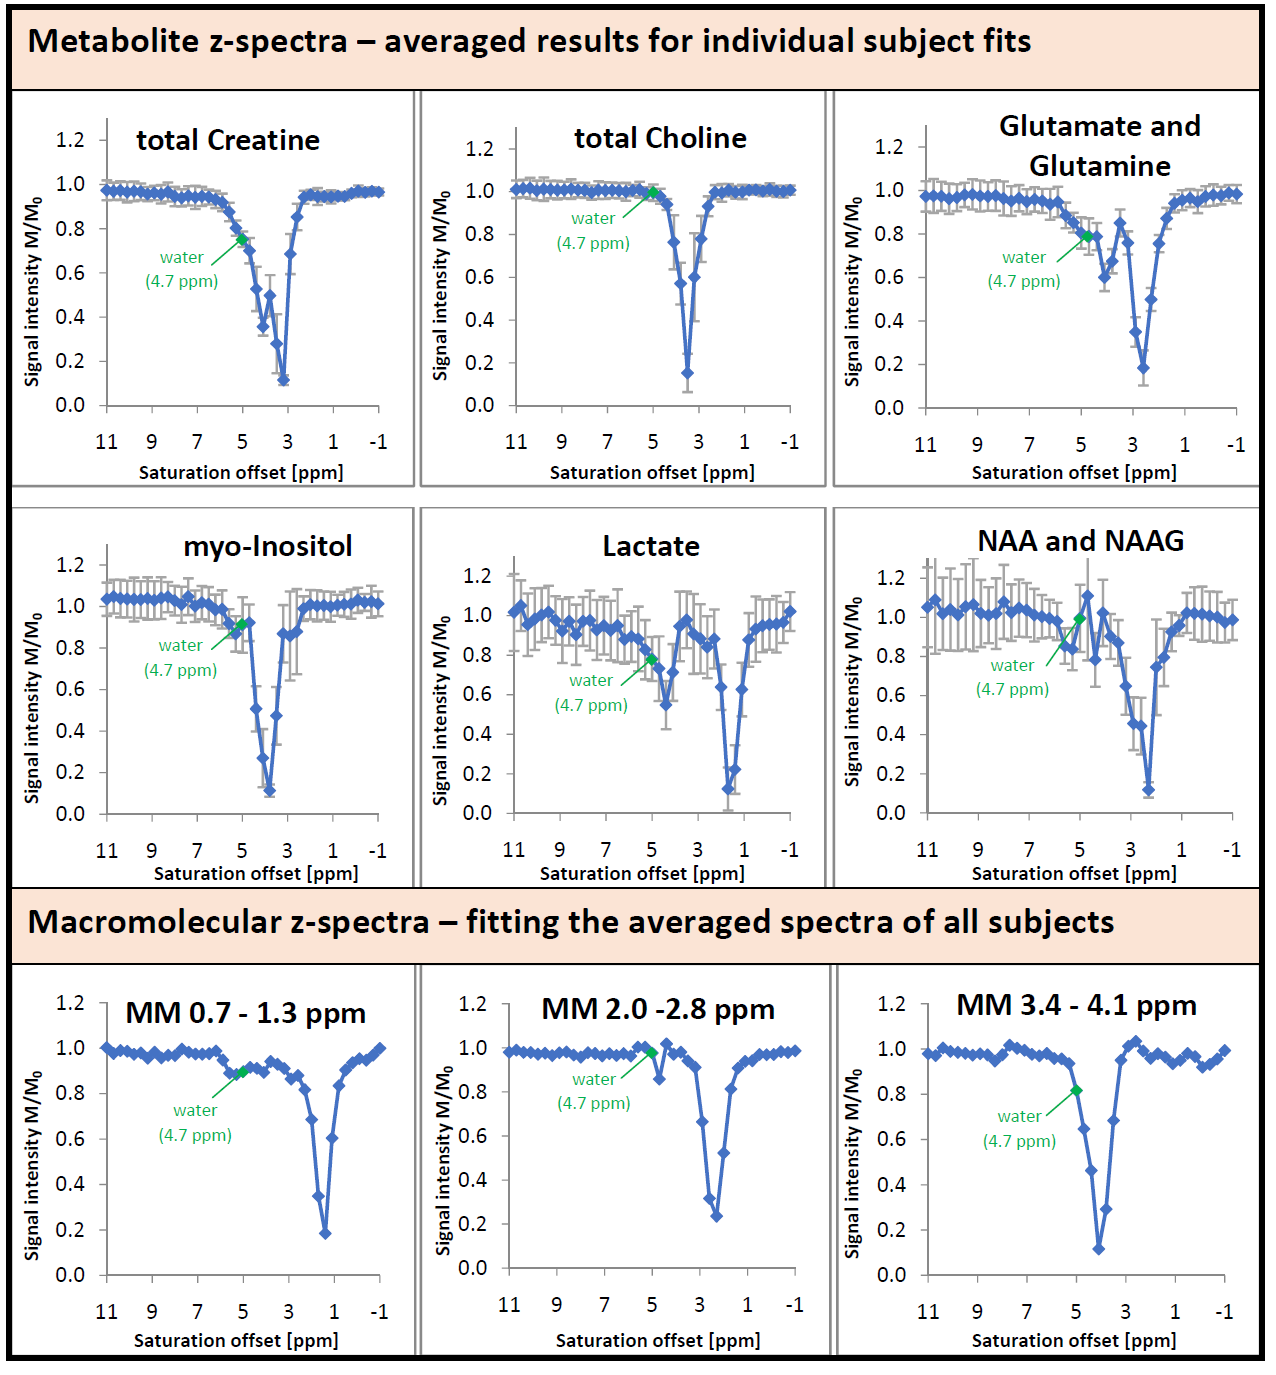
Figure 5 shows the fitted signal intensity of selected metabolites and selected MM regions vs. saturation frequency. Besides the signal drop due to direct saturation, an additional effect is apparent for some metabolites and the MMBG around the water frequency, visualizing the MT effect for single metabolites. For the cholines and largely also for N-acetylaspartate (NAA) this effect is strikingly missing. The simultaneous recording of the water signal and the metabolite spectrum under frequency-selective saturation provides the results from two time-consuming methods at the same time. Using an optimized voxel size13 yields high quality spectra regarding signal-to-noise-ratio even for a few acquisitions only. Recording of spectra under saturation promises further information on exchange factors and MT effects for metabolites and also MM.
Conclusions
Using non-water suppressed spectroscopy offers the time-saving simultaneous recording of the traditional CEST z-spectrum and the metabolite spectrum under frequency-selective saturation. In addition, exchange and MT effects on metabolites and MM can be detected, which might offer additional possibilities for quantifying the metabolite and MM content or give further insight into the composition of the traditional CEST z-spectrum. Effects on MMBG have been found which have previously not been reported. Future research will be directed at investigation of the effect of varying the B1 saturation amplitude. Detailed knowledge of MT effects is also relevant to judge the influence of water-suppression sequences on absolute metabolite signals.Acknowledgements
This work is supported by the Swiss National Science Foundation (SNSF #320030‐175984).References
1. van Zijl PCM, Sehgal A. Proton chemical exchange saturation transfer (CEST) MRS and MRI. 2016;eMagRes(5):1–26.
2. van Zijl PCM, Lam WW, Xu J, Knutsson L, Staniszc GJ. Magnetization transfer contrast and chemical exchange saturation transfer MRI. Features and analysis of the field- dependent saturation spectrum. Neuroimage. 2018;168:222–241.
3. Zaiss M, Bachert P. Chemical exchange saturation transfer (CEST) and MR z-spectroscopy in vivo: A review of theoretical approaches and methods. Phys Med Biol. 2013;58:221–269.
4. Kogan F, Hariharan H, Reddy R. Chemical exchange saturation transfer (CEST) imaging: Description of technique and potential clinical applications. Curr Radiol Rep. 2013;1:102–114.
5. Walker-Samuel S, Johnson SP, Pedley B, Lythgoe MF, Golay X. Extracranial measurements of amide proton transfer using exchange-modulated point-resolved spectroscopy (EXPRESS). NMR Biomed. 2012;25:829–834.
6. de Graaf RA, van Kranenburg A, Nicolay K. Off-resonance metabolite magnetization transfer measurements on rat brain in situ. Magn Res Med. 1999;41: 1136–1144.
7. Dreher W, Norris DG, Leibfritz D. Magnetization transfer affects the proton creatine/phosphocreatine signal intensity: In vivo demonstration in the rat brain. Magn Res Med.1994;31: 81-84.
8. McLean MA, Simister RJ, Barker GJ, Duncan JS. Magnetization transfer effect on human brain metabolites and macromolecules. Magn Res Med. 2005;54:1281–1285.
9. Kruiskamp MJ, de Graaf RA, van der Grond J, Lamerichs R, Nicolay K. Magnetic coupling between water and creatine protons in human brain and skeletal muscle, as measured using inversion transfer 1H-MRS. NMR Biomed. 2001;14:1-4.
10. Renema WKJ, Kan HE, Wieringa B, Heerschap A. In vivo magnetic resonance spectroscopy of transgenic mouse models with altered high-energy phosphoryl transfer metabolism. NMR Biomed. 2007;20:448–467.
11. Chong DGQ, Kreis R, Bolliger CS, Boesch C, Slotboom J. Two-dimensional linear-combination model fitting of magnetic resonance spectra to define the macromolecule baseline using FiTAID, a Fitting Tool for Arrays of Interrelated Datasets. MAGMA. 2011;24:147–164.
12. Zhang X. et al. A new NOE-mediated MT signal at around −1.6 ppm for detecting ischemic stroke in rat brain. Magn Reson Imaging. 2016;34:1100–1106.
13. Hoefemann M, Adalid V, Kreis R. Optimizing acquisition and fitting conditions for 1H MR spectroscopy investigations in global brain pathology. NMR Biomed. 2019;e4161:1–11.
Figures