0489
A 7T interleaved fMRS and fMRI study on visual contrast dependency in the human brain.1Department of Radiology and Nuclear Medicine, Amsterdam University Medical Center, University of Amsterdam, Amsterdam, Netherlands, 2C.J. Gorter Center for High Field MRI, Department of Radiology, Leiden University Medical Center, Leiden, Netherlands, 3Danish Research Centre for Magnetic Resonance, Centre for Functional and Diagnostic Imaging and Research, Copenhagen University Hospital Hvidovre, Hvidovre, Denmark, 4Spinoza Centre for Neuroimaging, Royal Netherlands Academy of Arts and Sciences, Amsterdam, Netherlands, 5Center for Magnetic Resonance Research, Department of Radiology, University of Minnesota, Minneapolis, MN, United States
Synopsis
Functional magnetic resonance spectroscopy can non-invasively measure changes in local concentrations of neurometabolites and has been used to demonstrate changes in lactate and glutamate levels in response to visual stimulation. However, whether the neurometabolite response scales with the level of neuronal stimulation like the BOLD response, has not been extensively investigated. We here show that lactate, but not glutamate levels, change dependent on visual contrast levels (baseline, 10%, 100% contrast). Although we also demonstrate a significant contrast dependence in the BOLD response, we do not find a significant association between the lactate response and the BOLD response.
Introduction
Functional magnetic resonance spectroscopy (fMRS) is a method for non-invasively measuring the local concentration of metabolites in the human brain during functional paradigms. For example, neuronal lactate and glutamate levels in human cortex have been shown to increase in response to visual stimulation1,2,3. However, whether the neurometabolite response scales with the intensity of visual stimulation and how this relates to the hemodynamic response has not been extensively investigated4. To better understand this relationship, we measured the metabolite response to different contrast levels of a visual checkerboard stimulus during an interleaved fMRS and fMRI acquisition. We hypothesized a dependence of lactate and glutamate levels on the visual contrast for both the fMRS and functional magnetic resonance imaging (fMRI) data.Methods
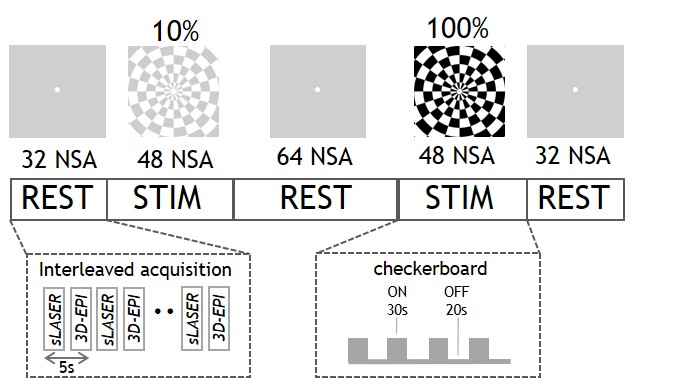
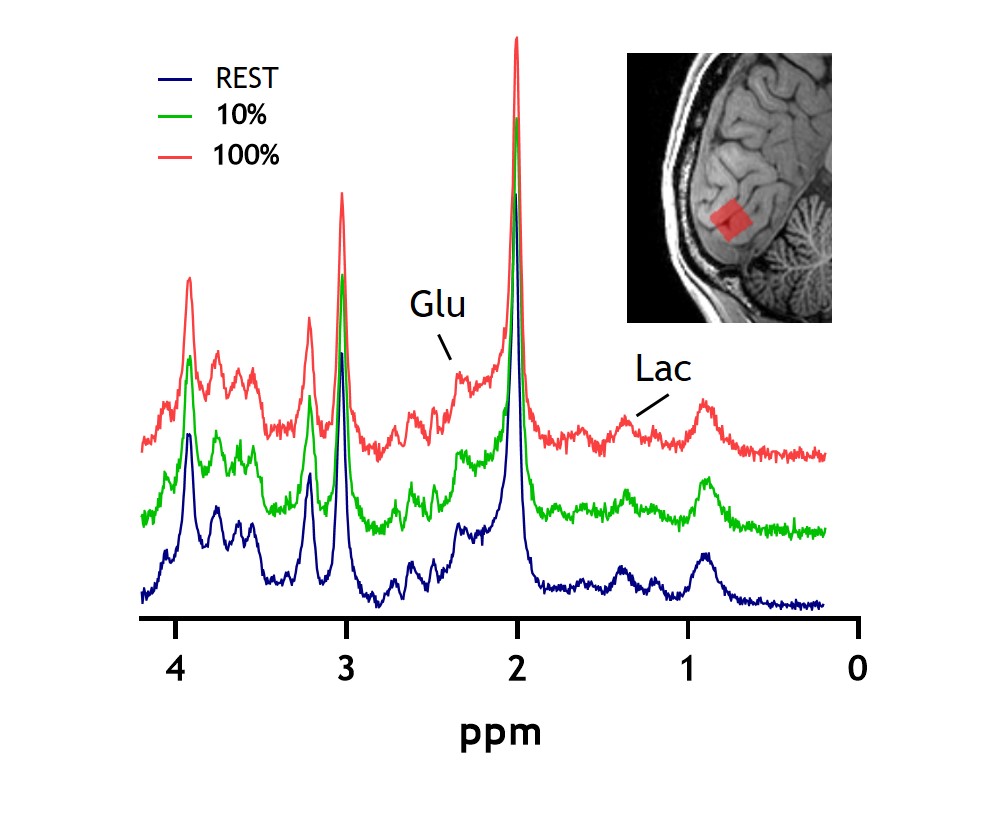
Eight healthy subjects were scanned on a 7T MR system (Achieva, Philips, Best, the Netherlands) with a dual-channel transmit coil and a 32-channel receive coil (Nova Medical, Wilmington, USA). Data were collected in accordance with the guidelines of the local ethics review board. Figure 1 shows the stimulation paradigm. The stimulus consisted of a full-field radial checkerboard flickering at 8Hz. The task consisted of two 4-minute stimulation blocks (STIM) at two different black/white contrasts: 10% and 100%. To prevent neural habituation in V1 to the prolonged stimulus, each STIM block was subdivided into five sub-blocks of 30s ON and a 20s OFF. During the REST and OFF period a grey screen was presented (with a central white fixation point). fMRS data were acquired using a semiLASER sequence with FOCI refocusing pulses5 and VAPOR water suppression (TR/TE=3600/36ms; bandwidth=3kHz; 1024 data points; voxel size=14x31x14mm). fMRI data were acquired using a 3D-EPI sequence (TR/TE/FA=1400/30ms/10˚; voxel size=1.875x1.875x1.875mm, matrix size=128x128x68). fMRS and fMRI were interleaved6 with a combined dynamic scan time of 5s with a total of 226 dynamics (for spectroscopy, 2 unsuppressed water spectra and 224 water-suppressed metabolite spectra). We used dynamically alternating linear shims and a shared set of static second order terms7. The voxel was placed in the primary visual cortex (V1), based on a short checkerboard localizer and identification of the calcarine sulcus on the T1-weighted image. The spectra were corrected for eddy currents as well as frequency and phase drifts. Subsequently, the second half of the STIM periods were summed and compared to second half of each REST period2. The summed spectra per condition were quantified with LCmodel8 utilizing a basis set of 19 simulated metabolites and a measured macromolecular baseline. The fMRI data were motion corrected, spatially smoothed (5mm kernel), high pass filtered (0.002Hz), registered to the anatomical MRI and fed into a first-level analysis using FSL Feat9. Time courses and %BOLD signal change were extracted from the MRS voxel location (transformed into MNI space) and a z-map of the 100%>10% contrast was calculated in a second-level analysis. One-way analysis of variance (ANOVA) was used to compare differences between REST, 10% and 100% stimulation, and Pearson’s correlations were used to compare the fMRS and fMRI responses.Results
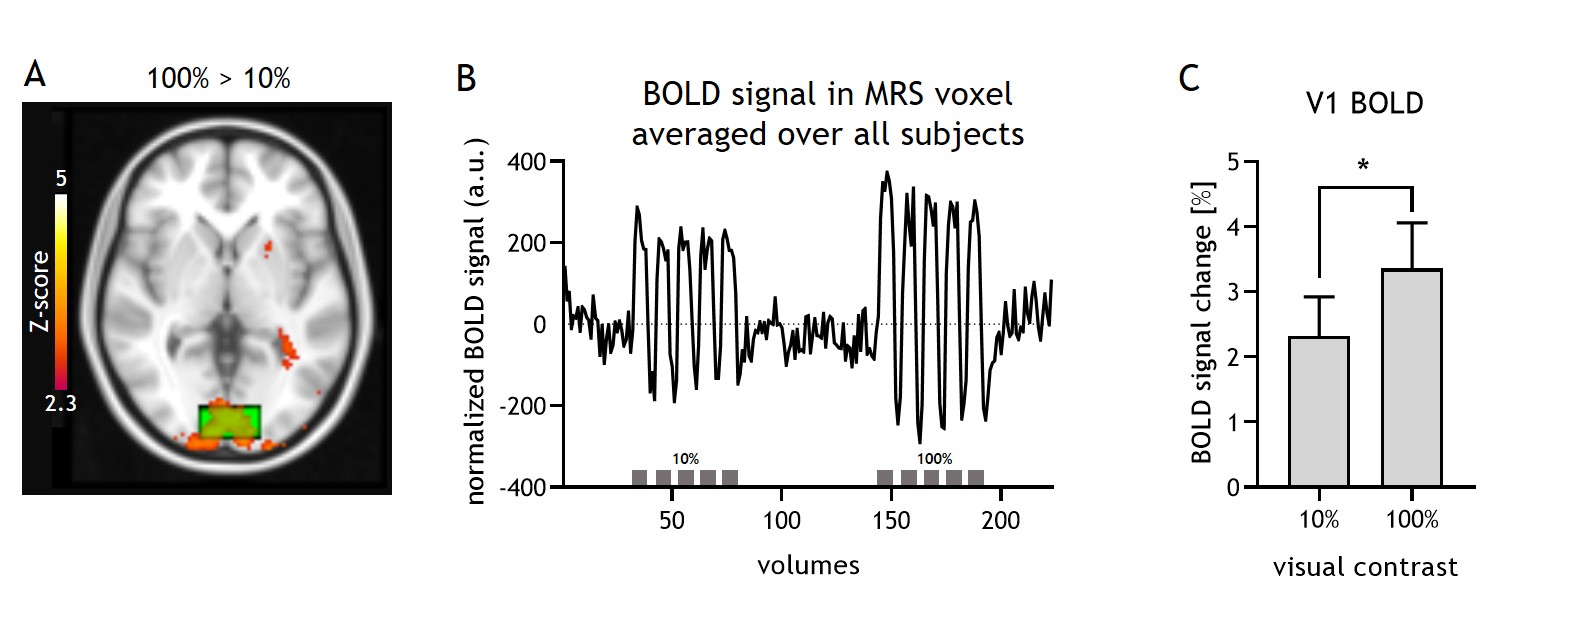
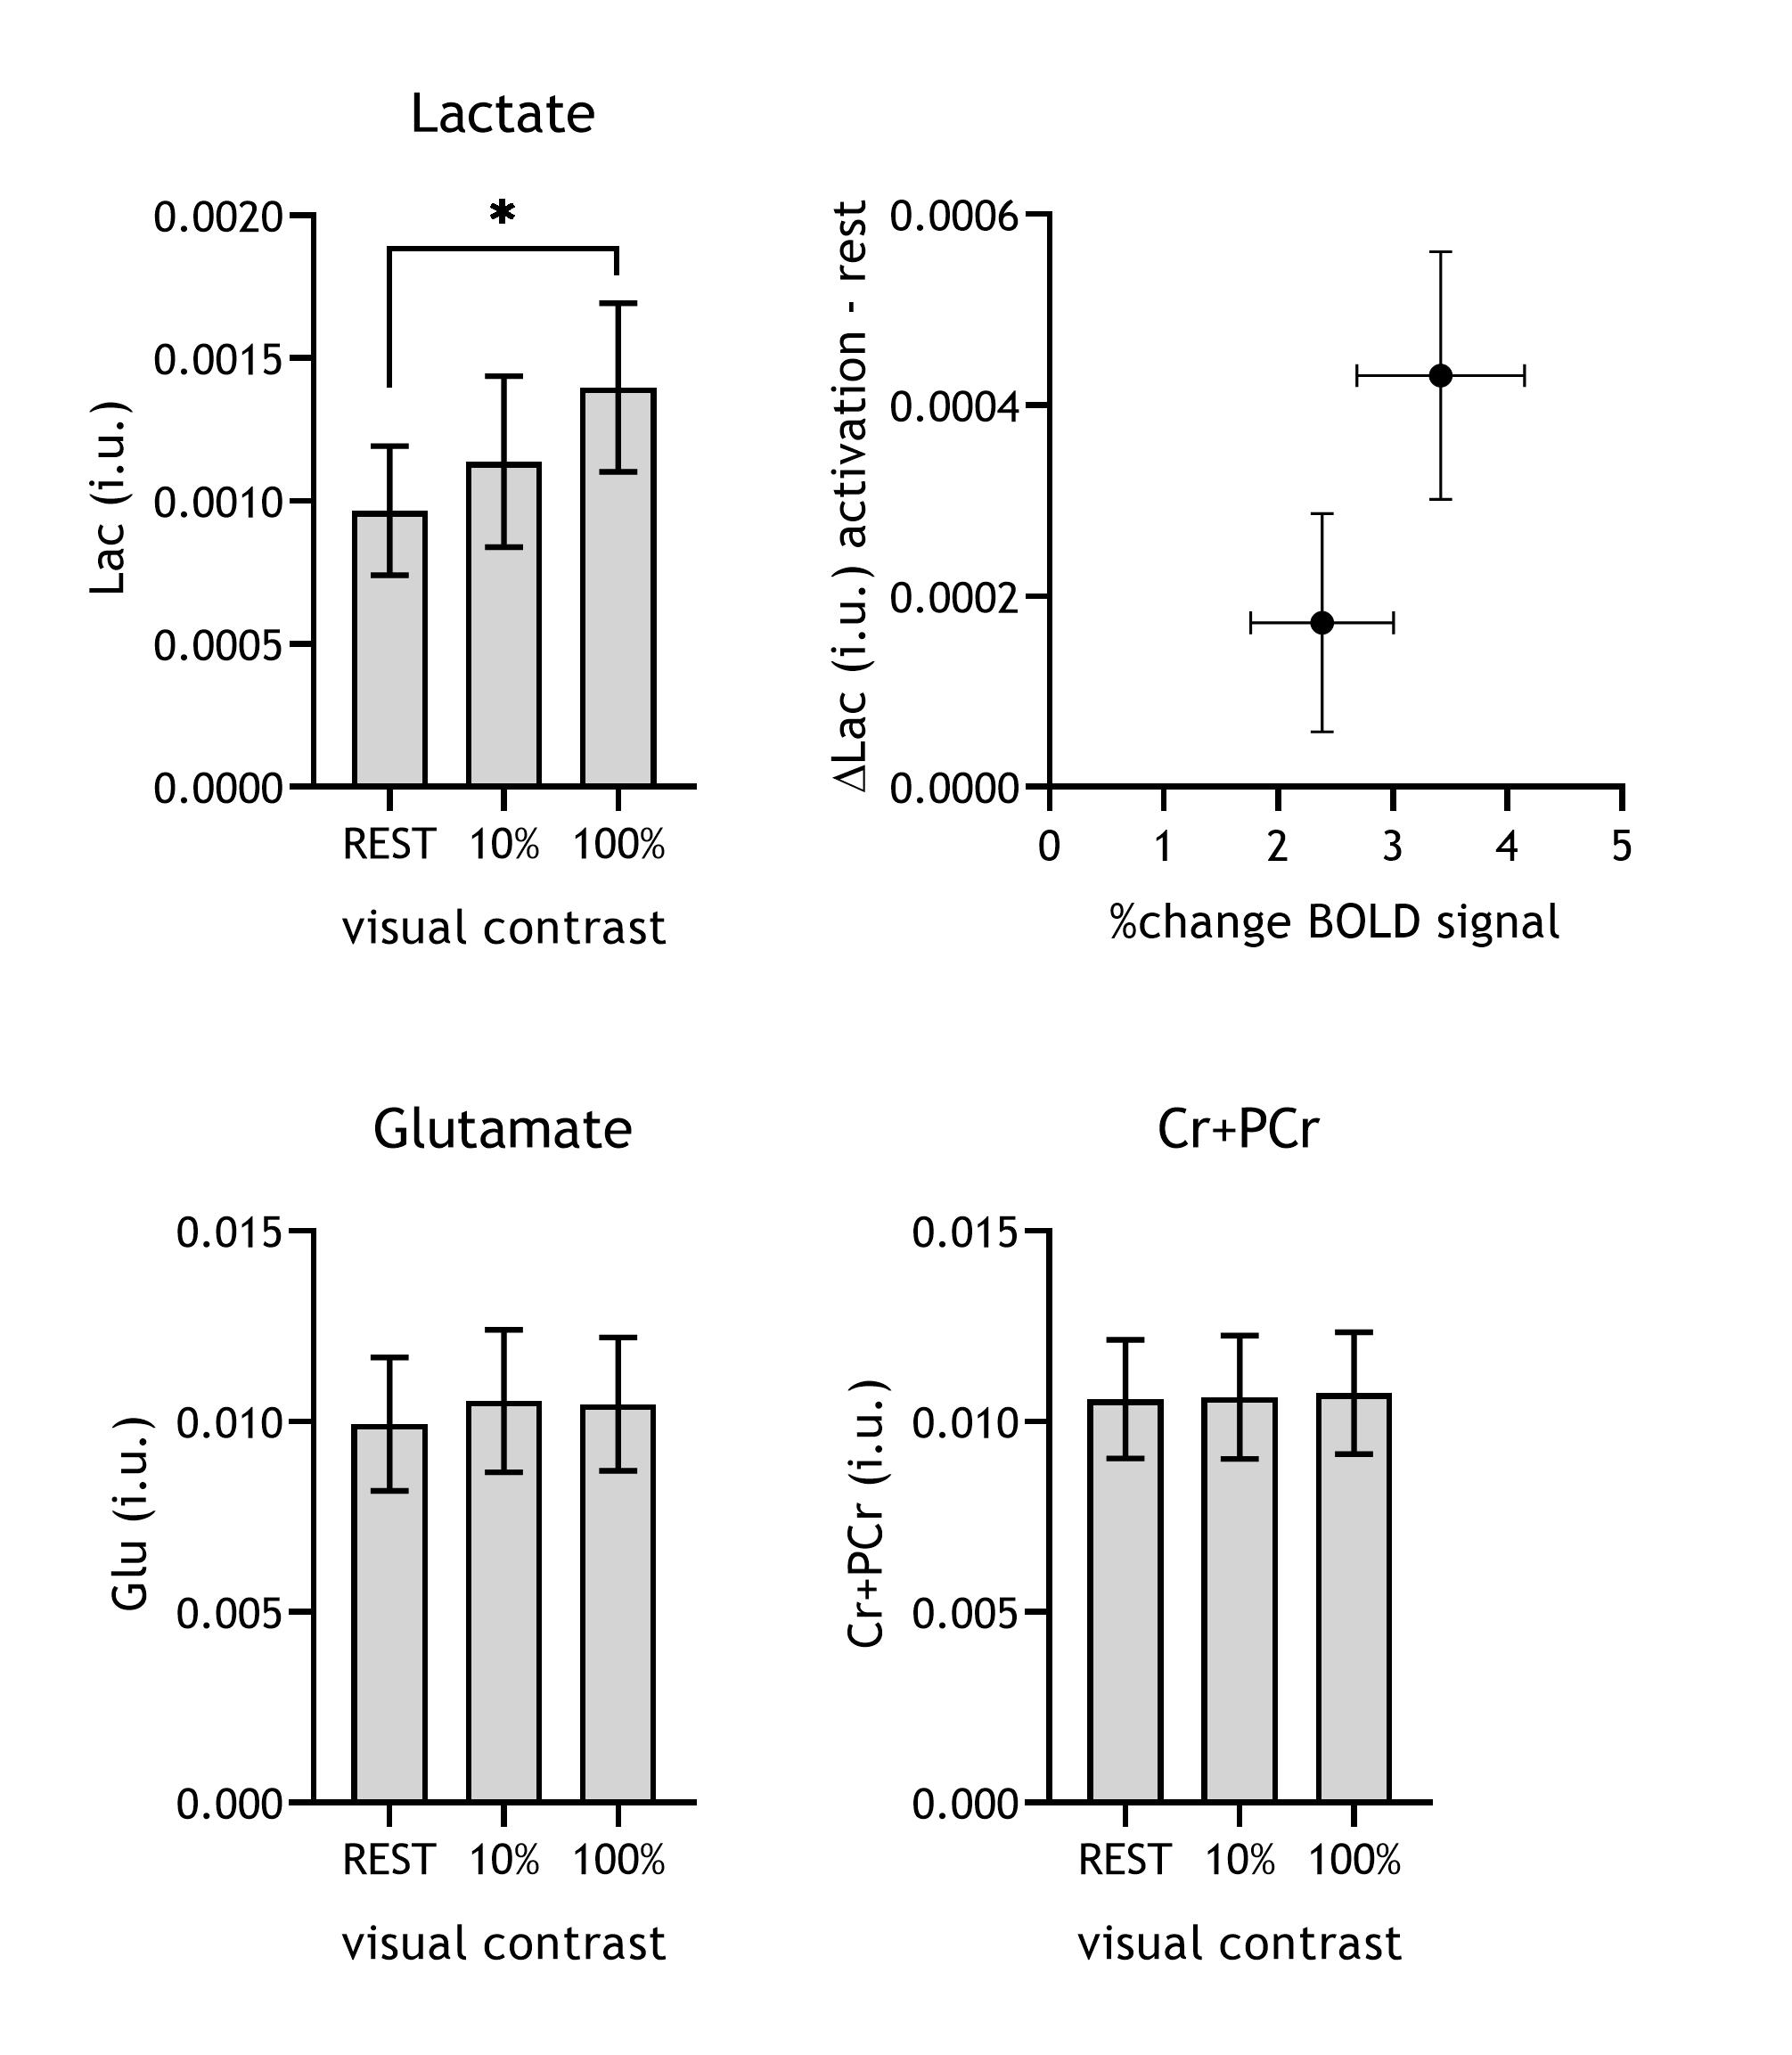
The 100% contrast checkerboard induced a significantly larger hemodynamic response than the 10% contrast (Figure A-C, p<0.001), with both contrast levels showing significant widespread activation in visual cortex compared to baseline. For the fMRS, one subject was removed from the analyses due to poor quality spectra. Lactate levels significantly differed between the REST, 10% and 100% contrast (F(2,6)=6.2, p=0.01; post-hoc tests: 100%-vs-REST p=0.01, 10%-vs-REST p=0.18, 100%-vs-10% p=0.08) and followed a linear trend (p=0.004). Glutamate levels did not significantly differ between the three conditions (F(2,6)=3.5, p=0.09). SNR was significantly different between the REST (NSA=64) and the STIM (NSA=24) blocks (p<0.01), but SNR was not associated with lactate or glutamate levels. Linewidth obtained for all conditions with linear predictive singular value decomposition (LPSVD) did not differ between the three conditions (p>0.05), therefore no line broadening was applied. No correlation between the change in BOLD and the change in lactate (r=0.17; p=0.56) or glutamate (r=0.06; p=0.82) were found.Discussion and Conclusion
We here demonstrate that, similarly to the BOLD response, changes in lactate are dependent on visual contrast level. Although one of the strengths of this study is the interleaved measurement of fMRS and fMRI, we did not find a significant correlation between them. This might be a consequence of the small sample size. Surprisingly, and opposed to a recent study investigating the effects of visual contrast on glutamate levels using MRS, we did not find evidence for a strong dependence of glutamate on contrast level4. We averaged our MRS data over longer acquisition blocks (4 min) compared to the stimulus blocks in the previous study (1 min). Therefore, our future analyses will examine at what timescale these neurometabolite changes take place and whether we find evidence for fluctuations in our sub-minute alternations in ON and OFF during the STIM blocks. This might also shed more light on the origin of lactate and glutamate fluctuations.Acknowledgements
No acknowledgement found.References
1. Schaller B, Xin L, O’Brien K, Magill AW, Gruetter R. Are glutamate and lactate increases ubiquitous to physiological activation? A 1H functional MR spectroscopy study during motor activation in human brain at 7Tesla. Neuroimage (2014) 93:138–145. doi:10.1016/j.neuroimage.2014.02.016
2. Bednařík P, Tkáč I, Giove F, DiNuzzo M, Deelchand DK, Emir UE, Eberly LE, Mangia S. Neurochemical and BOLD Responses during Neuronal Activation Measured in the Human Visual Cortex at 7 Tesla. J Cereb Blood Flow Metab (2015) 35:601–610. doi:10.1038/jcbfm.2014.233
3. Mangia S, Tkáč I, Gruetter R, Van de Moortele P-F, Maraviglia B, Uğurbil K. Sustained neuronal activation raises oxidative metabolism to a new steady-state level: evidence from 1H NMR spectroscopy in the human visual cortex. J Cereb Blood Flow Metab (2007) 27:1055–63. doi:10.1038/sj.jcbfm.9600401
4. Ip IB, Emir UE, Parker AJ, Campbell J, Bridge H. Comparison of Neurochemical and BOLD Signal Contrast Response Functions in the Human Visual Cortex. J Neurosci (2019) 39:7968–7975. doi:10.1523/jneurosci.3021-18.2019
5. Arteaga de Castro CS, Boer VO, Andreychenko A, Wijnen JP, van der Heide U, Luijten PR, Klomp DWJ. Improved efficiency on editing MRS of lactate and γ-aminobutyric acid by inclusion of frequency offset corrected inversion pulses at high fields. NMR Biomed (2013) 26:1213–9. doi:10.1002/nbm.2937
6. Henningsson M, Mens G, Koken P, Smink J, Botnar RM. A new framework for interleaved scanning in cardiovascular MR: Application to image-based respiratory motion correction in coronary MR angiography. Magn Reson Med (2015) 73:692–6. doi:10.1002/mrm.25149
7. Andersen M, Marsman A, Lind A, Petersen E, Boer VO. Prospective motion correction in single voxel spectroscopy at 7T using fat navigators and higher order shimming. in Proc. Intl. Soc. Mag. Reson. Med. (2019)
8. Provencher SW. Automatic quantitation of localized in vivo 1H spectra with LCModel. NMR Biomed (2001) 14:260–264. doi:10.1002/nbm.698
9. Woolrich MW, Ripley BD, Brady M, Smith SM. Temporal autocorrelation in univariate linear modeling of FMRI data. Neuroimage (2001) 14:1370–86. doi:10.1006/nimg.2001.0931
Figures