0485
Multi-nuclear MRI identifies elevated skin sodium in adults with salt-sensitive blood pressure1Radiology, Vanderbilt University Medical Center, Nashville, TN, United States, 2Cardiology, Vanderbilt University Medical Center, Nashville, TN, United States, 3Neurology, Vanderbilt University Medical Center, Nashville, TN, United States, 4Psychiatry, Vanderbilt University Medical Center, Nashville, TN, United States
Synopsis
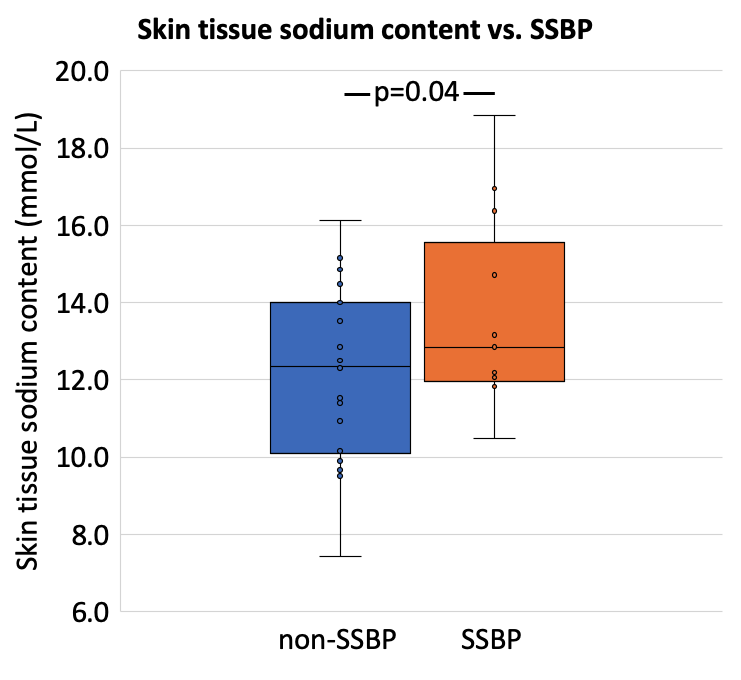
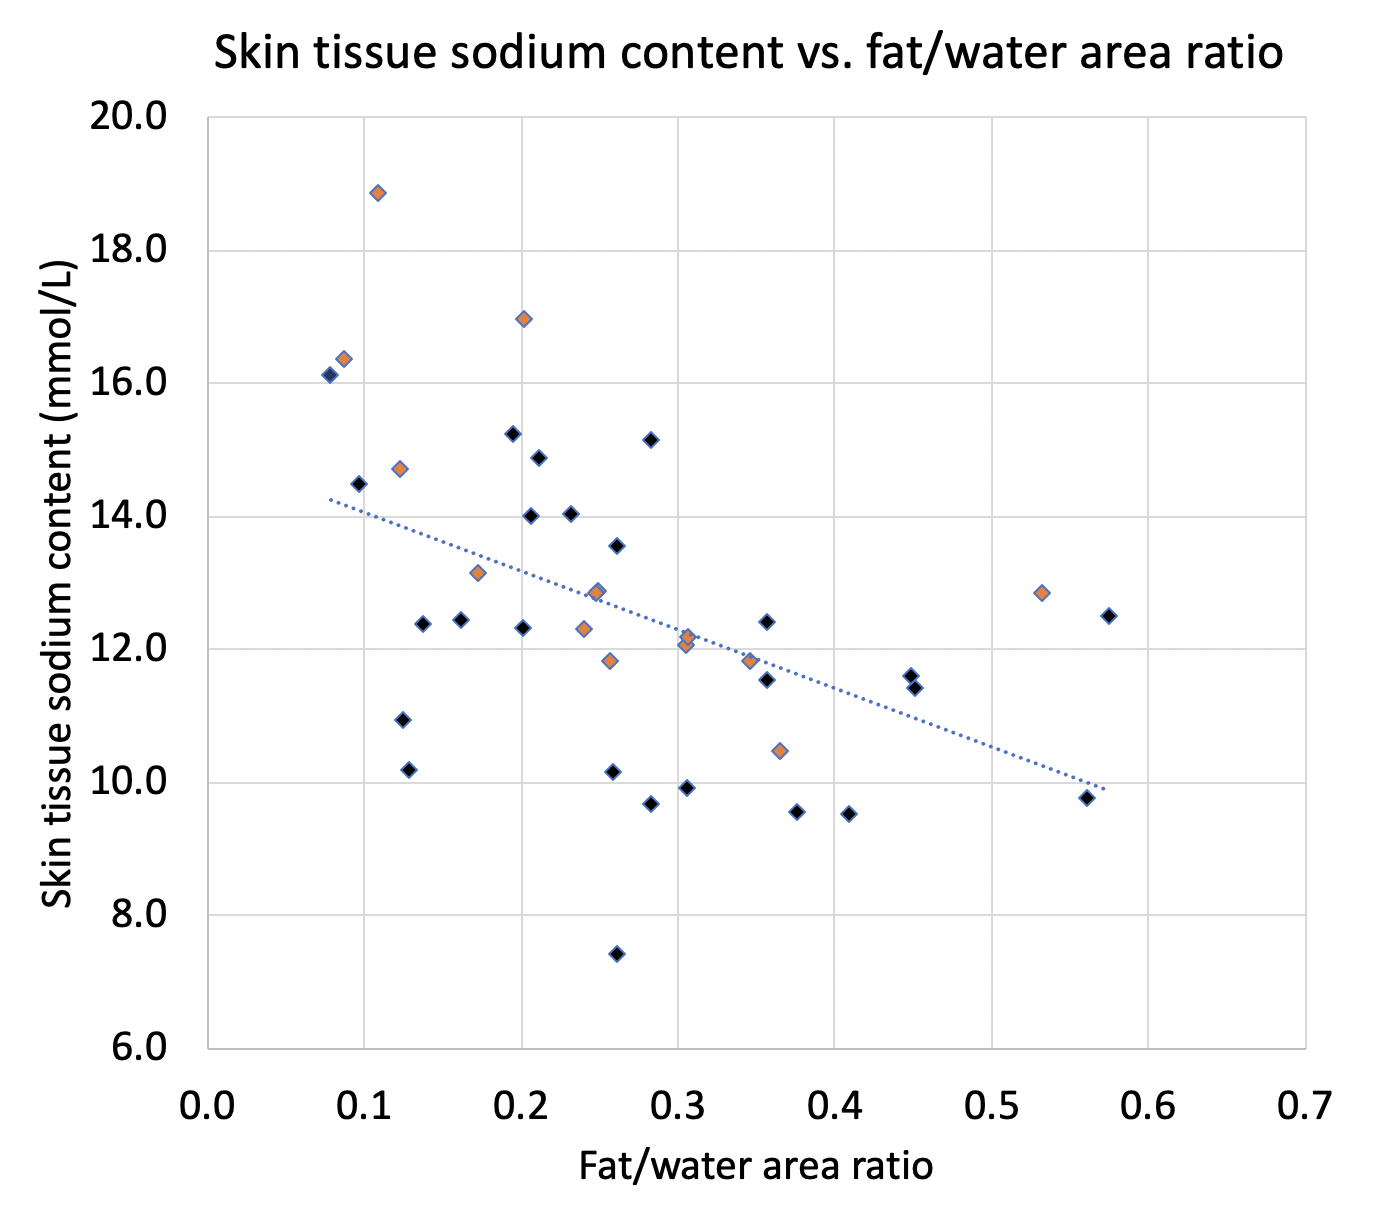
Salt sensitive blood pressure (SSBP) is a cardiovascular disease risk factor, yet clinically-feasible biomarkers of SSBP have not been developed. We tested the hypothesis that peripheral tissue sodium content (TSC), measured with 23Na-MRI, is higher in persons with vs. without SSBP (n=39 total; age=29.4±7.4 years; sex=21/18 F/M). SSBP was confirmed by independent measurement of BP increase >5 mmHg after high-salt diet compared to low-salt diet. SSBP participants (n=13) had elevated leg skin TSC (p=0.04), and TSC was inversely correlated with leg fat-fraction (ρ=-0.57; p<0.001). Findings suggest that multi-nuclear 23Na/1H-MRI could provide a radiological screening tool for SSBP.
Introduction
Hypertension is a major contributor to cardiovascular disease, affecting over one billion adults1. Approximately 75% of patients with hypertension have salt sensitive blood pressure (SSBP)2, a phenotype defined by a change in blood pressure (BP) >5 mmHg in response to dietary salt load. SSBP exacerbates life-long risk of cardiovascular disease, portends all-cause mortality3,4, and is associated with obesity5. However, current tests for SSBP require dietary salt loading, are time-consuming and expensive, and provide only limited information on SSBP mechanisms4,6. We hypothesize that 23Na/1H-MRI measurement of tissue sodium and fat composition may differentiate individuals with SSBP. If successful, this could allow new mechanistic investigations of SSBP and obviate the need for impractical salt-loading assays.Methods
Adult volunteers (n=39; age=29.4±7.4 years; sex=21/18 F/M; race=25/14 white/black) provided informed, written consent (Fig. 1). Participants underwent screening to determine eligibility based on physical examination, medical history, and caloric intake. Exclusion criteria were cardiovascular disease, hypertension, diabetes mellitus, renal disease, smoking, pregnancy, steroid use, or MRI contraindications.Diet. According to standard assessment for SSBP4, participants were randomized to a dietary intervention consisting of one week each of (1) high-salt, washout, low-salt or (2) low-salt, washout, high-salt diets in a crossover design stratified by race. High-salt diet consisted of two bullion broth packets per day added to the subject’s typical diet, raising sodium intake by 4,600 mg/day. Low-salt diet consisted of iso-caloric meals containing 460 mg/day sodium. Triplicate BP readings were measured following each diet week, and the difference in mean arterial pressure between high- and low-salt diet was preserved for statistical analyses.
MRI. Sodium MRI was performed on a 3.0T Philips Ingenia (Philips Healthcare, Best, The Netherlands) that incorporated digital broadband architecture for multi-nuclear imaging. The participant’s calf was placed in aquadrature, single-tuned 23Na knee coil (Rapid Biomedical GmbH, Rimpar, Germany), and the offset frequency of 23Na (Δω0=33.8MHz ±1150Hz) was measured and set for each scan. Sodium imaging was acquired using a 3D gradient-echo sequence (TR/TE=130/0.99ms; field-of-view [FOV]=192x192mm2, spatial resolution=3x3x30mm3; flip angle=90°; scan duration=15min). Four aqueous sodium standards containing 10, 20, 30, and 40 mmol/L NaCl were used for signal calibration (Fig. 2). In an identical FOV, proton-weighted imaging was acquired with the body coil using the multi-point Dixon method for fat- and water-weighted imaging (TR=200ms, TE1=1.15ms, TE2=2.30ms; in-plane spatial resolution=1x1mm2; slice thickness=5mm; flip angle=90°, scan duration=4min). MRI was performed at baseline or at least two weeks after diet completion.
Statistical analysis and hypothesis testing. Participants were classified as salt-sensitive if mean arterial pressure was >5 mmHg for high-salt versus low-salt diet. SSBP and non-SSBP groups were assessed for matching on age, body-mass index (BMI), race, and sex. Mann-Whitney U-tests were used to compare continuous variables and chi-square tests for categorical variables. Tissue sodium content (TSC) was calculated based on a linear signal calibration in the sodium standards. Mean TSC was measured in the skin segmented on the Dixon water-weighted image. The ratio of fat and non-fat soft tissue area (muscle+skin) was computed (fat/water ratio). To evaluate our primary hypothesis, a logistic regression model was utilized with SSBP status as the dependent variable and TSC and age as explanatory variables. As a secondary analysis we tested for a relationship between TSC and fat/water ratio using Spearman’s correlation. Significance criteria: two-sided p<0.05.
Results
Dietary assessments identified 13 participants as SSBP and 26 as non-SSBP. These groups were not significantly different in age (27.4±8.0 vs 30.4±7.0 years), BMI (23.7±2.9 vs. 22.4±2.5 kg/m2), race (3/13 SSBP black vs. 11/26 non-SSBP black), or sex (7/13 SSBP female vs. 14/26 non-SSBP female). Calf skin TSC was significantly higher in the SSBP group, controlling for age (13.6±2.4 vs. 12.1±2.2 mmol/L; p=0.04, Fig. 3). Fat/water ratio was not different between groups; however, fat/water ratio and skin TSC were inversely correlated (ρ=-0.57; p<0.001, Fig. 4).Discussion
SSBP is an independent risk factor for cardiovascular disease, and radiologic biomarkers are needed for diagnosis and to assess its mechanisms. We tested the hypothesis that persons with SSBP exhibit higher TSC and different profiles of fat composition. We carried out standard SSBP assessment and identified a subgroup with BP response to a sodium-controlled diet. This cohort exhibited greater skin sodium than the non-SSBP group, despite being statistically matched for BMI, race, sex, and age (also modeled as a covariate, as TSC increases with age)7. Higher skin TSC in SSBP is consistent with pre-clinical findings that skin sodium plays a role in BP control and salt-sensitive hypertension8,9. The inverse association between subcutaneous fat/water ratio and skin TSC is consonant with the idea that subcutaneous fat is protective against cardiovascular disease, in contrast to abdominal and visceral fat10. These findings suggest a possible mechanism for salt-sensitivity involving retention of additional dietary sodium in the peripheral tissues. However, it remains unclear whether elevated TSC is a cause or effect of SSBP. Moreover, future studies are needed to isolate acute effects of dietary sodium on skin TSC.Conclusion
We utilized a novel multi-nuclear imaging approach to demonstrate that SSBP is distinguished by skin sodium deposition on 23Na-MRI. We propose that extravascular tissue sodium may play an important role in the physiologic response to dietary salt.Acknowledgements
We would like to acknowledge all study participants, Erica Scaramuzza and Grace Henderson, the Vanderbilt University Institute for Imaging Science technical staff, and the nursing and support staff at the Clinical Research Center. Funding: American Heart Association 18CDA34110297 and 19IPLOI34760518, NIH 1S10OD021771-01 and 5K23HL128928-04, NCATS CTSA 5UL1TR002243-03, and Vanderbilt Institute for Clinical and Translational Research VR52797.References
1 Heron, M. Deaths: Leading Causes for 2016. Natl Vital Stat Rep 67, 1-77 (2018).
2 Oh, Y. S. et al. National Heart, Lung, and Blood Institute Working Group Report on Salt in Human Health and Sickness: Building on the Current Scientific Evidence. Hypertension 68, 281-288.
3 Morimoto, A. et al. Sodium sensitivity and cardiovascular events in patients with essential hypertension. Lancet 350, 1734-1737 (1997).
4 Elijovich, F. et al. Salt Sensitivity of Blood Pressure: A Scientific Statement From the American Heart Association. Hypertension 68, e7-e46 (2016).
5 Chen, J. et al. Metabolic syndrome and salt sensitivity of blood pressure in non-diabetic people in China: a dietary intervention study. Lancet 373, 829-835 (2009).
6 Kurtz, T. W., DiCarlo, S. E., Pravenec, M. & Morris, R. C., Jr. The American Heart Association Scientific Statement on salt sensitivity of blood pressure: Prompting consideration of alternative conceptual frameworks for the pathogenesis of salt sensitivity? J Hypertens 35, 2214-2225 (2017).
7 Kopp, C. et al. 23Na magnetic resonance imaging-determined tissue sodium in healthy subjects and hypertensive patients. Hypertension 61, 635-640 (2013).
8 Wiig, H. et al. Immune cells control skin lymphatic electrolyte homeostasis and blood pressure. J Clin Invest 123, 2803-2815 (2013).
9 Helle, F., Karlsen, T. V., Tenstad, O., Titze, J. & Wiig, H. High-salt diet increases hormonal sensitivity in skin pre-capillary resistance vessels. Acta Physiol (Oxf) 207, 577-581 (2013).
10 Neeland, I. J. et al. Body fat distribution and incident cardiovascular disease in obese adults. J Am Coll Cardiol65, 2150-2151 (2015).
Figures