0484
Fast In Vivo 23Na Imaging and T2* Mapping Using Non-Localized 2D FID Magnetic Resonance Spectroscopic Imaging at 3 T1School of Health Sciences, Purdue University, West Lafayette, IN, United States, 2Department of Radiology and Medical Imaging, Prince Sattam bin Abdulaziz University, Al Kharj, Saudi Arabia, 3Weldon School of Biomedical Engineering, Purdue University, West Lafayette, IN, United States, 4Institute of Radiology, University Hospital Erlangen, Friedrich-Alexander-Universität Erlangen-Nürnberg (FAU), Erlangen, Germany, 5Department of Radiology and Imaging Sciences, Indiana University School of Medicine, Indianapolis, IN, United States
Synopsis
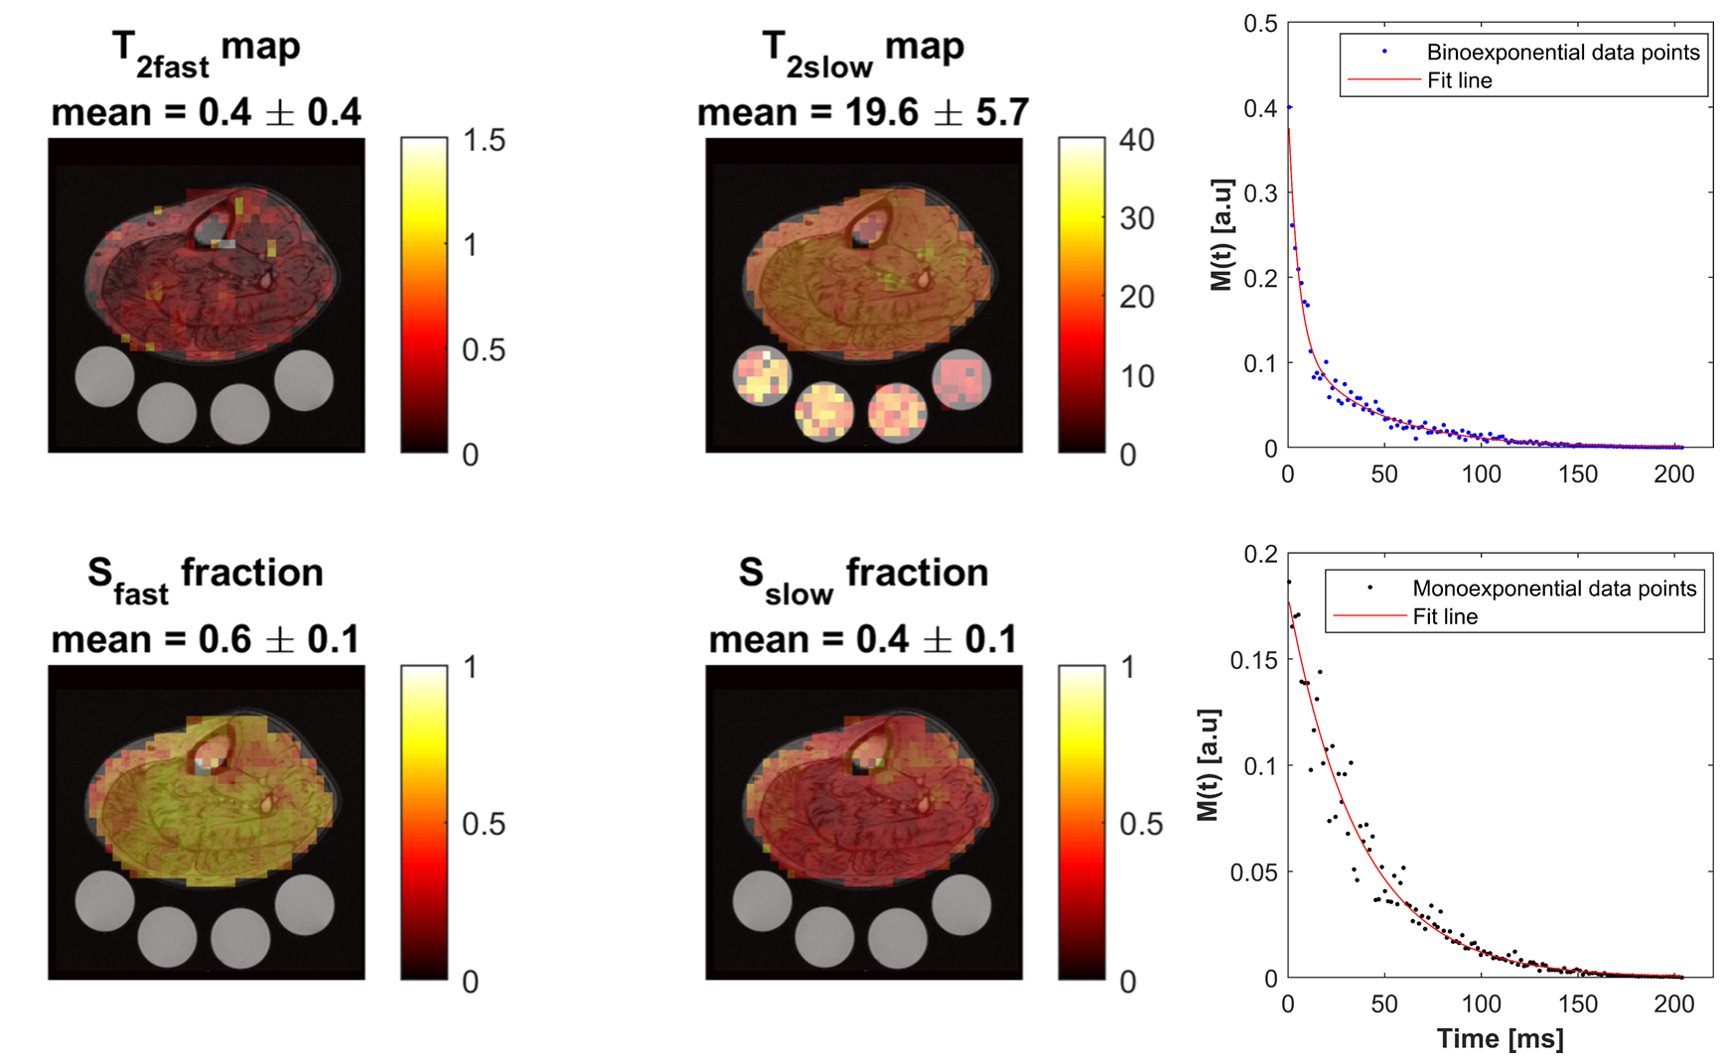
Sodium signal decays quickly and bi-exponentially, which make T2 relaxation fitting and absolute quantification challenging. Estimating T2 with enough data points using multiple echoes requires an impractical acquisition time. Alternatively, we propose a fast sodium 2D-FID-MRSI sequence to collect the decaying signal with a high sampling frequency (625 Hz) starting at 0.55 ms within only 4 minutes at 3T. We demonstrate an absolute concentration map and separate maps of fast (mean: 0.4 ±0.4 ms) and slow (mean: 19.6 ±5.7 ms) T2* components from human calf muscles, showing that rapid data collection for T2* correction is feasible with this 23Na-MRSI method.
Introduction
Sodium (23Na) plays an important role in maintaining several vital functions in the human body. In healthy tissues, the 23Na concentration in the intracellular space is 10-fold lower than within the extracellular space.1 The abnormal increase of the intracellular 23Na concentration can be a marker for several disorders such as muscle channelopathies,2 cancers and strokes.3 In addition, some common diseases, like diabetes and hypothyroidism, have been demonstrated to be related to the Na+/K+ pump dysfunction in skeletal muscle.4 The in vivo 23Na signal decays bi-exponentially, with fast (T2fast = 0.5 - 3.0 ms) and slow (T2slow = 15 - 30 ms) components of the transverse relaxation time (T2),5 resulting in a significant signal loss even with ultra-short TE (UTE). Additionally, for quantification, external 23Na references are usually used which are prepared either within an aqueous solution or an agarose gel environment, where the relaxation pattern is different than that in the biological system.5 Thus, a relaxation correction is needed to minimize these confounders. Furthermore, an accurate measurement of 23Na T2 relaxation has the potential to provide additional physiological information since a change in its value has been noticed after exercise.6 However, performing in-vivo 23Na T2* mapping is challenging. Recently, several studies have shown the feasibility of T2* mapping in the brain using 8 to 38 echoes, but these methods require long acquisition times (26 min - 1 h).7-11 Moreover, most of these methods are acquired with a long echo space and/or few samples which reduces the quality of data fitting. Therefore, the purpose of this work was to develop a fast density-weighted concentric ring trajectory (DW-CRT) MRSI acquisition to measure in vivo 23Na relaxation times in the lower leg muscles at 3T with a high sampling frequency. Additionally, to mitigate the long TE limitation when using slice-selective gradients, outer volume suppression (OVS) bands were used instead to reach UTE.Methods
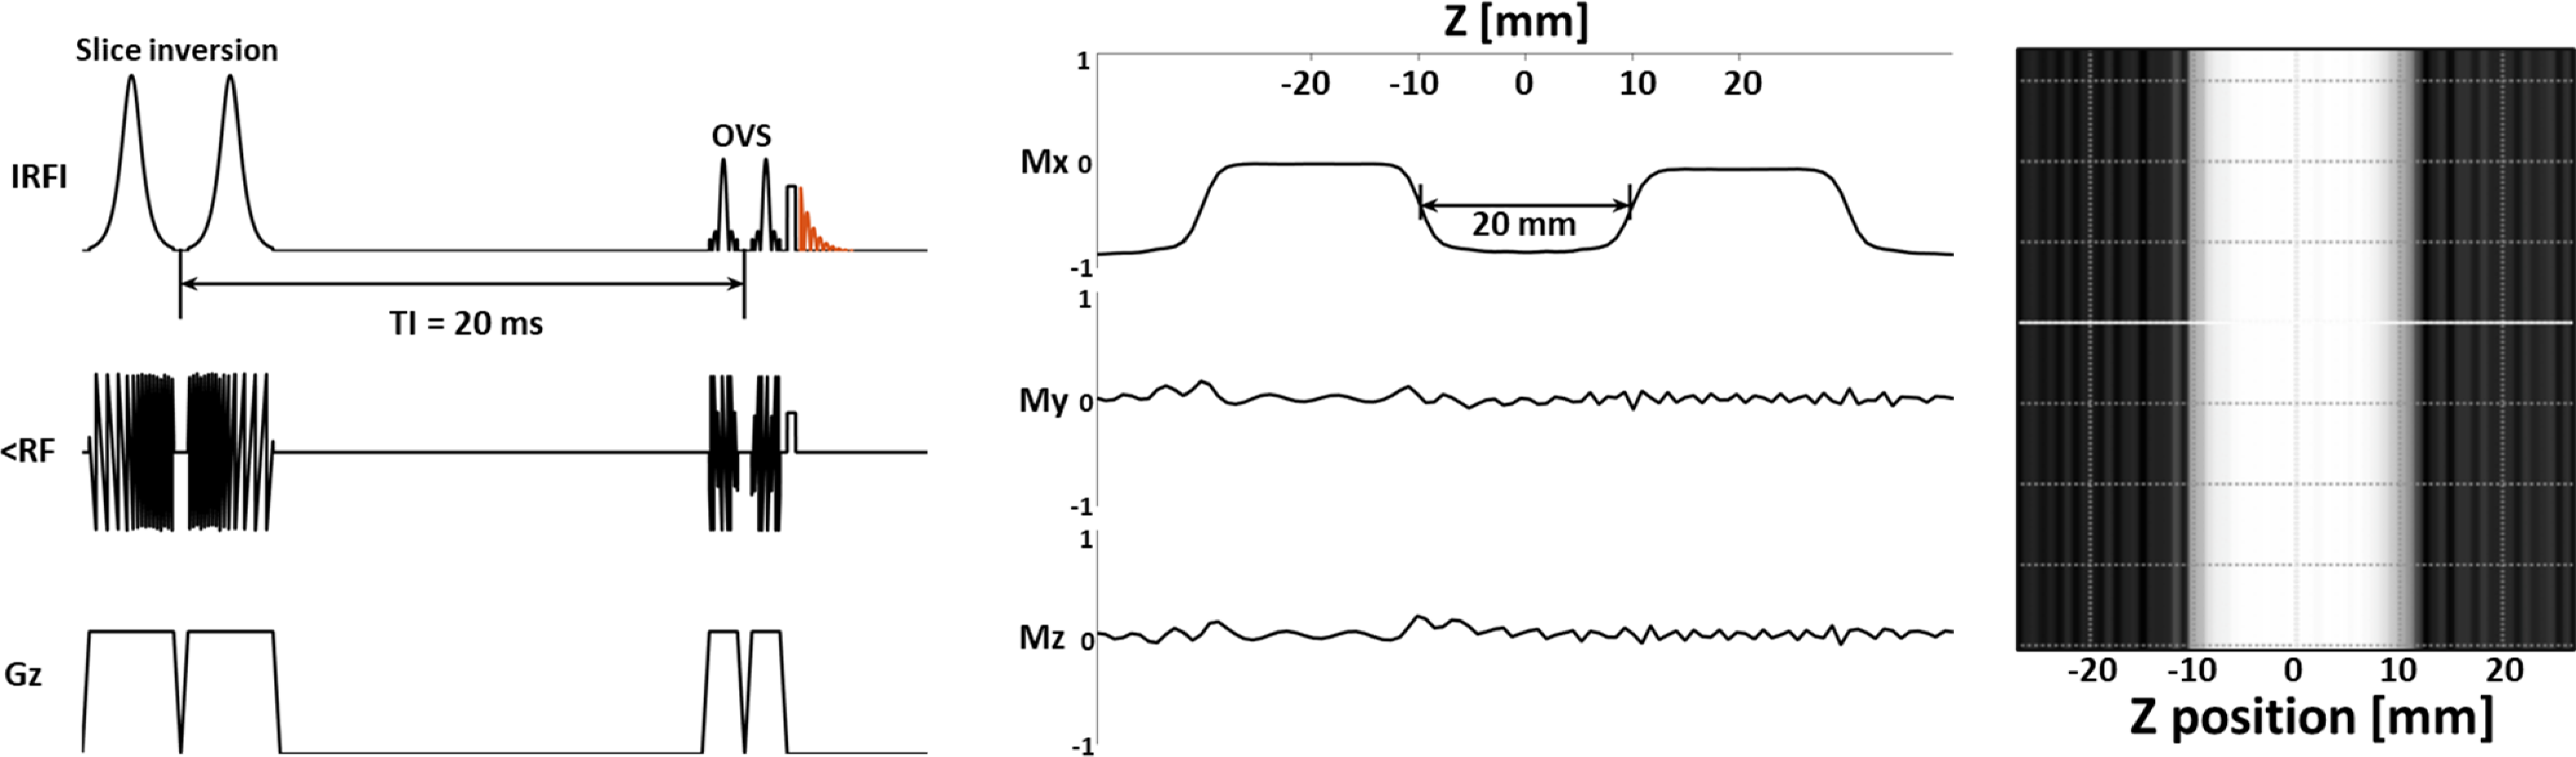
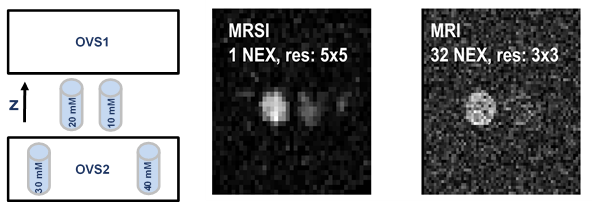
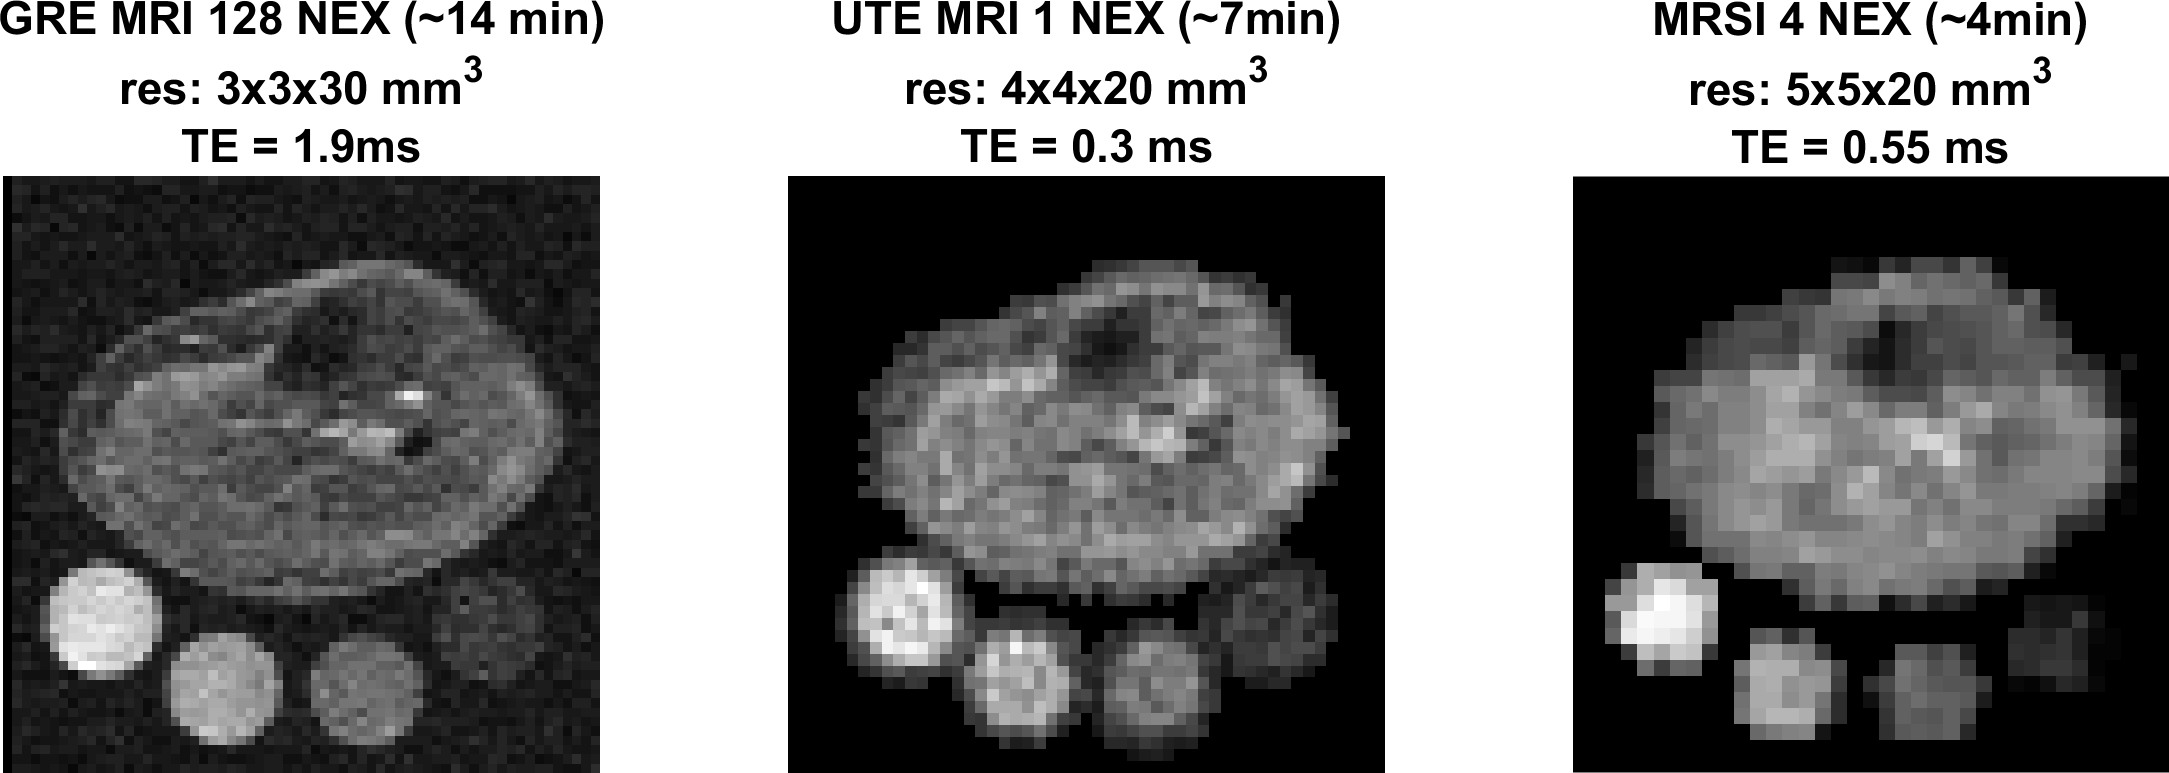
In-vivo scans were performed on healthy volunteers using a Siemens Prisma 3 Tesla (Siemens, Germany) scanner and a frequency-adapted mono-resonant transmit/receive birdcage knee coil (32.6 MHz, Stark-Contrast, Erlangen, Germany). 23Na-MRI was performed with two sequences, a GRE sequence 12 [TE/TR: 1.9 ms/100 ms, FA: 90°, 128 averages, resolution: 3×3×30 mm3, FOV: 192x192 mm2, total acquisition time (TA): 13.7 min], and a density-adapted 3D radial acquisition sequence 13 [UTE: 0.3 ms, TR: 100 ms, FA: 90°, 1 averages, 4x4x20 mm3 resolution, and FOV=192x192 mm2, AT: 6.66 min]. For the MRSI study, before excitation, an inversion pulse with inversion time (TI) of 20 ms was applied, followed by 2 OVS pulses on the z-direction. The FID MRSI parameters were: FOV 240×240 mm2, matrix size: 48×48, slice thickness: 20 mm, acquisition delay: 0.55 ms, TR: 650 ms. DW-CRT14 was implemented with the following parameters: points-per-ring=64, temporal samples=128, resolution=5×5×20 mm3, 24 rings, spatial interleaves=4, time acquire=96 s and spectral bandwidth = 625 Hz. The number of averages was 4, corresponding to a total acquisition duration of 4 minutes. The localization method was tested using simulation, in-vitro, and in-vivo studies. The acquired FID data were fitted to the biexponential decay to calculate the T2* relaxation time of the fast (T*2fast) and slow (T*2slow) components:$$SI = S_{fast}e^{\frac{-t}{T^*_{2fast}}}+S_{slow}e^{\frac{-t}{T^*_{2slow}}}$$
Sfast and Sslow are the signals from the fast and slow component, respectively; t indicates time
Results and Discussion
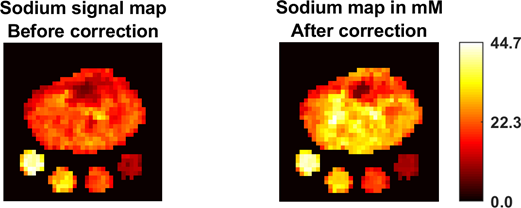
The OVS method was highly sensitive to the choice of TI. Our TI (20 ms) was determined based on the 23Na T1 (~29 ms)15 and judged by the simulation to achieve a good slice profile (Figure 1). The OVS localization performance was also validated by using 23Na phantoms (contain 2.9 g/L CuSO4 to mimic the in-vivo T1), as illustrated in Figure 2. Only signals from the phantoms between the assigned OVS bands were obtained. In vivo data was acquired by all three 23Na sequences (Figure 3). The MRSI maps agreed with the MRI images. Compared to the conventional GRE sequence, MRSI provided a higher signal in a shorter acquisition time (4 min compared to 13 min) taking advantage of its shorter delay time and adapted acquisition scheme. Indeed, the MRSI outputs were close to the UTE 3D sequence. The only drawback of the MRSI was the relatively lower spatial resolution. Using the MRSI FID data, the T2* relaxation components were evaluated, and their maps were generated, as illustrated in Figure 4. The measured T*2fast was 0.4 ± 0.4 ms with 0.6 ± 0.1 signal contribution (fraction) and T*2slow was 19.6 ± 5.7 ms, with 0.4 ± 0.1 signal fraction which agrees with previous reports.5 Finally, these maps were used to correct for the T2* and generate an absolute 23Na concentration map (Figure 5). This method provided 128 sample points starting at UTE of 0.55 ms, which gave enough time points for fitting. T*2fast and T*2slow maps show considerable regional variability and demonstrate the potential for future characterization of 23Na in conditions such as muscle diseases, cancers, strokes, and cartilage degeneration. The feasibility of localizing species with very short T2* has been shown previously with 13C.16 This is the first time this method has been applied to 23Na imaging.Conclusion
The proposed method allows fast data collection for sodium T2* correction.Acknowledgements
Supported by the Indiana CTSI, funded in part by grant #UL1TR001108 from the NIH, NCATS, CTS Award.References
1. Hilal SK, Roschmann P, Ra JB, Oh CH, Mun IK, Einstein SG. Sodium imaging. Magnetic resonance imaging. 1988:715-31.
2. Weber MA, Nielles-Vallespin S, Essig M, Jurkat-Rott K, Kauczor HU, Lehmann-Horn F. Muscle Na+ channelopathies MRI detects intracellular 23Na accumulation during episodic weakness. Neurology. 2006 Oct 10;67(7):1151-8.
3. Boada FE, LaVerde G, Jungreis C, Nemoto E, Tanase C, Hancu I. Loss of cell ion homeostasis and cell viability in the brain: what sodium MRI can tell us. Current topics in developmental biology. 2005 Jan 1;70:77-101.
4. Clausen T. Na+-K+ pump regulation and skeletal muscle contractility. Physiological reviews. 2003 Oct;83(4):1269-324.
5. Madelin G, Lee JS, Regatte RR, Jerschow A. Sodium MRI: methods and applications. Progress in nuclear magnetic resonance spectroscopy. 2014 May 1;79:14-47.
6. Bansal N, Szczepaniak L, Ternullo D, Fleckenstein JL, Malloy CR. Effect of exercise on 23Na MRI and relaxation characteristics of the human calf muscle. Journal of Magnetic Resonance Imaging. 2000 May;11(5):532-8.
7. Blunck Y, Josan S, Taqdees SW, Moffat BA, Ordidge RJ, Cleary JO, Johnston LA. 3D‐multi‐echo radial imaging of 23Na (3D‐MERINA) for time‐efficient multi‐parameter tissue compartment mapping. Magnetic resonance in medicine. 2018 Apr;79(4):1950-61.
8. Riemer F, Solanky BS, Wheeler‐Kingshott CA, Golay X. Bi‐exponential 23Na T2* component analysis in the human brain. NMR in Biomedicine. 2018 May;31(5):e3899.
9. Lommen JM, Flassbeck S, Behl NG, Niesporek S, Bachert P, Ladd ME, Nagel AM. Probing the microscopic environment of 23Na ions in brain tissue by MRI: On the accuracy of different sampling schemes for the determination of rapid, biexponential decay at low signal‐to‐noise ratio. Magnetic resonance in medicine. 2018 Aug;80(2):571-84.
10. Ridley B, Nagel AM, Bydder M, Maarouf A, Stellmann JP, Gherib S, Verneuil J, Viout P, Guye M, Ranjeva JP, Zaaraoui W. Distribution of brain sodium long and short relaxation times and concentrations: a multi-echo ultra-high field 23 Na MRI study. Scientific reports. 2018 Mar 12;8(1):4357.
11. Syeda W, Blunck Y, Kolbe S, Cleary JO, Johnston LA. A continuum of components: Flexible fast fraction mapping in sodium MRI. Magnetic resonance in medicine. 2019 Jun;81(6):3854-64.
12. Kopp C, Linz P, Wachsmuth L, Dahlmann A, Horbach T, Schöfl C, Renz W, Santoro D, Niendorf T, Müller DN, Neininger M. 23Na magnetic resonance imaging of tissue sodium. Hypertension. 2012 Jan 1;59(1):167-72.
13. Nagel AM, Laun FB, Weber MA, Matthies C, Semmler W, Schad LR. Sodium MRI using a density‐adapted 3D radial acquisition technique. Magnetic Resonance in Medicine: An Official Journal of the International Society for Magnetic Resonance in Medicine. 2009 Dec;62(6):1565-73.
14. Steel A, Chiew M, Jezzard P, Voets NL, Plaha P, Thomas MA, Stagg CJ, Emir UE. Metabolite-cycled density-weighted concentric rings k-space trajectory (DW-CRT) enables high-resolution 1 H magnetic resonance spectroscopic imaging at 3-Tesla. Scientific reports. 2018 May 17;8(1):7792.
15. Nagel AM, Amarteifio E, Lehmann-Horn F, Jurkat-Rott K, Semmler W, Schad LR, Weber MA. 3 Tesla sodium inversion recovery magnetic resonance imaging allows for improved visualization of intracellular sodium content changes in muscular channelopathies. Investigative radiology. 2011 Dec 1;46(12):759-66.
16. Choi IY, Tkáč I, Gruetter R. Single‐shot, three‐dimensional “non‐echo” localization method for in vivo NMR spectroscopy. Magnetic Resonance in Medicine: An Official Journal of the International Society for Magnetic Resonance in Medicine. 2000 Sep;44(3):387-94.
Figures