0483
Quantitative imaging of the transmembrane sodium gradient in brain tumors
Muhammad H. Khan1, John J. Walsh1, Sandeep K. Mishra2, Daniel Coman2, and Fahmeed Hyder1,2
1Biomedical Engineering, Yale University, New Haven, CT, United States, 2Radiology & Biomedical Imaging, Yale University, New Haven, CT, United States
1Biomedical Engineering, Yale University, New Haven, CT, United States, 2Radiology & Biomedical Imaging, Yale University, New Haven, CT, United States
Synopsis
The transmembrane sodium gradient (difference between extracellular and intracellular concentrations) is necessary for the proper functioning of many bodily mechanisms, including action potential propagation and osmoregulation. While unbound sodium-23 (23Na) is fully detectable by NMR, it is not possible to discriminate between compartments because all 23Na signals resonate at the same frequency. Our objective is to induce 23Na chemical shift differences across cellular compartments with exogenous contrast agents that occupy the interstitial space. We applied this approach successfully in vivo to determine the variation of the transmembrane gradient in glioblastoma.
Introduction
Quantifying the transmembrane sodium gradient(ΔNa+) is imperative because it is involved in many bodily processes1,2, and thought to be weakened in cancer, the second-leading cause of American deaths. Correlations between a depolarized membrane potential, i.e. ΔNa+ weakening, and aberrant proliferation, the hallmark of cancer3, implicate ΔNa+ as a key factor in tumor aggressiveness. The 100%-abundant sodium-23(23Na) nucleus is NMR-visible, but 23Na-NMR can only quantify total free sodium4. ΔNa+ cannot be quantified since extracellular(Na+e) and intracellular(Na+i) 23Na signals overlap. We sought to separate the signals in these compartments using exogenous contrast agents(CAs), which necessitates accounting for the blood 23Na signal(Na+b) also. One such CA is thulium(III)-1,4,7,10-tetraazacyclododeccane-1,4,7,10-tetrakis(methylenephosphonate)(TmDOTP5-)5(Figure 1(a)). Since this infused CA resides in the blood and extracellular space(ECS), it induces a chemical shift difference in the Na+b and Na+e signals versus the unperturbed Na+i signal(Figure 1(b)). This shift occurs by electrostatic interaction between Na+ and TmDOTP5-, dependent on both the latter’s charge and compartmental concentration. Therefore, we posited that among the three separated signals(Na+b, Na+e and Na+i), the most shifted signal would be attributed to Na+b. Although TmDOTP5- has been shown to achieve 23Na signal separation5, conclusions were qualitative at best, employing whole-brain spectra that did not formally establish induced chemical shift as a function of physiology. Quantitative attempts followed6, but were limited for in situ biological applications. In this study, we rigorously quantified the effects of TmDOTP5- in terms of pH, temperature and concentration in vitro prior to in vivo administration in glioblastoma(GBM) models with 1-μL resolution throughout the brain.Methods
Sodium-23 shift was quantified versus several variables in two-compartment phantoms on a 500-MHz Bruker vertical-bore spectrometer. Samples in one compartment were run at varying pH(5.5–8.5), temperature(300–313 K) and CA concentrations(1–10 mM) against the other held at constant, agent-free conditions. Agar/NaCl phantoms were also prepared in varying amounts(0-2%) to simulate different Na+ binding, mimicking tissue, and T1/T2 were respectively measured using inversion recovery and spin echo. Rat models with GBM were imaged using 23Na-chemical-shift-imaging(CSI) to visualize signal separation upon infusion of TmDOTP5-(1 mmol/kg). Tumor cells were injected intracranially and tumor growth was monitored until reaching 3-mm in diameter. Imaging was performed on a 9.4T horizontal-bore Bruker system using a 23Na/1H-quadrature coil with brain-wide localization and optimization. Rats were anesthetized via isoflurane(1.5–2%) with a cannulated tail vein for CA infusion. Both 1H T2-weighted MRI and 23Na-CSI were performed before and after infusion.Results
Sodium-23 shift was altered by changing pH, temperature, and concentration. However, under biological conditions(pH 6–8, 300–313 K), pH and temperature variations were negligible(Figure 1(c-d)). While pH/temperature-dependence became more significant for larger concentrations, such conditions were not seen in vivo(Figure 2). This means agent concentration is the sole variable influencing 23Na shift. The “23Na shiftability” of TmDOTP5- is approximately 3ppm/mM when [Na+] is 150mM, the concentration in ECS1. T1/T2 from the phantoms and in vivo measurements are presented in Figure 3. Na+ binding in vivo is similar to that in 2% agar. 23Na-CSI in vivo revealed the presence of one peak before, and multiple peaks after TmDOTP5-. Voxel-wise 23Na spectra and their total integral values before(black) and after(green) TmDOTP5- are displayed in Figure 2. Intratumoral voxels(4,5) exhibited spectra with three peaks, where the most-shifted peak occurred ~1.5-2ppm, an intermediate ~0.5ppm, and an unshifted peak at 0ppm. Ventricular voxels(1,6) displayed one Lorentzian lineshape shifted ~0.5ppm. Healthy tissue(2,3) also displayed one peak shifted to the same extent but was super-Lorentzian. Assigning the most-shifted peak as Na+b, intermediate as Na+e, and unshifted as Na+i, integration of magnitude-corrected spectra generated spatial maps(Figure 4) which divulged relative concentrations of each compartment and ΔNa+. For every animal(n = 13) – across U251, U87 and RG2 tumors - ΔNa+ values in the tumor were significantly(p < 0.05) lower compared to healthy tissue.Discussion
The induced 23Na shift in vivo was most evident in the tumor(across all types) where TmDOTP5- extravasation consistently engendered three 23Na peaks: Na+b, Na+e and Na+i(Figure 2). This was achievable in the tumor since the compromised blood-brain-barrier(BBB) allowed access to ECS. In healthy tissue, extravasation was limited by an intact BBB so the shift was minimal, and Na+ binding yielded super-Lorentzian lineshapes7. The ventricles, which mainly contain cerebrospinal fluid(CSF), exhibited Lorentzian spectra shifted to the same degree as Na+e. This is plausible since CSF and ECS are in contact. ΔNa+, calculated by subtracting the Na+i from the Na+e integral, was significantly reduced in cancerous versus healthy brain across all types(Figure 4). The results agree with prior findings that correlate a depolarized membrane potential with proliferation3. This approach efficaciously provides a non-invasive method to characterize in vivo electrophysiology, which traditionally was achieved by inserting electrodes into the brain8. However, the lack of a Na+ standard allows only rough quantification of ΔNa+ and prevents absolute concentration measurementConclusion
23Na-CSI was applied successfully employing TmDOTP5- in vivo to quantitatively map ΔNa+ in rat GBM models. The data reveal consistent ΔNa+ weakening within tumors compared to normal tissue, but is reduced due to lowering of Na+ in both compartments. The current study enables the potential of in vivo 3D 23Na-NMR to characterize tumor electrophysiology, paving the way for future clinical applications.Acknowledgements
Supported by NIH (R01EB-011968)References
- Cheng C-J, Kuo E, Huang C-L. Extracellular potassium homeostasis: insights from hypokalemic periodic paralysis. Semin Nephrol. 2013;33(3):237-247. doi:10.1016/j.semnephrol.2013.04.004.
- Weidensteiner C, Horn M, Fekete E, Neubauer S, Kienlin von M. Imaging of intracellular sodium with shift reagent aided 23Na CSI in isolated rat hearts. Magn Reson Med. 2002;48(1):89-96. doi:10.1002/mrm.10205.
- Yang M, Brackenbury WJ. Membrane potential and cancer progression. Frontiers in Physiology. 2013;4. doi:10.3389/fphys.2013.00185.
- Christensen JD, Barrère BJ, Boada FE, Vevea JM, Thulborn KR. Quantitative tissue sodium concentration mapping of normal rat brain. Magn Reson Med. 1996;36(1):83-89.
- Bansal N, Germann MJ, Lazar I, Malloy CR, Sherry AD. In vivo Na-23 MR imaging and spectroscopy of rat brain during TmDOTP5- infusion. J Magn Reson Imaging. 1992;2(4):385-391.
- Puckeridge M, Chapman BE, Conigrave AD, Kuchel PW. Quantitative model of NMR chemical shifts of 23Na+ induced by TmDOTP: Applications in studies of Na+ transport in human erythrocytes. Journal of Inorganic Biochemistry. 2012;115:211-219. doi:10.1016/j.jinorgbio.2012.03.009.
- Madelin G, Lee J-S, Regatte RR, Jerschow A. Sodium MRI: methods and applications. Neuhaus D, Gadian D, eds. Prog Nucl Magn Reson Spectrosc. 2014;79:14-47. doi:10.1016/j.pnmrs.2014.02.001.
- Hunt, DL, Lai, C, Smith, RD et al. Multimodal in vivo brain electrophysiology with integrated glass microelectrodes. Nat Biomed Eng 3, 741–753 (2019) doi:10.1038/s41551-019-0373-8
Figures
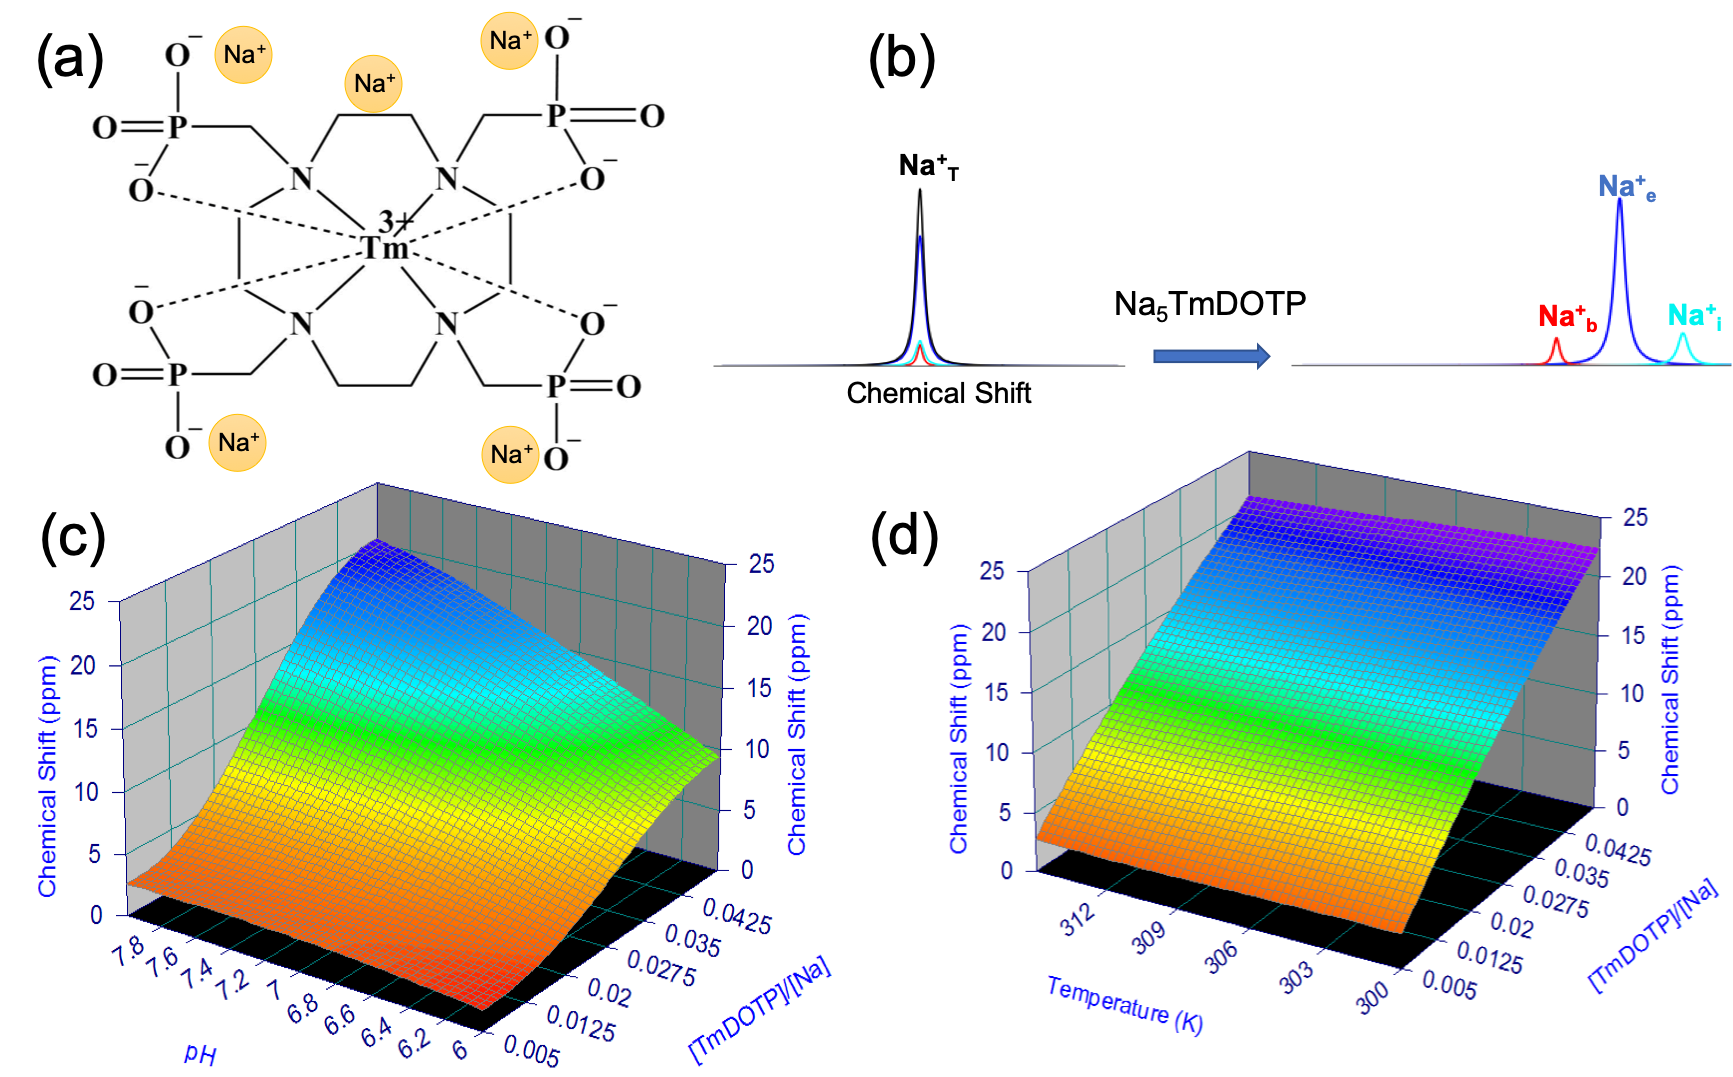
Figure 1: (a) Chemical structure of TmDOTP5-. The Tm3+ core and polyanionic charge allow the complex to shift five Na+. (b) TmDOTP5- can resolve the overlapping 23Na compartmental signals (only observable as a total signal Na+T) into separate blood (Na+b), extracellular (Na+e), and intracellular (Na+i) peaks. (c, d) 23Na chemical shift versus TmDOTP5- concentration and (c) pH / (d) temperature. Under biological conditions (pH 6-8, 300-313 K), concentration remains the most important parameter for 23Na shift.
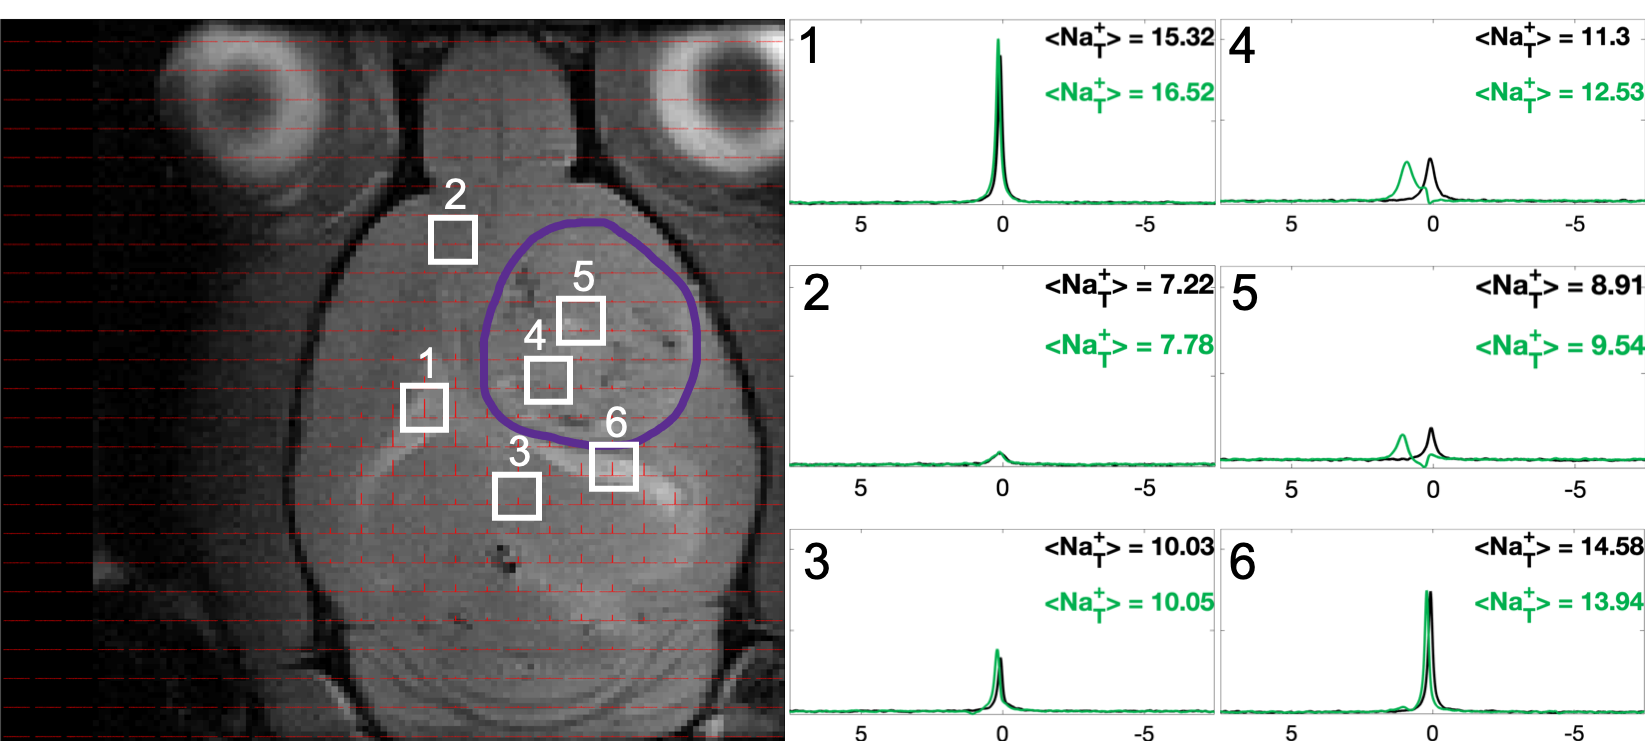
Figure 2: 23Na CSI for a tumored rat brain with 23Na spectra and integrals shown for voxels before (black) and after (green) TmDOTP5- (tumor boundary in purple). Tumor voxels (4,5) show large peak separation, with the most-shifted assigned to blood (Na+b), second-most to extracellular (Na+e) and the unshifted to intracellular (Na+i). Ventricle voxels (1,6) show one Lorentzian peak shifted to the same extent as tumoral Na+e and healthy tissue (2,3) shows a peak shifted the same amount but super-Lorentzian.
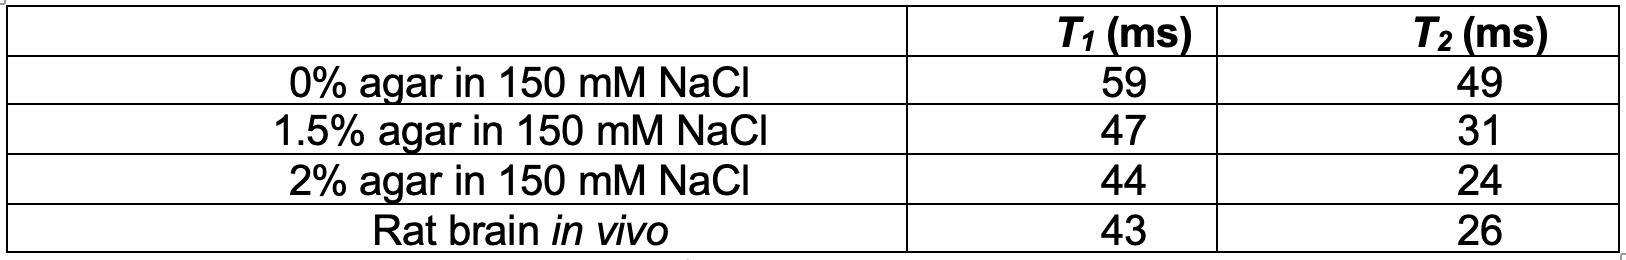
Figure 3: Relaxation measurements from in vitro agar/NaCl phantoms and in vivo rat brain. T1 was measured using inversion recovery, with Gaussian excitation and inversion pulses. T2 was measured using spin echo with Gaussian excitation and refocusing pulses. In vivo relaxation times are most similar to 2% agar, indicating brain tissue and the phantom contain similar fractions of bound Na+.
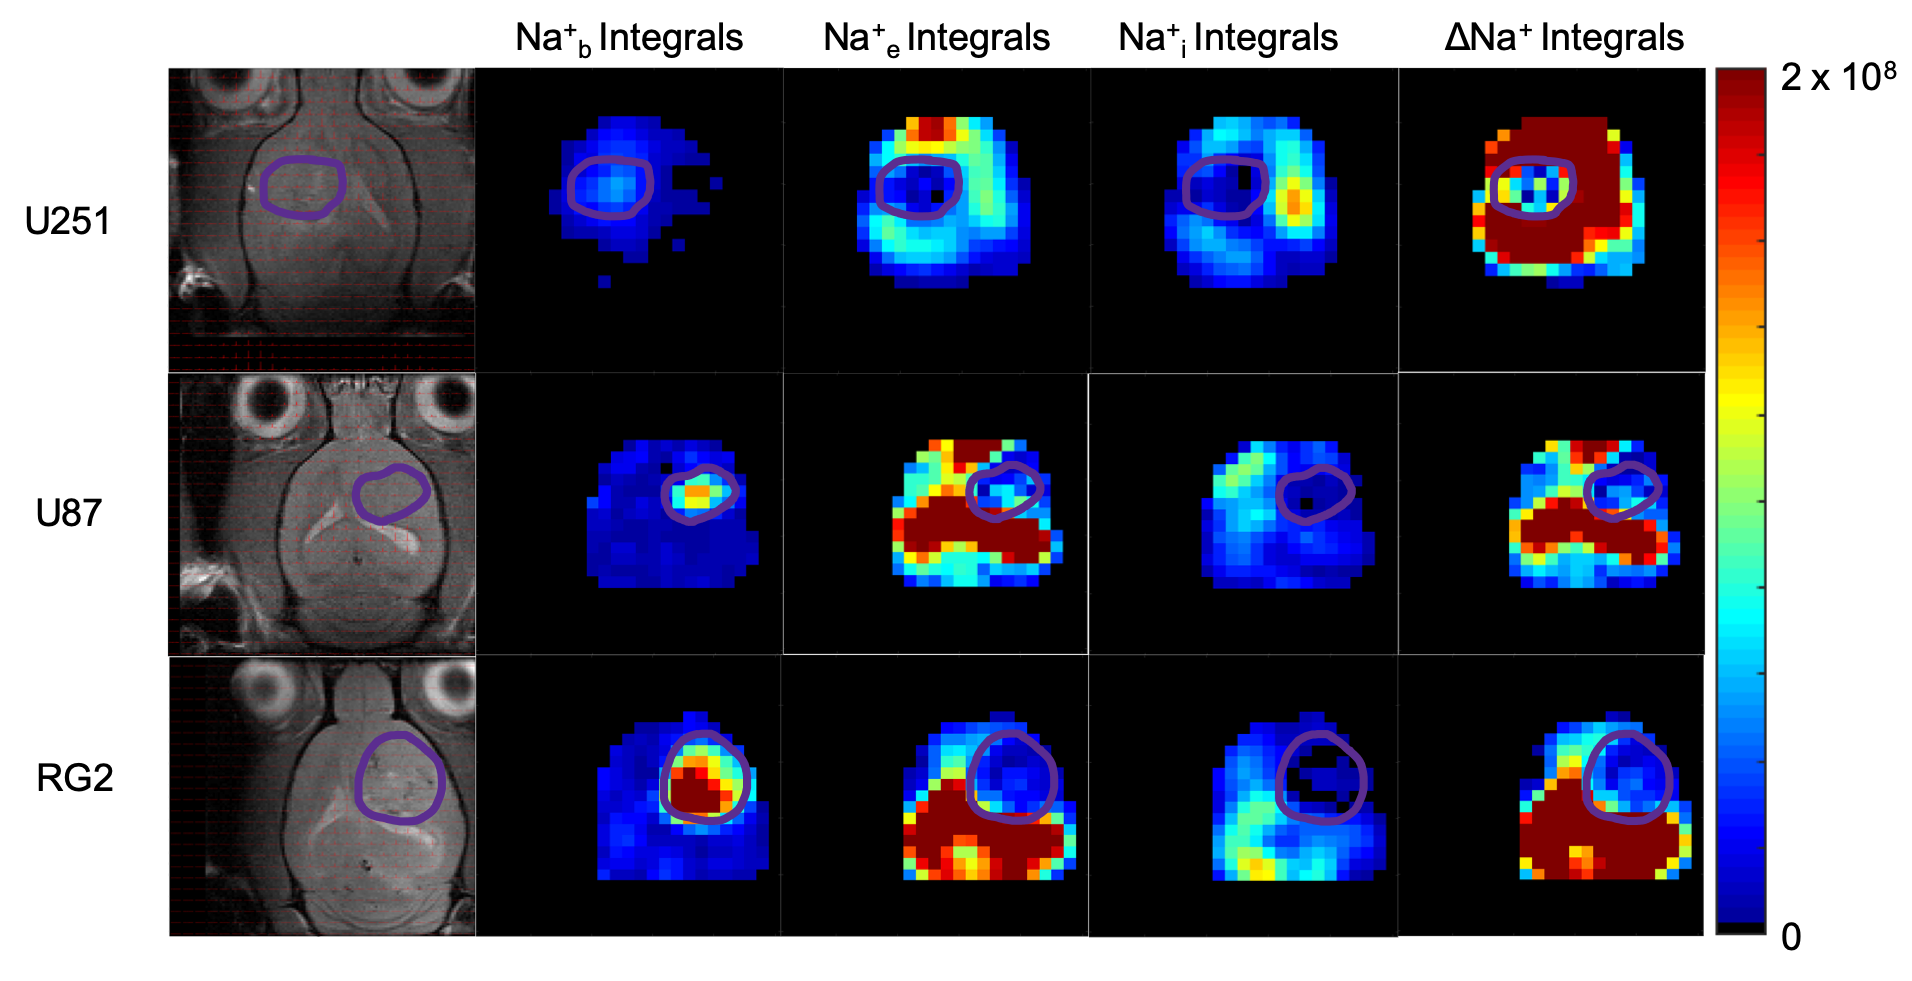
Figure 4: Spatial 23Na peak integral maps for representative animals from each of three cancer cell lines. In each, the tumor boundary is outlined in purple. Na+b was found to be higher in the tumor, while both Na+e and Na+i were reduced. This yields a significantly (p < 0.05) reduced ΔNa+ map for each animal, making the sodium gradient a biological marker for oncogenic potential and electrophysiological characterization.