0482
Regional Analysis of CMRO2 in Human Brain Using Dynamic 17O-MRI1Dept. of Radiology, Medical Physics, Medical Center University of Freiburg, Faculty of Medicine, University of Freiburg, Freiburg, Germany, 2German Consortium for Translational Cancer Research (DKTK) Partner Site Freiburg, German Cancer Research Center (DKFZ), Heidelberg, Germany
Synopsis
In this work, regional quantification of the cerebral metabolic rate of oxygen consumption (CMRO2) was performed using dynamic 17O-MRI with inhalation of isotope-enriched 17O2. First, global mean CMRO2 values were determined in cortical grey matter and white matter. Then, local CMRO2 was investigated in frontal, parietal and occipital areas, respectively. The results were in good agreement with previously reported PET values especially for the cortical grey matter. For regional analysis, the CMRO2 values show good consistency across the white matter and in both frontal and parietal cortical grey matter.
Introduction
Normal brain function requires the maintenance of normal oxygen metabolism,1 for which CMRO2 is considered a direct indicator.2 Abnormal changes of CMRO2 have been found in diseases such as stroke, tumors, Alzheimer's disease and other cerebrovascular diseases.3-5 Quantitative CMRO2 measurements can be performed with 15O-PET, but this is challenging to perform in clinical routine due to the short half-life of 15O of about 2 min.6 An alternative to 15O-PET is 17O-MRI with the stable isotope 17O which can be dynamically imaged before, during and after inhalation of enriched 17O gas.7-11 Due to the low SNR of 17O-MRI, CMRO2 has typically only been quantified in larger brain regions such as grey matter (GM) and white matter (WM). In this work, we investigate regional differences of CMRO2 in frontal, parietal and occipital areas with 17O-MRI, and we compare the results with global WM and GM values.Methods
A dynamic in vivo 17O measurement was carried out acquiring 44 3D datasets of the human brain using a custom-built Tx/Rx 17O quadrature radiofrequency coil on a clinical 3 Tesla whole body MR system (Prisma; Siemens, Erlangen, Germany). During the inhalation experiment in a healthy volunteer (male, age 29y), datasets were acquired before (baseline, 10 min), during (17O gas inhalation, 3 min; rebreathing, 13 min) and after (wash-out, 18min) a delivery of 1.5±0.1 L 70%-enriched 17O gas (NUKEM GmbH).A 3D ultra-short echo-time (UTE) sequence was employed for 17O imaging with Golden-angle acquisition pattern with the following imaging parameters: nominal resolution = 8 mm3, TE = 0.51 ms, TR = 9.5 ms, BW = 360 Hz/px, Number of spokes =288k, acquisition time TA = 44 min. 17O images were reconstructed with conventional sliding window and Kaiser-Bessel regridding (time resolution, 1 min). In addition, a T1-weighted high resolution 1H 3D MPRAGE data set (resolution: 0.9x0.9x1 mm3, TI = 900 ms) was acquired for co-registration and tissue segmentation. Image registration between 17O and 1H anatomical images was achieved with the help of two intermediate registration scans. A rigid registration algorithm was employed with MATTES mutual information as the similarity measure. GM and WM masks were created using border marquee and thresholding in MATLAB (R2018a). The cortical GM and WM masks were further segmented into frontal, parietal and occipital areas (ROIs) using the central sulcus and the parieo-occipital sulcus as separation. Global GM and WM mean CMRO2 was first analyzed, and then CMRO2 values from local ROIs were investigated to evaluate the regional differences.
Results
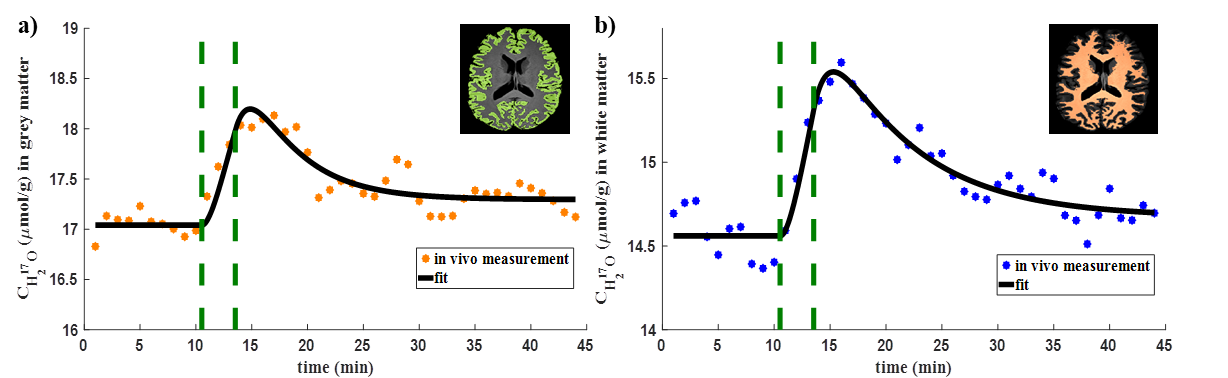
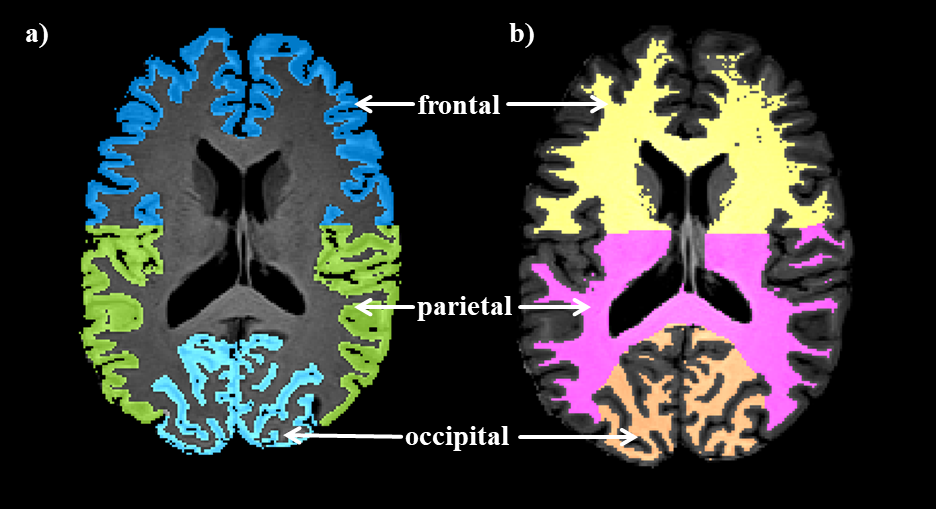
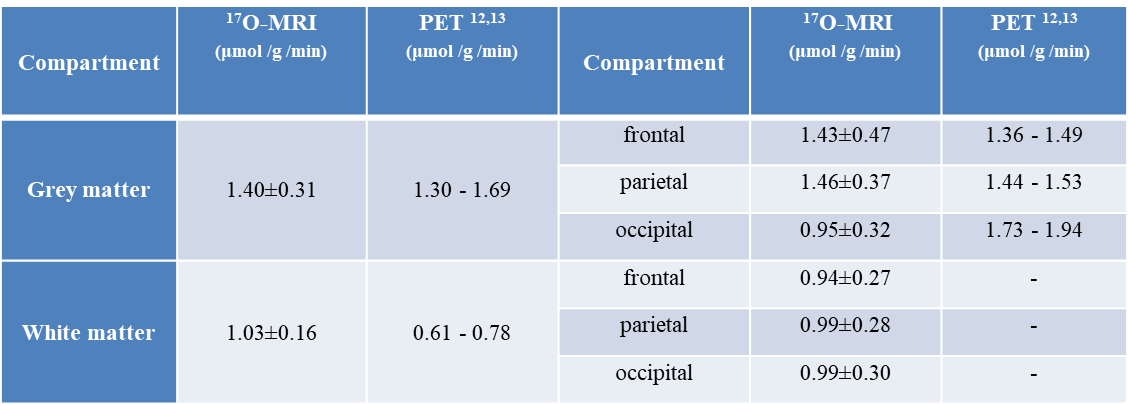
All measured CMRO2 values are summarized in Table 1 together with literature values12,13 for comparison. Figure 1 shows the resulting H217O concentration (CH217O) changes over time in GM and WM during the 17O inhalation experiment. Globally, CMRO2 values of 1.40±0.31 / 1.03±0.16 μmol/g/min were determined for GM / WM. For local CMRO2 analysis, Fig. 2 shows the regional masks superimposed on a T1-weighted image. The dynamic 17O signals were extracted from these local compartments and the local CMRO2 values were determined (Table 1). In frontal and parietal GM, CMRO2 values were 1.43±0.47 μmol/g/min and 1.46±0.37 μmol/g/min. However, CMRO2 value in occipital GM was 0.95±0.32 μmol/g/min, which is lower than that in frontal and parietal areas. For the regional white matter analysis, CMRO2 in these areas was nearly constant: 0.94±0.27 μmol/g/min (frontal), 0.99±0.28 μmol/g/min (parietal) and 0.99±0.30 μmol/g/min (occipital).Discussion and Outlook
In this work, the mean CMRO2 value determined in GM shows a good agreement with previously reported values in both PET and other MRI studies.12,13 For white matter the mean CMRO2 value was overestimated by about 32%-68%, most likely due to a systematic bias by partial volume effects with other cerebral tissues. Regional CMRO2 values in frontal and parietal GM were nearly identical which is in line with the PET results from Masanobu et al.13. However, the CMRO2 value in occipital GM was lower than in the PET studies, which could be caused by coil inhomogeneities and residual signals from the large sagittal sinus. For the local analysis of WM, the determined CMRO2 values show a good consistency across the WM. In the future, with an improved spatial resolution further regional analyses could be performed in regions such as thalamus or putamen.Acknowledgements
Financial support from NUKEM Isotopes is gratefully acknowledged.References
1. Schneider J, Berndt N, Papageorgiou IE, et al. Local oxygen homeostasis during various neuronal network activity states in the mouse hippocampus. J Cereb Blood Flow Metab, 2019; 39(5):859-873.
2. Bolar DS, Rosen BR, Sorensen AG, et al. QUantitative Imaging of eXtraction of oxygen and TIssue consumption (QUIXOTIC) using venular- targeted velocity-selective spin labeling. Magn Reson Med, 2011; 66 (6): 1550-1562.
3. Aanerud J, Borghammer P, Chakravarty MM, et al. Brain energy metabolism and blood flow differences in healthy aging. J Cereb Blood Flow Metab, 2012; 32 (7): 1177-1187.
4. De Vis JB, Petersen ET, Bhogal A, et al. Calibrated MRI to evaluate cerebral hemodynamics in patients with an internal carotid artery occlusion. J Cereb Blood Flow Metab, 2015; 35 (6): 1015-1023.
5. Fukuyama H, Ogawa M, Yamauchi H, et al. Altered cerebral energy metabolism in Alzheimer's disease: a PET study. J Nucl Med. 1994; 35(1):1-6.
6. Bulte DP, Kelly M, Germuska M, et al. Quantitative measurement of cerebral physiology using respiratory-calibrated MRI. Neuroimage. 2012; 60(1):582-591.
7. Borowiak R, Groebner J, Haas M, et al. Direct cerebral and cardiac 17O-MRI at 3 Tesla: initial results at natural abundance. MAGMA, 2014; 27 (1): 95-99.
8. Kurzhunov D, Borowiak R, Hass H, et al. Quantification of oxygen metabolic rates in Human brain with dynamic (17) O MRI: Profile likelihood analysis. Magn Reson Med, 2017; 78 (3): 1157-1167.
9. Kurzhunov D, Borowiak R, Reisert M, et al. Direct estimation of 17 O MR images (DIESIS) for quantification of oxygen metabolism in the human brain with partial volume correction. Magn Reson Med, 2018; 80 (6): 2717-2725.
10. Kurzhunov D, Borowiak R, Reisert M, et al. 3D CMRO2 mapping in human brain with direct 17O MRI: Comparison of conventional and proton-constrained reconstructions. Neuroimage, 2017; 155:612-624.
11. Hoffmann SH, Begovatz P, Nagel AM, et al. A measurement setup for direct 17O MRI at 7 T. Magn Reson Med, 2011; 66(4): 1109-1115.
12. Pantano P, Baron JC, Lebrun-Grandié P, et al. Regional cerebral blood flow and oxygen consumption in human aging. Stroke 1984; 15(4):635-641.
13. Ibaraki M, Miura S, Shimosegawa E, et al. Quantification of cerebral blood flow and oxygen metabolism with 3-dimensional PET and 15O: validation by comparison with 2-dimensional PET. J Nucl Med. 2008; 49(1):50-59.
Figures