0481
Direct 17O-ZTE-MRI reveals decreased cerebral metabolic rate of oxygen consumption in a murine model of amyloidosis1Molecular Imaging Research Center (MIRCen), Commissariat à l’Energie Atomique et aux Energies Alternatives (CEA), Fontenay-aux-Roses, France, 2Neurodegenerative Diseases Laboratory (UMR 9199), Centre National de la Recherche Scientifique (CNRS), Université Paris-Sud, Université Paris-Saclay, Fontenay-aux-Roses, France
Synopsis
The cerebral metabolic rate of oxygen consumption (CMRO2) is an important metric of brain metabolism. It is of particular interest in preclinical studies of Alzheimer’s disease, where amyloidosis has been associated with impaired mitochondrial function. CMRO2 can be measured by direct 17O-MRI of H217O signal changes during inhalation of 17O-labeled oxygen gas. In this study, we used 3D zero echo time 17O-(ZTE-)MRI at 11.7T to measure CMRO2 in the APP/PS1dE9 mouse model of amyloidosis and show that it is significantly lower than in control mice.
INTRODUCTION
The cerebral metabolic rate of oxygen consumption (CMRO2) is an important metric of brain metabolism. Accumulation of amyloid-beta in the brain, one of the hallmarks of Alzheimer’s disease, has been associated with a defect in mitochondrial function.1 Relevant non-invasive tools to measure CMRO2 with high spatial resolution are required to assess mechanisms leading to AD-related mitochondrial dysfunction and propose new therapies. Positron Emission Tomography of inhaled 15O2 is the gold standard for CMRO2 measurements, but suffers from low spatial resolution, which is limiting for mice studies. Moreover, the half-life of 15O is very short (120s) and direct access to a cyclotron is required. As an alternative, the MR visible stable isotope 17O can be used in a similar manner: 17O-labeled oxygen gas is administered and metabolically produced H217O MR signal can be detected.2 In this study, we used 3D zero echo time (ZTE-)MRI of H217O in the APP/PS1dE9 mouse model of amyloidosis and showed a reduction of CMRO2.METHODS
Subjects. APP/PS1dE9 mice (n=4, 24.4±1.4g, age=13±1 months) and wild-type littermates (CTR, n=4, 24.8±2.1g, age=11.6±0.3 months) were used.Anesthesia. Animals were first anesthetized with isoflurane mixed in medical air (1-2%) for insertion of a tail vein catheter. Mice were placed prone on a water-heated bed, equipped for temperature and breathing rate monitoring. Mice received an initial I.V. bolus of medetomidine (0.1 mg/kg domitor®, Vetoquinol) followed by infusion (0.2mg/kg/h) for maintenance and isoflurane was progressively decreased to 0% within 10min. CMRO2 measurements were performed 45-60min later, when physiological parameters were stable (~120-140 breath/min, ~36.5°C).
MR experiments. Acquisitions were performed at 11.7T (Bruker) using Paravision 6.0.1. A quadrature volume 1H-coil was used for shimming and acquisition of RARE images (TR/TE=3000/30ms; RARE factor 8; FOV: 20x20mm2; matrix size: 192x192; slice thickness: 0.5mm). Because 17O relaxation times are very short (T1/T2~6/1.5ms), choosing an optimal short TR/TE acquisition strategy is critical. We compared the performance of an optimized 3D-MRSI sequence (TE=0.3ms) with that of 3D-ZTE with identical TR (1.8ms) and spatial resolution (1.5x1.5x1.5mm3) on an unlabeled-water phantom using a home-built linear surface 17O-coil (10mm). The signal-to-noise ratio (SNR) was more than 2-fold-higher in ZTE than in MRSI for similar acquisition times (SNRZTE= 45 vs. SNRCSI=20; Fig. 1). Subsequent in vivo 17O studies were conducted using 3D-ZTE (5-μs broad pulse, TR:1.3ms, BW:18 kHz, FOV:48x48x48mm3, matrix size:32x32x32, NA: 4). These parameters yielded a nominal spatial resolution of 1.5x1.5x1.5mm3 and a time resolution of 17s. 3D-ZTE were continuously acquired before (10min), during (200s), and after (15min) inhalation of 70%-enriched 17O2 (Nukem Isotopes). To that effect, the breathing circuit was transiently switched to a home-built gas delivery system (Fig. 2) that automatically delivered 160mL 17O-enriched O2 over 200s.
Data analysis. After 3D regridding in Paravision, data were exported in Matlab and Hamming filter and Fourier transform were applied. This yielded an effective spatial resolution of 3x3x3mm3. Time-courses were normalized to baseline assuming [H217O]=20.35μmol/g, and CMRO2 maps were derived by fitting signal changes during inhalation to a linear model, as previously described.3 For group comparison, 8 voxels (effective volume: 100μL) were conservatively chosen within the brain of each subject (Fig. 3a) for signal averaging. Whole brain and ventricles volumes were determined by automated segmentation using an in-house developed python library (https://sammba-mri.github.io/). Mann-Whitney’s U tests were used for group comparison. Data are presented as mean±standard deviation.
RESULTS
H217O signal started to increase immediately upon inhalation of labeled gas (Fig.3b), showing incorporation of 17O2 into H217O via mitochondrial metabolism. CMRO2 values were significantly lower in APP/PS1dE9 (1.52±0.07 μmol/g/min) than in CTR (1.27±0.08 μmol/g/min) (Fig.3c, **p=0.0028). After switching back to 16O2, H217O signal decayed and reached a new steady state, higher than baseline signal. Whole brain and ventricles volumes were not significantly different between groups (4.5±0.2 μL in APP/PS1dE9 and 4.3±0.1μL in CTR).DISCUSSION
We found that ZTE was advantageous over CSI to detect rapidly decaying 17O signal, allowing higher SNR. While it was possible to determine CMRO2 on a single voxel basis (Fig.4), such resolution still yielded significant partial volume between the different structures at the mouse brain scale, and we chose to average the signal from 8 voxels for robust individual measurements. CMRO2 values obtained in CTR (1.52±0.07 μmol/g/min) were lower than previously reported (2-3 μmol/g/min).4,5 This difference may simply reflect a different physiological state in our work, possibly due to the older age of the animal, lower body temperature, blood oxygenation6 and/or, importantly, the effect of anesthetic on cerebral blood flow7 (CBF) and glucose oxidation rates.8 Previous studies used isoflurane, known to induce vasodilation and increase CBF, while medetomidine induces lower resting CBF,7 possibly affecting CMRO2. Oxygen metabolism might also vary in hyperoxic conditions, such as the 100% O2 inhalation used in our study. Partial volume could constitute a methodological bias, as we cannot exclude that ventricles and other non-brain tissues contribute to the measured 17O signal, which would lead to an underestimation of CMRO2. However, partial volumes were also present in former works in rodents, and no significant difference was detected between ventricles sizes in APP/PS1dE9 and CTR mice in this study. Therefore, the lower CMRO2 in APP/PS1dE9 compared to CTR in our conditions likely reflects mitochondrial dysfunction.Acknowledgements
This work was partly funded by NeurATRIS: A Translational Research Infrastructure for Biotherapies in Neurosciences (“Investissements d'Avenir”, ANR-11-INBS-0011)References
1. Readnower, R.D., A.D. Sauerbeck, and P.G. Sullivan, Mitochondria, Amyloid beta, and Alzheimer's Disease. Int J Alzheimers Dis, 2011. 2011: p. 104545.
2. Arai, T., et al., Cerebral oxygen utilization analyzed by the use of oxygen-17 and its nuclear magnetic resonance. Biochem Biophys Res Commun, 1990. 169(1): p. 153-8.
3. Zhang, N., et al., Simplified methods for calculating cerebral metabolic rate of oxygen based on 17O magnetic resonance spectroscopic imaging measurement during a short 17O2 inhalation. J Cereb Blood Flow Metab, 2004. 24(8): p. 840-8.
4. Cui, W., et al., Non-invasive measurement of cerebral oxygen metabolism in the mouse brain by ultra-high field (17)O MR spectroscopy. J Cereb Blood Flow Metab, 2013. 33(12): p. 1846-9.
5. Lou, S., et al., Oxygen consumption deficit in Huntington disease mouse brain under metabolic stress. Hum Mol Genet, 2016. 25(13): p. 2813-2826.
6. Xu, F., et al., Effect of hypoxia and hyperoxia on cerebral blood flow, blood oxygenation, and oxidative metabolism. J Cereb Blood Flow Metab, 2012. 32(10): p. 1909-18.
7. Petrinovic, M.M., et al., A novel anesthesia regime enables neurofunctional studies and imaging genetics across mouse strains. Sci Rep, 2016. 6: p. 24523.
8. Shulman, R.G., et al., Energetic basis of brain activity: implications for neuroimaging. Trends Neurosci, 2004. 27(8): p. 489-95.
Figures
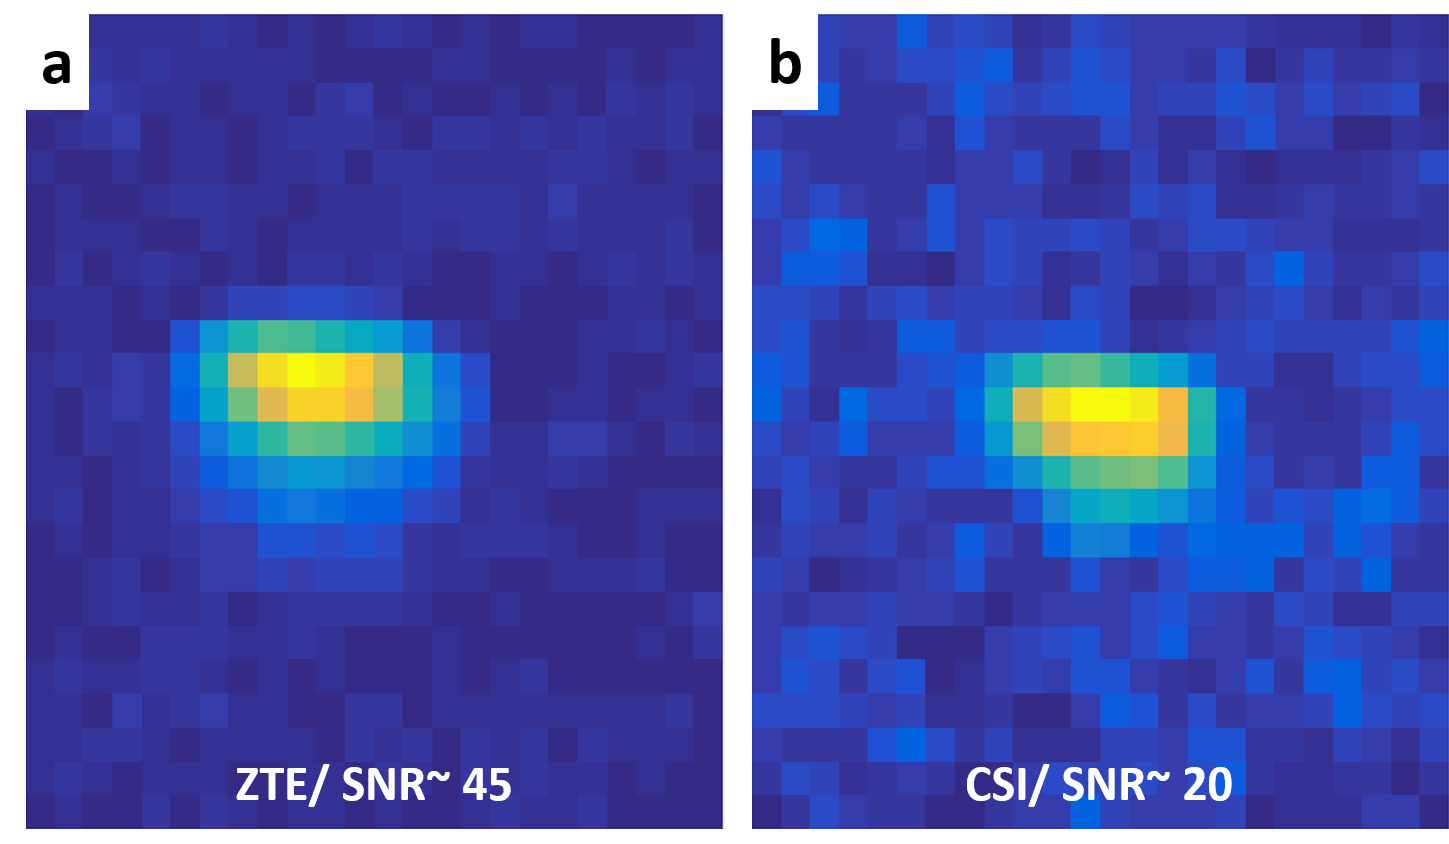
Figure 1: SNR comparison between 17O ZTE-MRI and MRSI
Data were acquired with identical 5 μs broad pulse excitation, TR=1.8ms and the same total scan duration from a cylindrical tube (10mm diameter) filled with unlabeled water, with the surface coil was placed on top. Spatial resolution was 1.5x1.5x1.5 mm3. Hamming filter was applied on both images. The MRSI image results from spectral integration of the water peak. A higher SNR was obtained with ZTE (a) (SNRZTE~45) than with MRSI (b) (SNRMRSI~20) in our conditions.
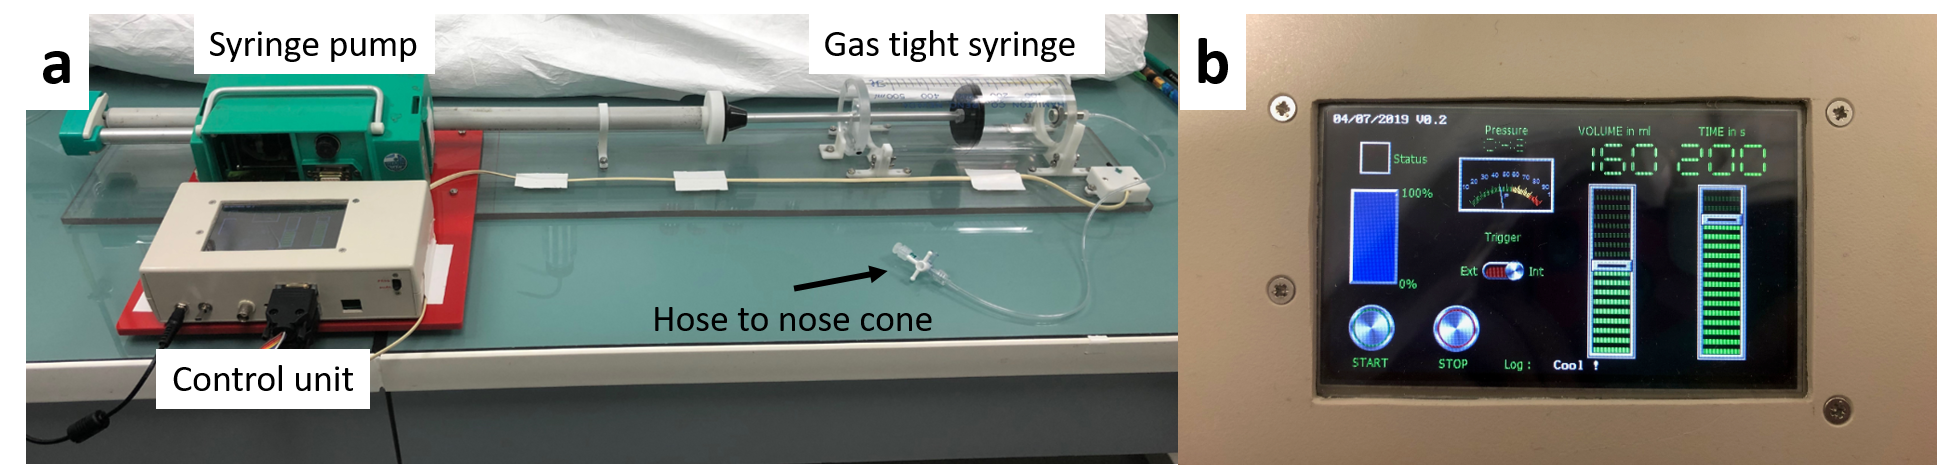
Figure 2: Gas delivery system
(a) The 17O2 delivery system consisted of a gas-tight acrylic syringe (500 mL, Hamilton) and a customized syringe pump. The stepper motor was driven by a microcontroller unit (Arduino, Uno R3). (b) A programmable tactile graphic user interface (4D Systems, µLCD-43PT) allowed prescribing the injection protocol parameters (volume, duration and start/stop control) on the control unit.
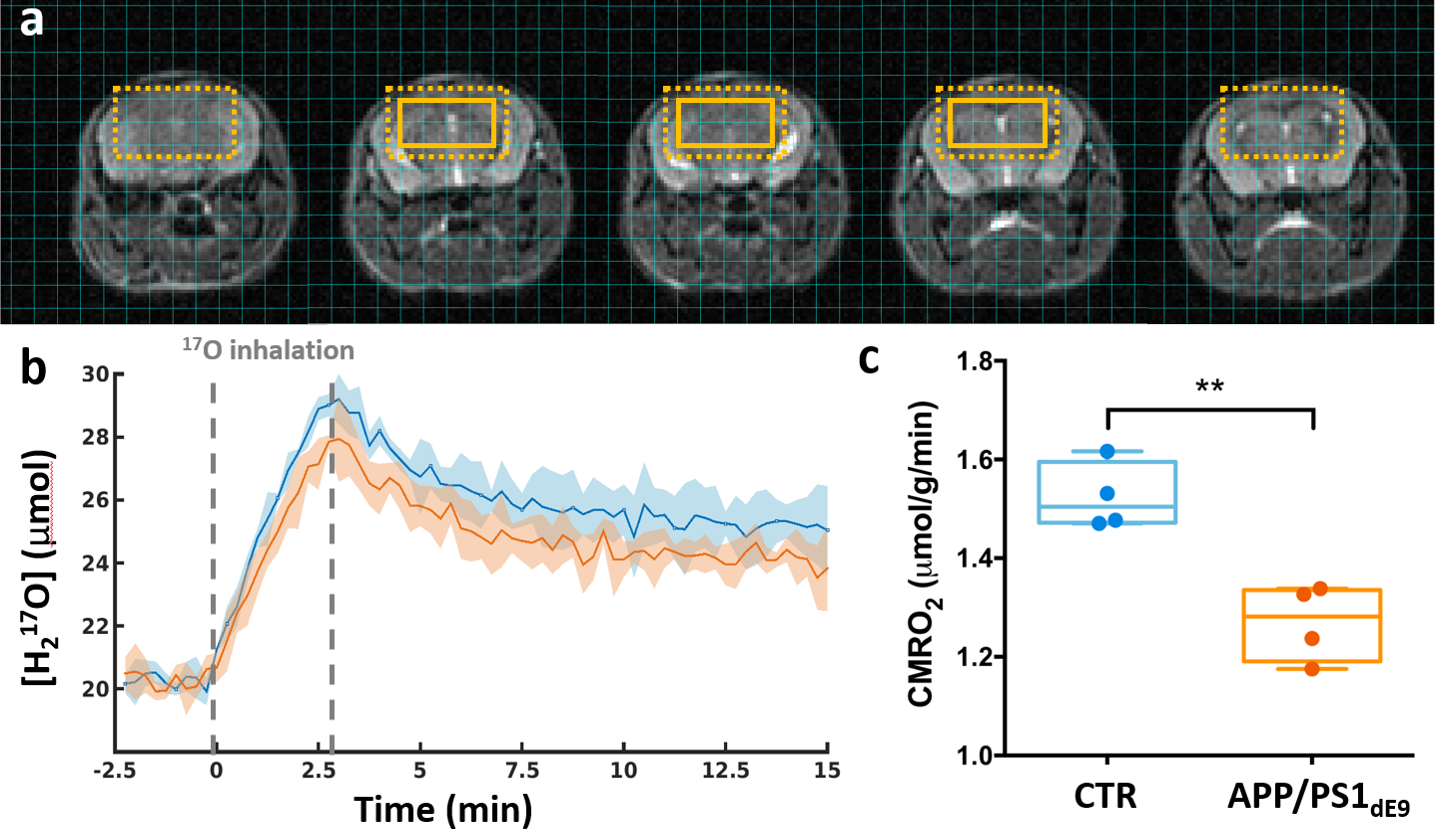
Figure 3: CMRO2 is decreased in APP/PS1dE9 mice compared to CTR.
(a) Anatomical images with overlay showing the extent of a typical region of interest (8 voxels). The dotted box indicates the effective resolution after application of a hamming filter (100μL). (b) Time-courses of normalized H217O signal in APP/PS1dE9 (orange) and CTR (blue), presented as group mean ± SD. Grey dotted lines indicate the 17O2 inhalation period. (c) Box plots and individual CMRO2 values derived from the slope of the increasing [H217O] during inhalation. **p=0.0028 (Mann-Whitney's U test).
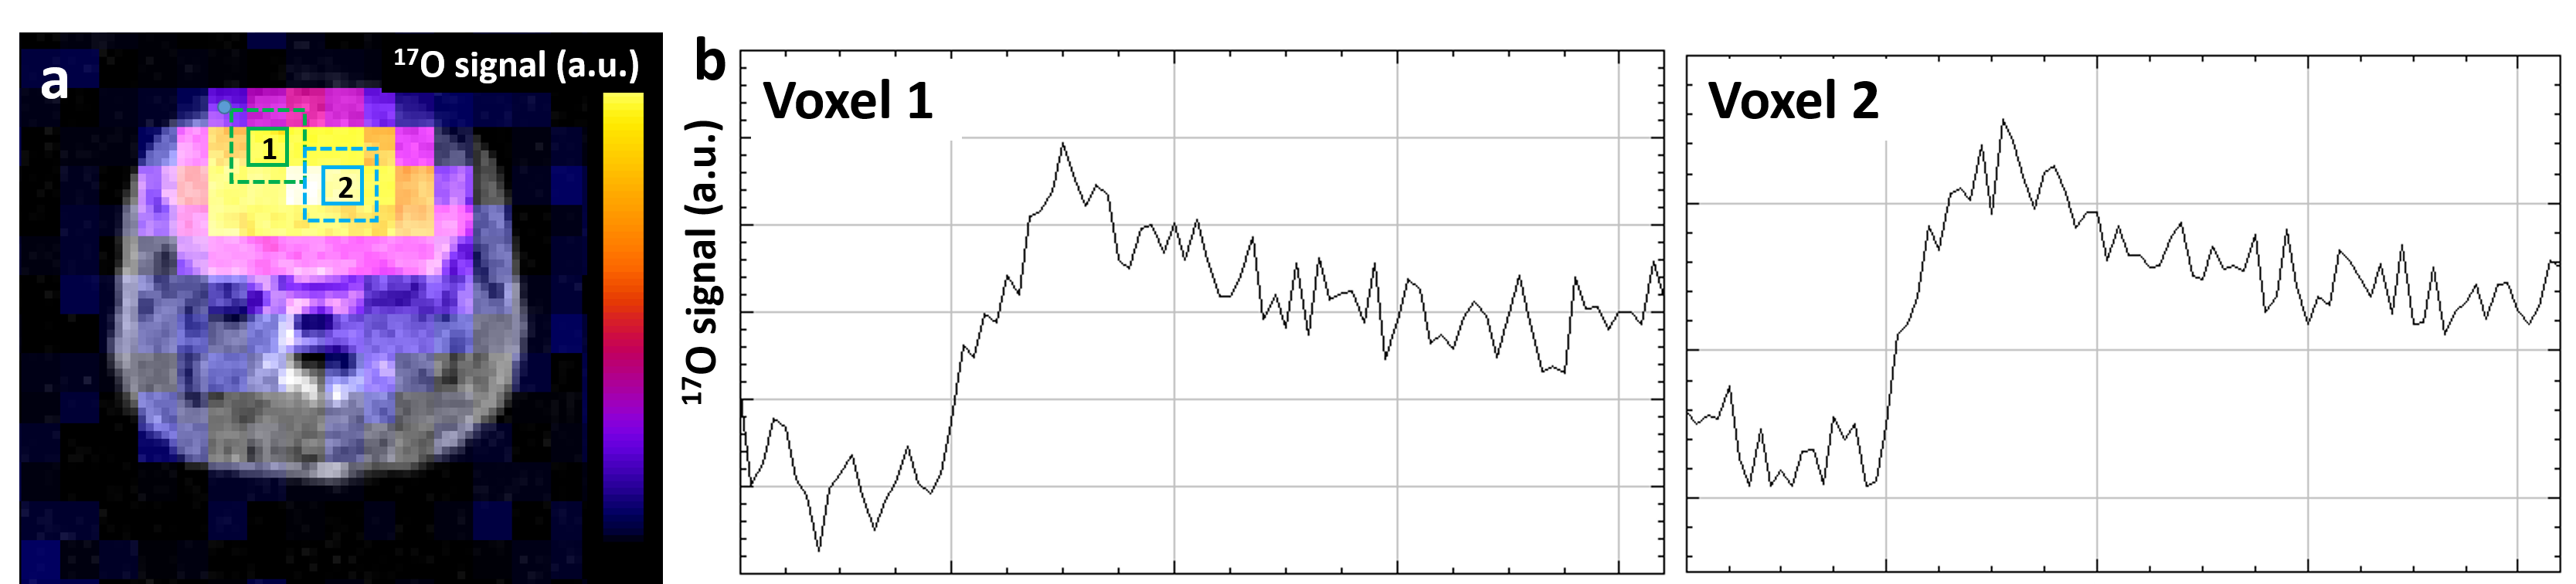
Figure 4: CMRO2 can be measured in individual voxels.
(a) Example of 17O-ZTE image co-registered with the corresponding axial anatomical view. (b) Plots (1) and (2) show individual time-course from two separate voxels as outlined and labeled on image (a).