0480
Comparison of methods for measuring cerebral mitochondrial function with magnetisation transfer 31P-MRS
Sam Keaveney1, Ross Maxwell1, Maelene Lohézic2, Rolf Schulte3, Ralph Noeske4, and Andrew Blamire1
1Newcastle Magnetic Resonance Centre, Newcastle University, Newcastle upon Tyne, United Kingdom, 2GE Healthcare, Manchester, United Kingdom, 3GE Healthcare, Munich, Germany, 4GE Healthcare, Berlin, Germany
1Newcastle Magnetic Resonance Centre, Newcastle University, Newcastle upon Tyne, United Kingdom, 2GE Healthcare, Manchester, United Kingdom, 3GE Healthcare, Munich, Germany, 4GE Healthcare, Berlin, Germany
Synopsis
Mitochondrial function in the brain can be measured with magnetisation transfer 31P-MRS. The conventional approach to magnetisation transfer incurs lengthy acquisition times, limiting the available spatial information. An accelerated approach, based on kinetic modelling, allows the technique to be extended to a multi-voxel implementation. Both approaches were applied in a group of healthy subjects to measure the rate of the creatine kinase reaction. There was good agreement between the reaction rates measured with the two methods in equivalently positioned voxels, validating the use of the accelerated approach to provide greater spatial resolution in future patient studies.
Introduction
A deficit in mitochondrial function has been implicated in neurodegeneration and in healthy ageing1. Regional posterior cortical hypometabolism, observed with FDG-PET, is a characteristic feature of Alzheimer’s disease and regions of hypometabolism may reflect mitochondrial dysfunction. The rate of mitochondrial ATP production through the creatine kinase (CK) reaction, k1, can be measured with magnetisation transfer (MT) 31P-MRS by saturating γ-ATP and measuring the resulting reduction in PCr signal. In this work, two methods for measuring k1 with 31P-MT were applied and compared in healthy subjects.The conventional approach to MT is the progressive saturation transfer (PST) method2, in which PCr signal reduction is measured with respect to the duration of γ-ATP saturation (tsat). The PST method is restricted to single voxel localisation, or reliant on intrinsic surface coil localisation, because of the lengthy acquisition time. A faster MT approach is required in order to extend the technique to a multi-voxel implementation. When combined with simultaneous FDG-PET, this potentially facilitates the comparison of mitochondrial function in regions of normal and abnormal glucose metabolism. The nominal T1 (T1nom) method3 is an accelerated approach that uses kinetic modelling to estimate the T1nom of PCr under partially relaxed conditions. This is used to calculate k1 with just two measurements: PCr signal with and without saturation of γ-ATP. Before it can be applied in patient groups, the T1nom approach must first be validated through comparison with the more established PST method.
Methods
Both approaches were applied in a group of four healthy volunteers, mean age = 30.5 ± 3.6 years, on a 3 T scanner (Signa PET/MR, GE Healthcare, Waukesha, WI) with a dual-tuned 31P-1H head coil (Rapid Biomedical, Rimpar, Germany). Frequency-selective saturation was achieved with a BISTRO saturation scheme4. The PST method was applied with ISIS single voxel localisation5, voxel volume = 64 cm3, TR = 10 s, and NSA = 3. The voxel was positioned in the posterior parietal cortex. Spectra were acquired with saturation applied at the frequency of γ-ATP with six tsat values ranging from 0.0 to 4.9 s. The integral of the PCr peak was quantified using jMRUI and AMARES. The ratio of PCr signal with saturation (S(tsat)) to PCr signal without saturation (S0) was fit against tsat to a mono-exponential decay2 (Eq. 1) in Matlab in order to calculate k1.$$ \text{Eq.1:} \frac{S(t_{sat})}{S_{0}}=\frac{k_{1}}{(k_{1}+T_{1,PCr}^{-1})}exp(-(k_{1}+T_{1,PCr}^{-1})t_{sat})+\frac{1}{(k_{1} T_{1,PCr}+1)}$$
The T1nom method was implemented with an 8 x 8 2D CSI matrix, axial slice thickness = 4 cm, nominal voxel volume = 64 cm3, TR = 3 s, and FA = 72°. Spectra were acquired with and without saturation of γ-ATP, with tsat = 1.7 s. Variable k-space weighting was used to maximise SNR while maintaining similar total acquisition time to the PST method. The Bloch-McConnell equations were used to simulate the relationship between S0 / S(tsat= 1.7 s) and k1. The gradient and intercept of the line obtained by linear regression of this relationship are estimates of T1nom and the constant β respectively3. These simulated values were then used along with the measured ratio S0 / S(tsat= 1.7 s) to calculate k1 for each voxel using the relationship shown in Eq. 2.
$$\text{Eq.2:} \frac{S_{0}}{S(t_{sat} = 1.7 s)}=k_{1}T_{1nom}+β$$
Total acquisition time was 28 min 0 s and 26 min 6 s for the PST and T1nom methods respectively.
Results
Representative in vivo spectra collected using the PST and T1nom method are shown in Fig. 1 and Fig. 2 respectively. For the PST method, PCr signal ratio was fit to Eq. 1, as shown in Fig. 3, calculating a mean k1 of 0.225 s-1 (std. = 0.016 s-1). For the T1nom method, the simulated correction parameters were β = 0.97 ± 0.08 and T1nom = 2.46 s ± 0.27 s. SNR was acceptable (>10) in nine voxels of the CSI matrix. Across those nine voxels, mean k1 was 0.211 s-1 (std. = 0.059 s-1). In the voxel positioned approximately equivalently to the voxel in the PST approach, mean k1 was 0.218 s-1 (std. = 0.006 s-1). For k1 measured in the equivalent voxel, Bland-Altman analysis determined a mean bias of + 0.007 s-1 (std. = 0.016 s-1) for the PST method (Fig. 4). A Wilcoxon signed-ranks test indicated that there was not a statistically significant difference between values measured with the two approaches (Z = -0.730, p = 0.625).Discussion
Both approaches measured CK rates that are in reasonable agreement with values reported in the literature for healthy subjects6. For equivalently positioned voxels in the posterior parietal cortex, there was not a statistically significant difference between the reaction rates measured with each method. This result indicates that the T1nom method can be used to measure k1 values that are in good agreement with those measured using the PST approach.Conclusion
Cerebral mitochondrial function in healthy subjects can be measured using the accelerated T1nom method. This makes it possible to compare measurements in different regions of the brain within a similar total scan time as the single voxel PST implementation. The T1nom method can be combined with simultaneous FDG-PET and used to investigate the relationship between mitochondrial function and glucose metabolism across the brain in patients with neurodegeneration.Acknowledgements
Sam Keaveney's PhD studentship is funded by GE Healthcare.References
- Grimm A, Friedland K, Eckert A. Mitochondrial dysfunction: the missing link between aging and sporadic Alzheimer’s disease. Biogerontology. 2016;17(2):281-96.
- Chen C, Stephenson MC, Peters A, Morris PG, Francis ST, Gowland PA. 31P magnetization transfer magnetic resonance spectroscopy: Assessing the activation induced change in cerebral ATP metabolic rates at 3 T. Magnetic resonance in medicine. 2018;79(1):22-30.
- Xiong Q, Du F, Zhu X, Zhang P, Suntharalingam P, Ippolito J, et al. ATP production rate via creatine kinase or ATP synthase in vivo: a novel superfast magnetization saturation transfer method. Circulation research. 2011;108(6):653-63.
- Luo Y, De Graaf R, DelaBarre L, Tannus A, Garwood M. BISTRO: an outer‐volume suppression method that tolerates RF field inhomogeneity. Magnetic resonance in medicine. 2001;45(6):1095-102.
- Ordidge RJ, Connelly A, Lohman JA. Image-selected in vivo spectroscopy (ISIS). A new technique for spatially selective NMR spectroscopy. Journal of Magnetic Resonance (1969). 1986;66(2):283-94.
- Du F, Zhu XH, Qiao H, Zhang X, Chen W. Efficient in vivo 31P magnetization transfer approach for noninvasively determining multiple kinetic parameters and metabolic fluxes of ATP metabolism in the human brain. Magnetic resonance in medicine. 2007;57(1):103-14.
Figures
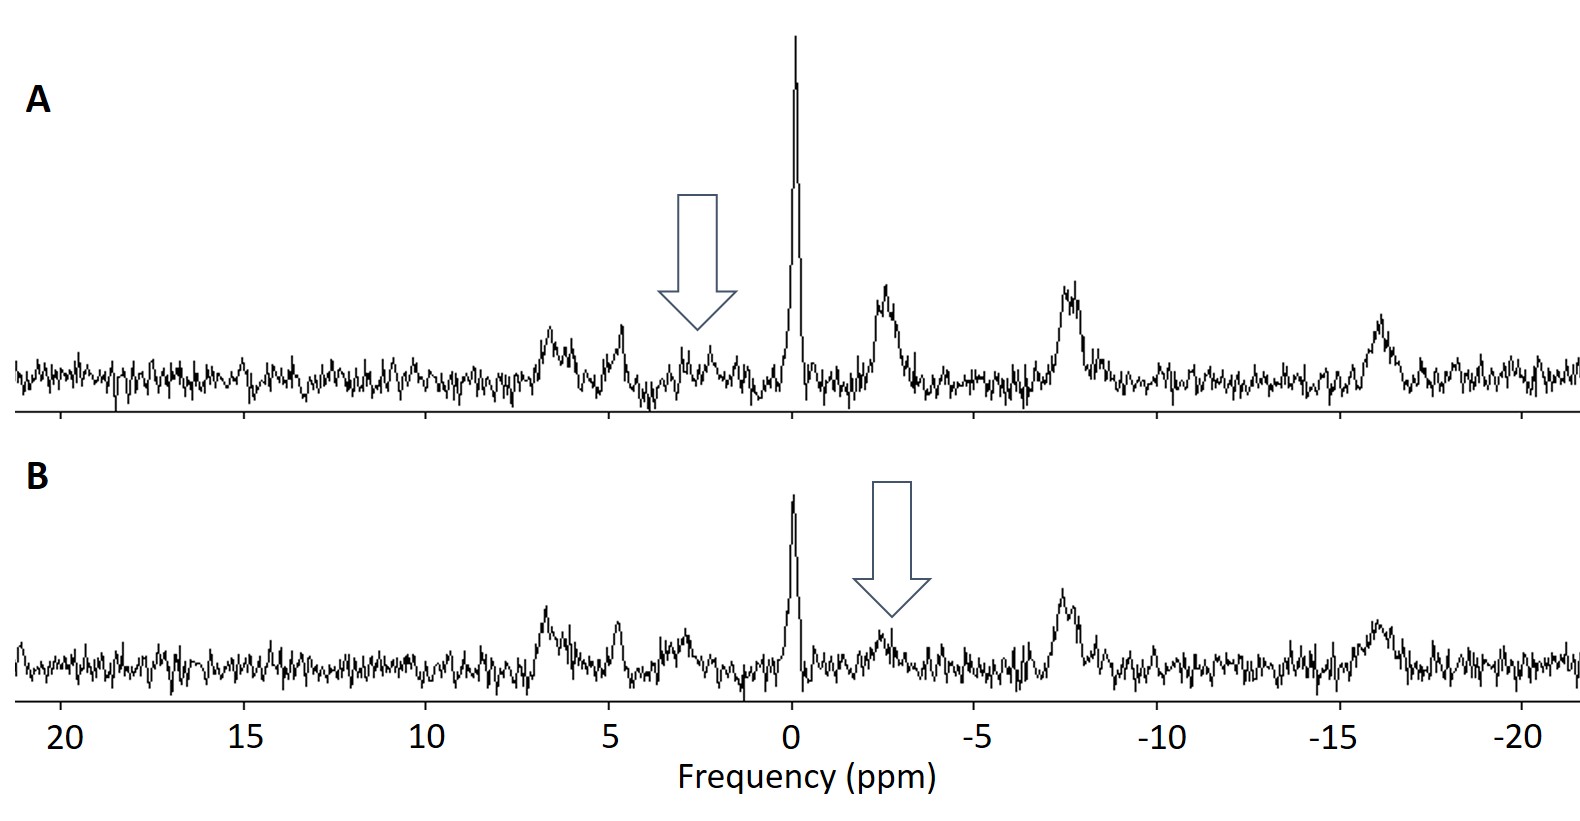
Fig. 1: Example spectra from the PST single-voxel
approach with arrows indicating the application of saturation. A: 1.7 s of saturation is applied at a
frequency offset of + 130 Hz. As the saturation profile is symmetric, the
degree of direct saturation of PCr in this acquisition is assumed to be equal
to the inadvertent saturation of PCr when γ-ATP is saturated. B: 1.7 s of saturation is applied at a
frequency offset of – 130 Hz, saturating γ-ATP and causing a reduction
in PCr signal through the MT effect.
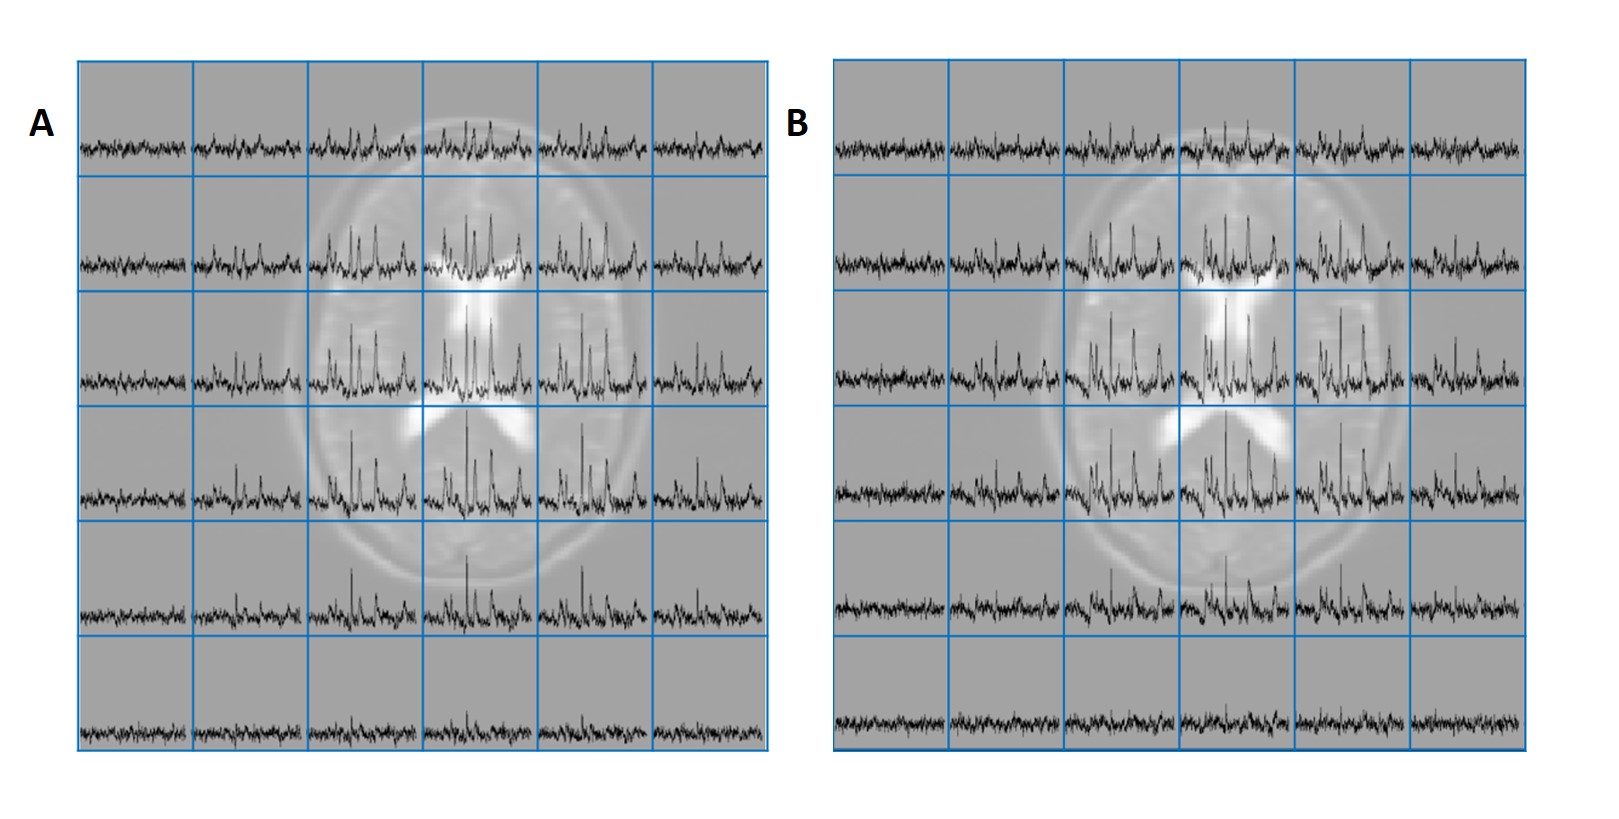
Fig. 2: Example spectra from the T1nom
CSI approach. The central 6 x 6 grid of voxels is shown, excluding the outer
ring. A: 1.7 s of saturation is
applied at a frequency offset of + 130 Hz to control for direct saturation of
PCr. B: 1.7 s of saturation is
applied at a frequency offset of – 130 Hz, saturating γ-ATP and causing a reduction
in PCr signal through the MT effect.
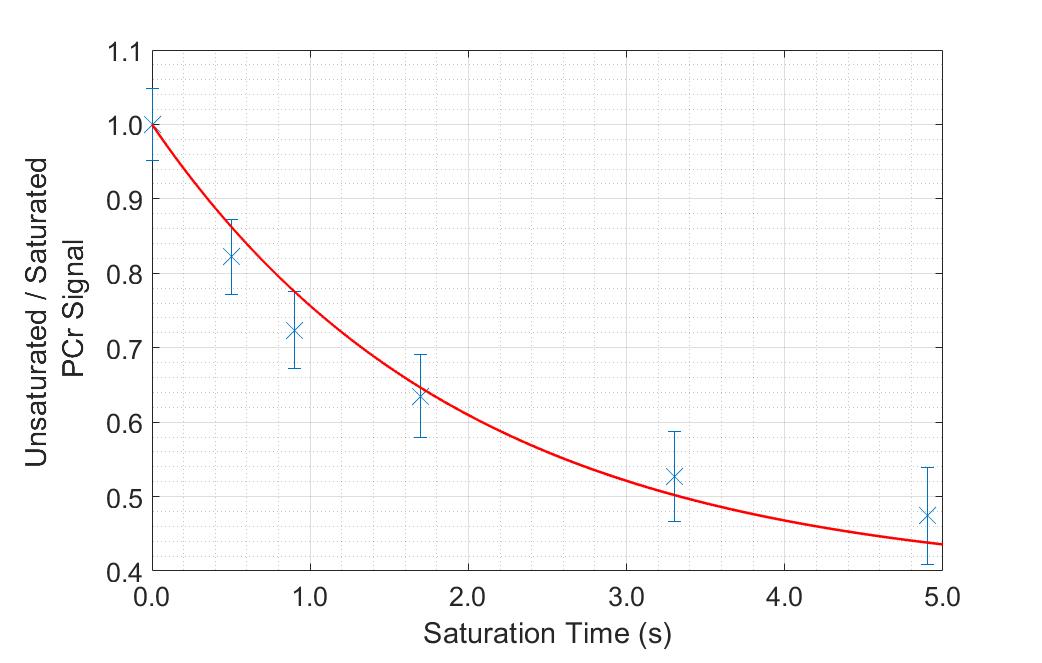
Fig. 3: The
ratio of PCr signal with saturation of γ-ATP
to PCr signal without saturation of γ-ATP,
with respect to the duration of saturation (tsat), as measured in
the PST experiment. The data points are fit to Eq. 1 in order to calculate k1.
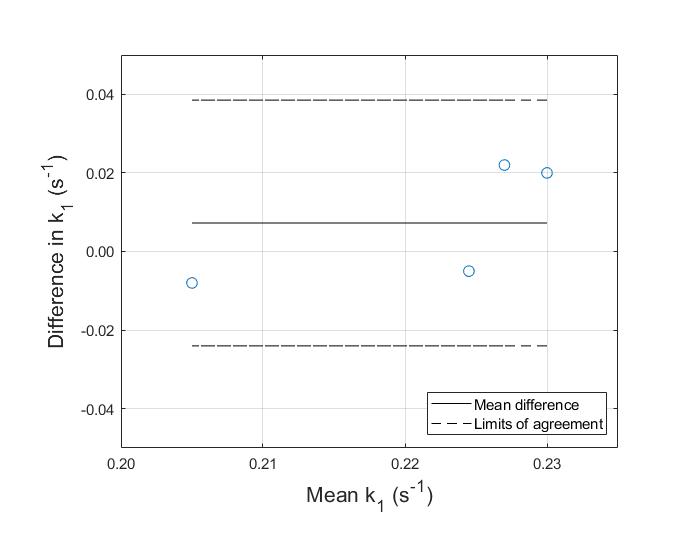
Fig. 4: Bland-Altman plot comparing the k1
values measured in equivalently positioned voxels with the PST and the T1nom
methods. The difference between k1 as measured with PST and k1
as measured with the T1nom method is plotted against the mean k1
for both methods for each subject. The limits of agreement are defined as: mean
±
1.96 std.