0478
Phosphorus metabolic images of the human brain at 9.4 T using Chemical Shift Imaging: Investigation of differences in grey and white matter tissue1Max Planck Institute for Biological Cybernetics, Tübingen, Germany, 2UT Southwestern Medical Center, Dallas, TX, United States
Synopsis
31P Magnetic Resonance Spectroscopic Imaging (MRSI) is a non-invasive method that can reveal information about the energy and phospholipid metabolism. In this work, we investigate the differences in signal amplitudes of different 31P metabolites between grey and white matter tissue in the human brain. We acquired highly resolved 31P MRSI data at an ultrahigh field strength B0 of 9.4 T from the brain of six healthy volunteers. For the quantification of the 31P MRSI data, different correction were applied to the signal amplitudes.
Purpose
To present 31P metabolic maps acquired at 9.4 T from the human brain of healthy volunteers and investigate differences between grey and white matter tissue.Introduction
Phosphorus magnetic resonance imaging (MRSI) can reveal important information about the energy and phospholipid metabolism as well as intracellular pH without an invasive intervention1. However, 31P MRSI has a relatively low signal sensitivity compared to 1H MRI/MRSI and a corresponding low spatial resolution. A way to address this problem is to go to a very high magnetic field B0. In this work, we present phosphorus metabolic maps acquired from the brain of healthy human volunteers at an ultrahigh field strength of 9.4 T with a nominal resolution of 0.59 ml which was not yet reported for 31P MRSI. Different signal corrections have been applied to be able to investigate differences in 31P signal amplitudes between grey and white tissue of the healthy human brain.Method
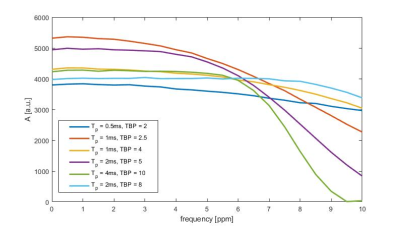
The data was acquired from a 9.4 T whole body MRT (Siemens Healthineers, Erlangen, Germany) using an in-house built double tuned 31P/1H array coil (8TxRx/2Rx for 31P, 10TxRx for 1H)2. Informed consent was obtained for all volunteer measurements. The data was acquired from six healthy volunteers.Prior to each in vivo measurement, a B1+ calibration was performed with a Bloch-Siegert shift based single voxel spectroscopy sequence (TAcq = 160 sec). For 31P MRSI, a 3D chemical shift imaging (CSI) sequence3 with a total measurement time of 74 min and the following parameters was used: FoV (180x200x180) mm3, grid size (28x30x13x512), TR = 250 ms, α = 25 deg, 16 averages, broadband sinc pulse excitation, Hamming weighted acquisition, acquisition bandwidth = 5 kHz and nuclear Overhauser enhancement (nOe) with rectangular saturation pulses4. The effective voxel size is approximately 3.7 ml. The sinc pulse was optimized in a separated phantom measurement. Different time bandwidth products (TBP) and pulse durations (Tp) were tested for the sinc shaped excitation pulse to find the optimal pulse.
The analysis of the data was performed in Matlab using a self-implemented fitting routine based on the AMARES algorithm5 that considers Voigt line shapes. A Tucker tensor decomposition of the spectrospatial data was used for noise reduction6,7. Prior to denoising, corrections for B0 and phase shifts were performed based on a fit of the PCr (phosphocreatine) resonance.
Quantification results were corrected for T1 relaxation and nOe enhancement factors based on values taken from earlier publications4,8. To correct for the sensitivity profile of the coil, the measured signal amplitudes are ratios to the summed signal over all resonance. The corresponding summed signal reference map was smoothed applying a Low Rank approximation9.
Results and Discussion
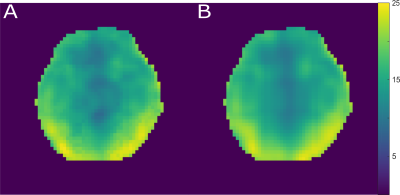
Fig. 1 shows the measured excitation profiles of the tested sinc shaped pulses measured in a phantom measurement. Among the detectable resonances, α-adenosine triphosphate (α-ATP) has the largest chemical shift with -7.52 ppm1. To achieve a homogeneous excitation profile over a bandwidth of ± 7.52 ppm, a sinc shaped pulse with Tp = 2 ms and TBP = 8 was used in our 3D 31P MRSI implementation.Fig. 2 shows the sum over all detected metabolites and the corresponding low rank smoothed image of volunteer #1. The later was used for normalization of the spectra and resonance amplitudes to correct for the sensitivity profile of the coil. The underlying assumption is that the total phosphate pool is constant1.
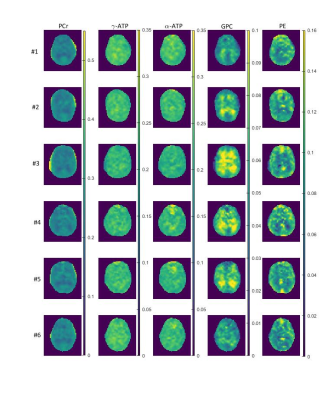
Fig. 3 shows the acquired images of phosphocreatine (PCr), α/γ-adenosine triphosphate (α/γ-ATP), glyceryl-3-phosphorylcholine (GPC) and phosphorylethanolamine (PE) for all six volunteers as ratios to the summed signal.
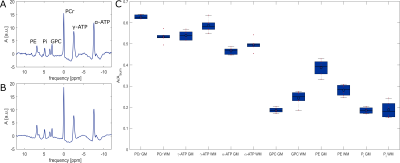
Fig. 4 shows the final result of the analysis. Shown is the spectrum summed over a region with high grey matter content as well as a region with high white matter content for volunteer #1 as well as the comparison of grey and white matter dominated areas for all six volunteers. The summed spectra were normalized to the number of voxels included in the area as well as the summed phosphate signal as shown in Fig. 2. The final amplitudes of the phosphate metabolites shown in Fig. 4 were estimated from the summed spectra and corrected for nOe enhancement and T1 saturation.
As only six volunteers could be evaluated so far, a profound statistical analysis is not yet possible. However, findings from former publications10,11 indicated a lower signal of PME (phosphomonoester, e.g. PE) and PCr in white matter whereas ATP and PDE (phosphodiester, e.g. GPC) showed a higher signal in white matter. This findings are very consistent with the presented results.
In the future, a further analysis of these differences is planned with a higher number of volunteers. The aim is to probe the stability of 31P MRSI in detecting signal differences between different tissue types to move towards clinical application.
Conclusion
We successfully acquired 31P metabolic maps with a high nominal spatial resolution of 0.59 ml which has not been achieved before. Further, differences between grey and white matter signal amplitudes could be presented for different 31P metabolites after correcting for coil sensitivity, nOe enhancement and T1 saturation. It could be shown that the results are consistent with earlier publications.Acknowledgements
Funding by the European Union (ERC Starting Grant, SYNAPLAST MR, Grant Number: 679927) and by the Cancer Prevention and Research Institute of Texas (CPRIT) (Grant Number: RR180056) is gratefully acknowledged.References
[1] de Graaf RA. In Vivo NMR Spectroscopy – 2nd Edition: Principles and Techniques. WILEY 2007. ISBN: 978-0-470-02670-0
[2] Avdievich N, Ruhm L, Dorst J, Henning A. Double-Tuned 31P/1H Human Head Array with High Performance at Both Frequencies for Chemical Shift Spectroscopic Imaging (CSI) at 9.4 T. In: Proceed. Of the ISMRM (Montreal) 2019. Abstract nr. 0433.
[3] 31P CSI of the human brain in healthy subjects and tumor patients at 9.4 T with a three-layered multi-nuclear coil: initial results. Magn Reson Mater Phys 2016; 29: 579 – 589
[4] Ruhm L, Dorst J, Avdievich N, Henning A. High-Resolved nOe-Enhanced 31P MRSI of the Human Brain at 9.4T. In: ISMRM Workshop on Ultrahigh Field Magnetic Resonance: Technological Advances, Translational Research Promises & Clinical Applications (2019). Dubrovnik, Croatia.
[5] Vanhamme L, van den Boogaart A, Van Huffel S. Improved method for accurate and efficient quantification of MRS data with use of prior knowledge. J Magn Reson 1997; 129(1): 35 – 43
[6] Brender JR, Kishimoto S, Merkle H, Reed G, Hurd RE, Chen AP, Ardenkjaer-Larsen JH, Munasinghe J, Saito K, Seki T, Oshima N, Yamamoto K, Choyke PL, Mitchell J, Krishna MC. Dynamic Imaging of Glucose and Lactate Metabolism by 13C-MRS without Hyperpolarization. Scientific Reports 2019; 9:3410
[7] Tensor Toolbox version 3.1 by Bader BW, Kolda TG, Acar E, Dunlavy DM et al. Copyright 2019, Sandia National Laboratories
[8] Raju S, Scheffler K, Pohmann R. T1 values of phosphorus metabolites in the human visual cortex at 9.4 T. Magnetic Resonance Material in Physics, Biology and Medicine, 30 (Supplement 1). S243 – S244. 34th Annual Scientific Meeting of the European Society for Magnetic Resonance in Medicine and Biology (ESMRM 2017), Barcelona, Spain.
[9] Nguyen HM, Peng X, Do MN, Liang ZP. Denoising MR Spectroscopic Imaging Data With Low –Rank Approximations. IEEE Trans Biomed Eng 2013; 60(1): 78 – 89
[10] Dudley J, Chu W, Fugate E, and Lee J. Tissue dependent metabolism in the human brain suggested by quantitative phosphorus-31 MRSI. Journal of Spectroscopy and Dynamics 2014; 4(19)
[11] Hetherington H, Spencer JVDD, and Pan J. Quantitative 31P Spectroscopic Imaging of the Human Brain at 4 Tesla: Assessment of Gray and White Matter Differences of Phosphorcreatine and ATP. Magentic Resonancein Medicine 2001; 45:46–52
Figures


