0477
Detection of Multiple Nucleotide Sugars Including Uridine Diphosphate Hexoses and N-Acetyl Hexosamines in Human Brain by 31P MRS at 7T1Advanced Imaging Research Center, UT Southwestern Medical Center, Dallas, TX, United States, 2Department of Radiology, UT Southwestern Medical Center, Dallas, TX, United States, 3VA North Texas Health Care System, Dallas, TX, United States, 4Department of Chemistry, University of Texas at Dallas, Richardson, TX, United States
Synopsis
A variety of nucleotide sugars (NS) are required for glycosylation of proteins and lipids to enhance and diversify cellular functions. The current 7T 31P MRS study, for the first time, reports the detection of four different NS species in human brain in vivo. They are tentatively assigned to UDP-glucose, UDP-galactose, UDP-N-acetylglucosamine, and UDP-N-acetylgalactosamine, collectively denoted as UDP(G). These UDP(G) species are responsible for the observation of a “quartet-like” signal at -9.8 ppm, which cannot be explained by the presence of only a single UDP(G) species such as UDP-glucose (as expected to be a simple doublet).
INTRODUCTION
A variety of nucleotide sugars (NS) are required for glycosylation of proteins and lipids to enhance and diversify cellular functions such as cell communication, cell recognition and cell immune responses.1,2 Studies suggest that variations in NS concentrations may influence the dynamics and diversity of glycosylation, and an aberrant glycosylation may lead to immune-related diseases such as rheumatoid, autoimmune disease, Wiskott-Aldrich syndrome, cancer and infections.3,4 However, at typically low concentration, NS detection poses a great challenge to MRS for quantitative analysis of NS composition in human tissues in vivo. Using 7T 31P MRS, it has been reported that uridine diphosphate glucose (UDP-Glc) can be measured in human brain by a small but characteristic signal at -9.8 ppm.5 This assignment assumes that the -9.8 ppm signal is a single doublet. However, the newly acquired high SNR data from our lab reveal a more complex pattern for the -9.8 ppm signal, suggesting co-existence of multiple NS species in human brain. A lineshape data analysis indicates that the -9.8 ppm signal is contributed by four major NS species including UDP hexoses and N-acetyl hexosamines. Although the presence of these two types of NS in animal tissue extracts has been reported previously,6 to the best of our knowledge, this is the first report of observation of UDP N-acetyl hexamine species in human brain in vivo.METHODS
Seven healthy subjects aged 31 ± 5 yr participated in the study with informed written consent under a local IRB-approved protocol. Brain 31P spectra were acquired in a 7T MRI scanner (Achieva, Philips Healthcare) using a half-cylinder-shaped partial volume RF coil positioned under the brain posterior region. Time-domain FID signals were collected with a pulse-acquire sequence in 16 sequential blocks each consisting of 64 acquisition averages at constant TR of 5 s, and B1 = 59 μT. Second order 1H-based automatic volume shimming was applied prior to 31P spectral acquisitions. The average linewidth of PCr was 11.5 ± 0.5 Hz (n = 7 subjects). The FID signals were post-processed by zero-filling, apodization, Fourier transformation, and phasing. Spectra from different data blocks were aligned at PCr (0 ppm) and summed for data analysis, which included baseline correction and lineshape fitting of the NAD(H) and UDP(G) 31P signals in the chemical shift region between -7.5 and -10.5 ppm. The lineshape fitting assumed a singlet for NADH, a AB-quartet for NAD+,7 and two weekly-coupled doublets for each UDP(G) species. The concentrations of UDP(G) and NAD(H) were referenced to α-ATP (3.0 mM).RESULTS and DISCUSSION
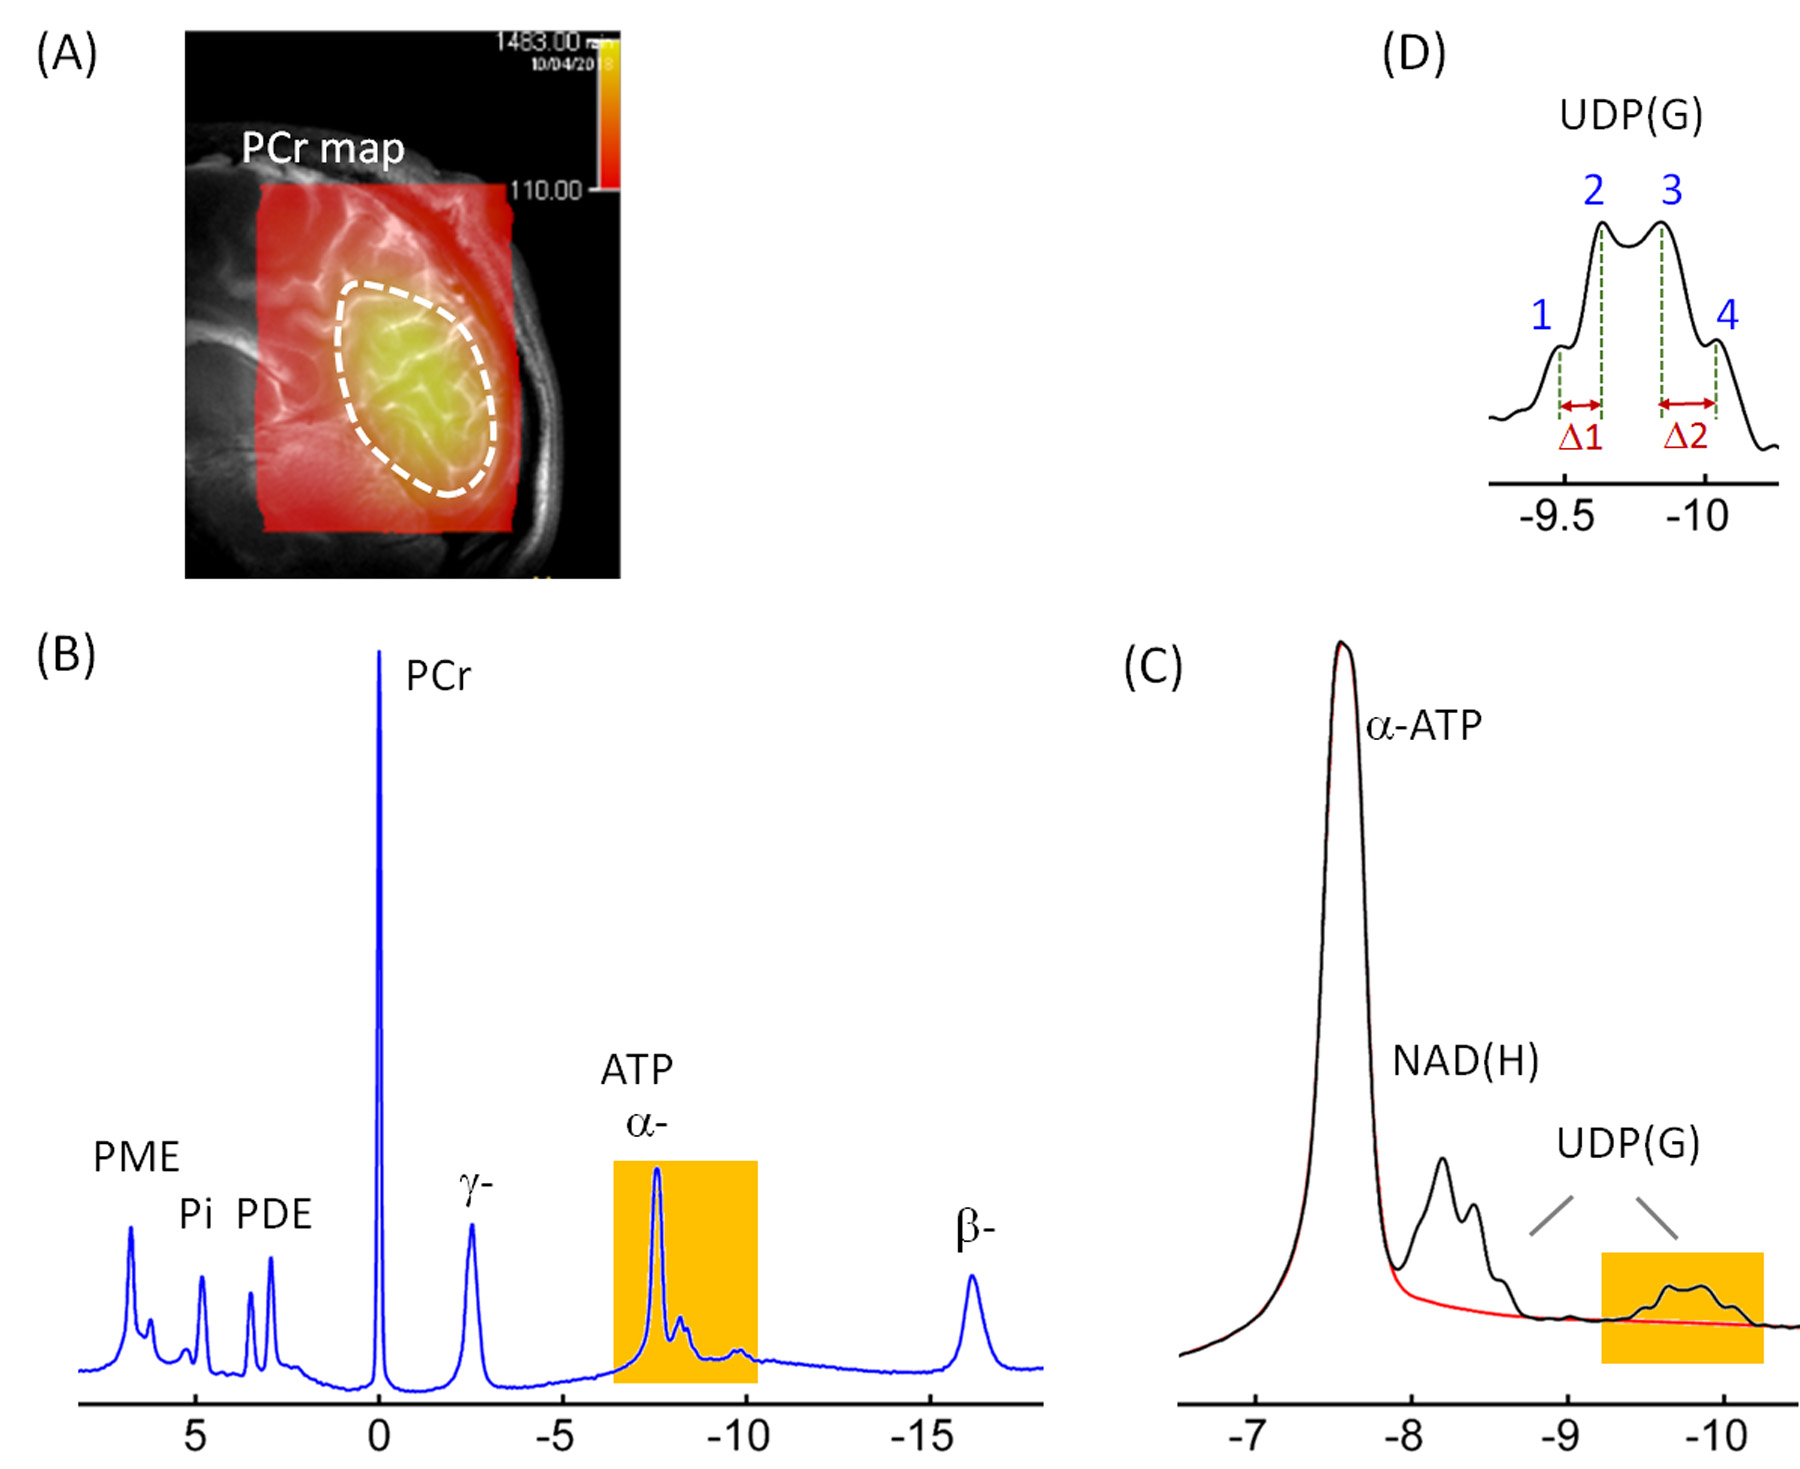
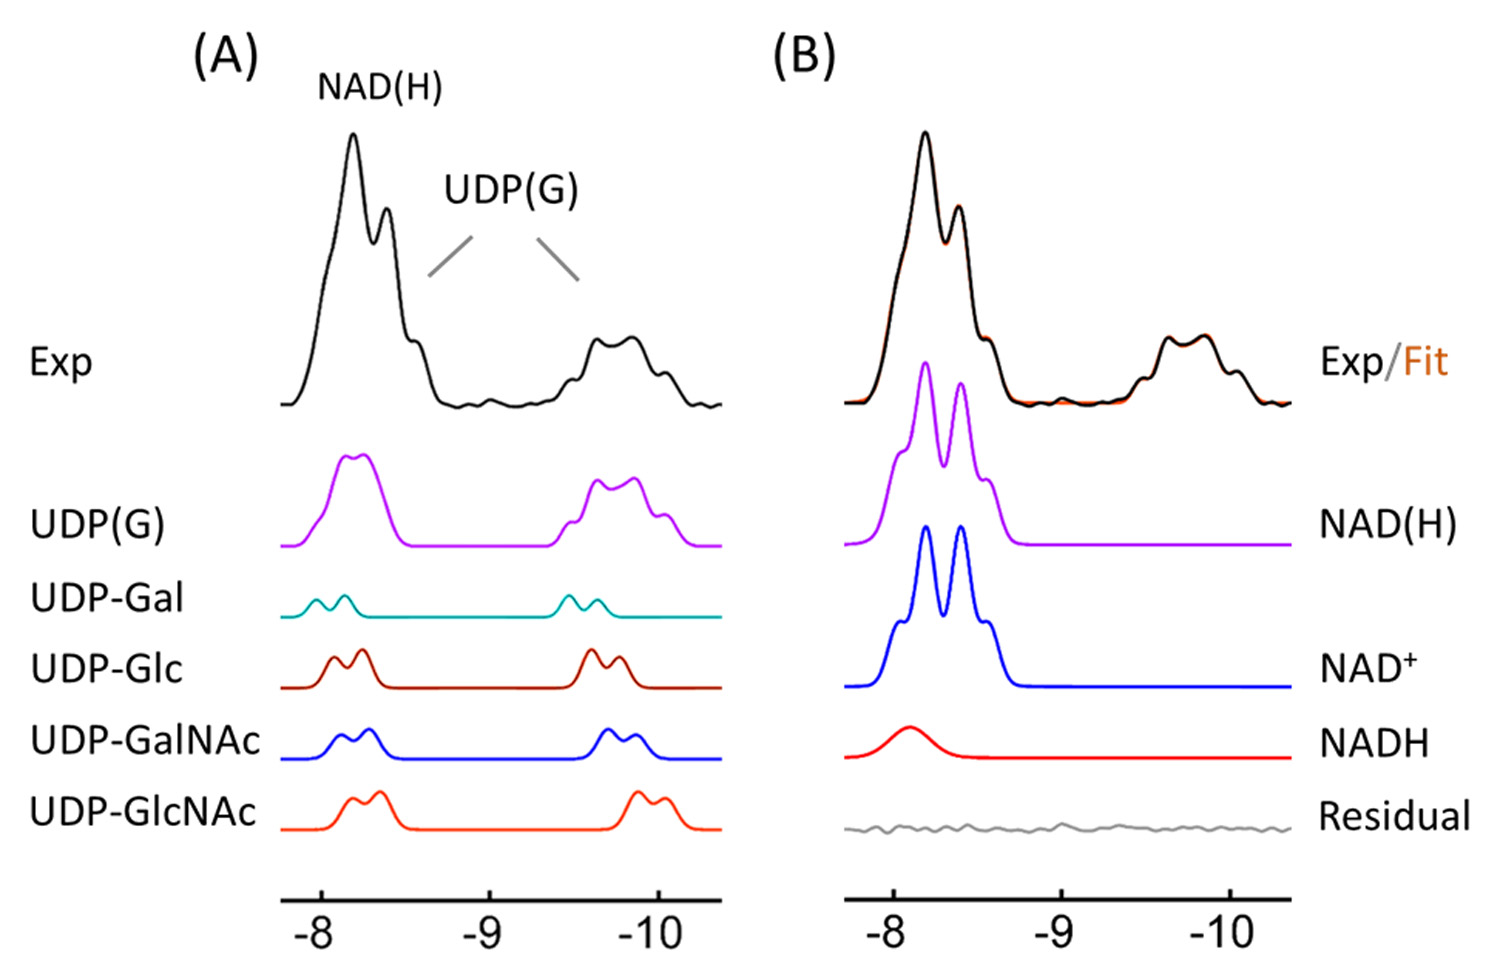
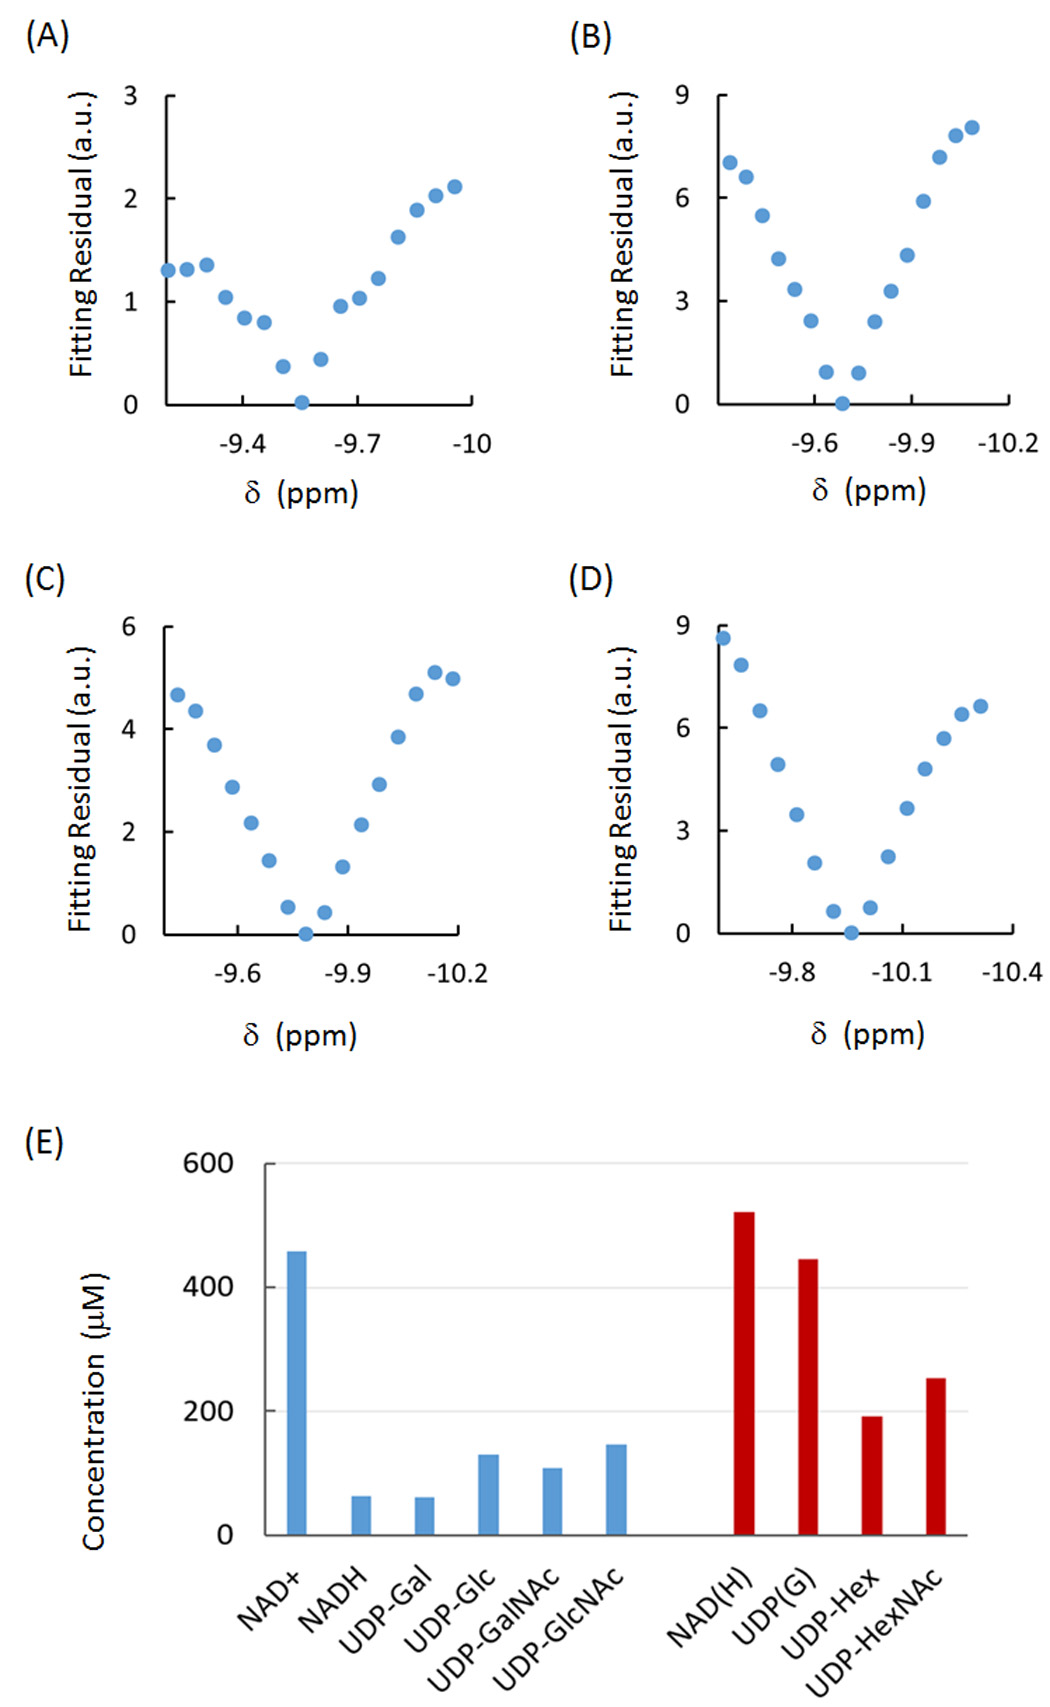
Figure 1 shows the summed brain 31P MR spectrum acquired at 7T, with a PCr overlay color map on a sagittal T2w imaging illustrating the sensitive area of the coil in the occipital parietal region. The characteristic signal at -9.8 ppm is attributed to UDP(G) phosphate group that is attached to a sugar moiety. This signal clearly appeared as a quartet-like multiplet, rather than a double as expected from a single NS species. Figure 2 shows the spectral fitting in the region between -7.5 and -10.5 ppm after correction for baseline and a-ATP contamination. The signal at -9.8 ppm was fitted by four doublets, collectively contributed from UDP-Glc, UDP-Gal, UDP-GlcNAc and UDP-GalNAc. Each of these UDP(G) species also contributed another doublet at ~-8.2 ppm, overlapping with the signal of NAD(H) (a combination of NAD+ and NADH). The fitting results are shown in Figure 3. The combined concentration of all UDPG species averaged 0.45 mM in seven young healthy subjects. In comparison, NAD(H) averaged 0.53 mM and ATP averaged 3.0 mM. There was a 2-fold variance among individual nucleotide sugars with glucose being more abundant than galactose: UDP-GlcNA (0.15 mM) versus UDP-GalNAc (0.11mM), and UDP-Glc (0.13 mM) versus UDP-Gal (0.06 mM), as compared to the distribution of nucleotides NAD+ (0.46 mM) and NADH (0.06). This finding is in consistent with the result of HPLC measurements from brain extracts in animal models.6CONCLUSION
This is the first report of detecting multiple nucleotide sugars containing UDP-based hexoses and N-acetyl hexoamines in human brain in vivo using 31P MRS. The capability of detecting these UDP(G) species in vivo may offer a valuable tool to understand the interaction between these detectable nucleotide sugars and the development of diseases, and to monitor response to treatment.Acknowledgements
This project was supported by the National Center for Research Resources and the National Institute of Biomedical Imaging and Bioengineering of the National Institutes of Health through P41EB015908, a grant from Clene Nanomedicine (CTA 201810-0025) and an internal UTSW-AIRC award FY18 IA0009.References
1. Reily C, Stewart TJ, Renfrow MB, Novak J. Glycosylation in health and disease. Nat Rev Nephrol. 2019;15(6):346–366.
2. Lipid glycosylation: a primer for histochemists and cell biologists. Histochem Cell Biol. 2017;147(2):175-198.
3. Ohtsubo K, Marth JD. Glycosylation in cellular mechanisms of health and disease. Cell. 2006;126(5):855-67.
4. Alavi A, Axford JS, Sweet and sour: the impact of sugars on disease, Rheumatology, 2008; 47(6):760–770.
5. de Graaf RA, De Feyter HM, Brown PB, Nixon TW, Rothman DL, Behar KL. Detection of cerebral NAD+ in humans at 7T. Magn Reson Med. 2017;78(3):828-835.
6 Oikari S, Venäläinen T, Tammi M. Borate-aided anion exchange high-performance liquid chromatography of uridine diphosphate-sugars in brain, heart, adipose and liver tissues. J Chromatogr A. 2014;1323:82-6.
7. Zhu XH, Lu M, Lee BY, Ugurbil K, Chen W. In vivo NAD assay reveals the intracellular NAD contents and redox state in healthy human brain and their age dependences. Proc Natl Acad Sci U S A. 2015;112(9):2876-81.
Figures