0476
Combining 1H MRS with deuterium labeled glucose: A new strategy to assess dynamics of neural metabolism in vivo1Radiology, University of Pennyslvania, Philadelphia, PA, United States, 2Neurology, University of Pennyslvania, Philadelphia, PA, United States, 3Research Branch, Qatar University, Doha, Qatar
Synopsis
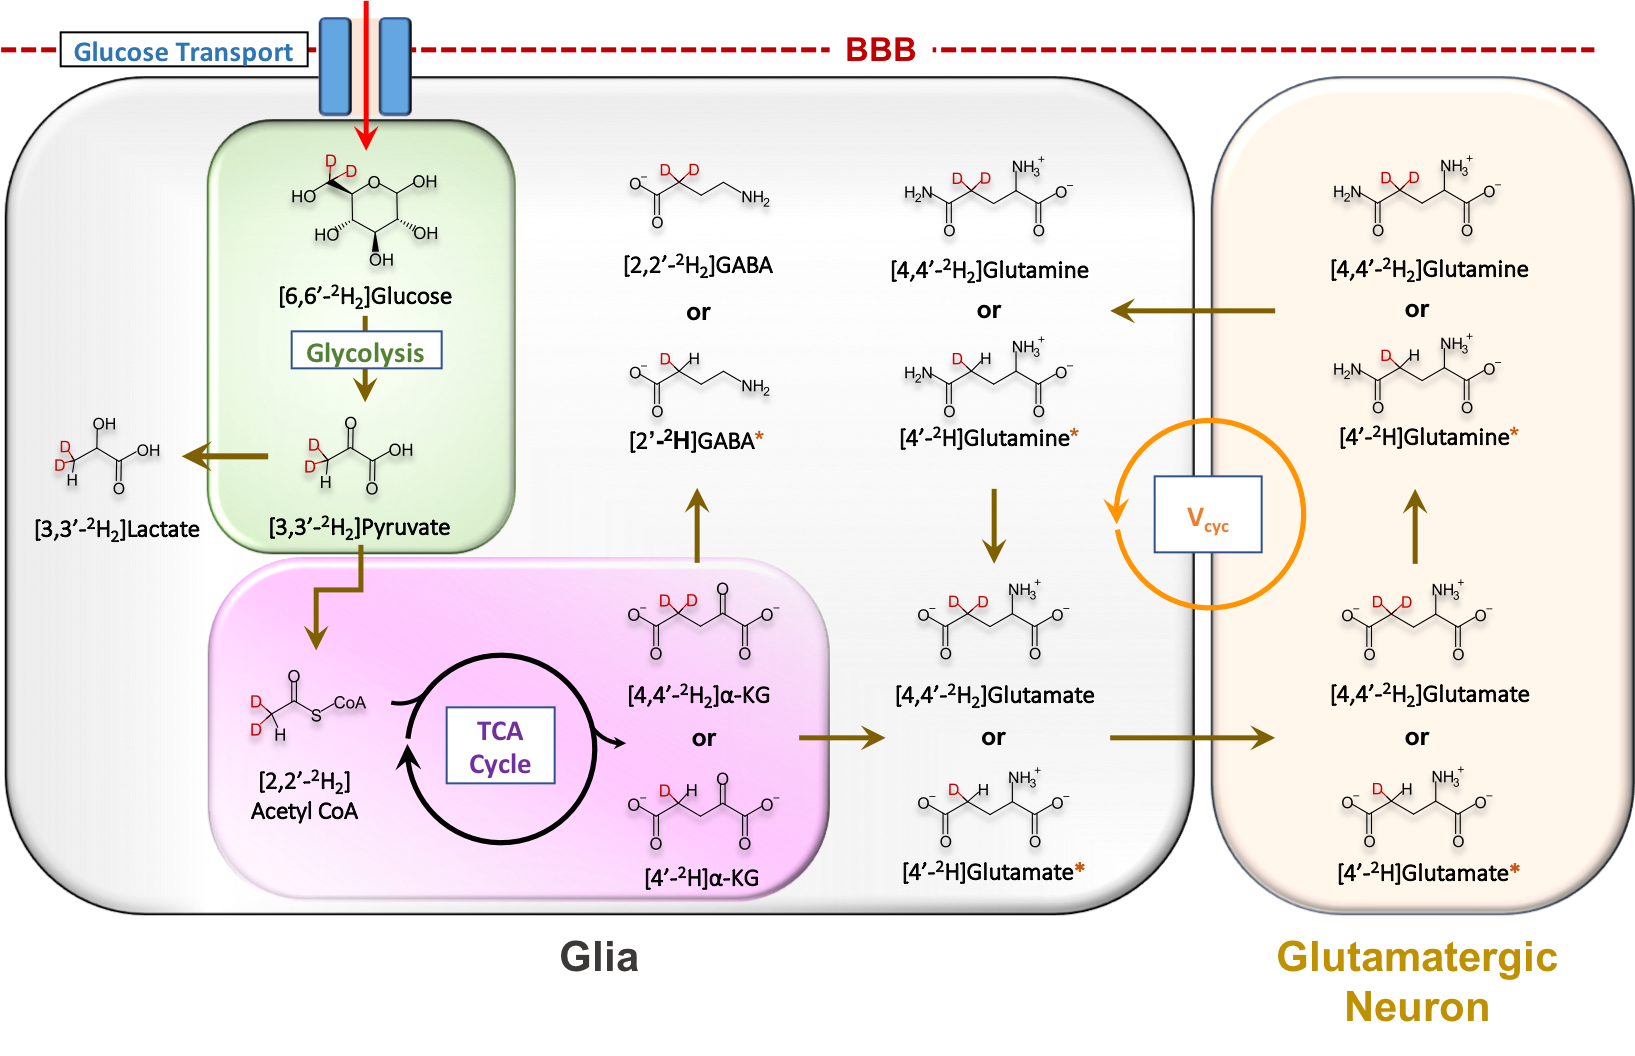
Proton magnetic resonance spectroscopy (1H MRS) is a powerful technique capable of detecting a range of endogenous metabolites, but with currently existing approaches does not enable tracking of metabolic fluxes and pathways. We report a new strategy which utilizes 1H MRS in conjunction with administration of deuterium (2H) labeled glucose to track downstream labeling of neural metabolites. Since 2H is invisible on 1H MRS, replacement of 1H with 2H leads to an overall reduction in 1H MRS signal for the corresponding metabolites. Therefore, this approach makes it possible to monitor neural metabolism using conventional and widely available 1H MRS methodologies.
Introduction
Cellular metabolism is a fundamental component of neural function and its dysregulation is linked to the initiation and progression of many neurological disorders1. Given this, there is need for non-invasive tools with the ability to probe metabolism in vivo. To date, 13C Magnetic resonance spectroscopy (13C MRS) combined with administration of 13C labeled substrates has been the primary method for studying neural metabolism2,3. In 13C MRS, administration of 13C labeled glucose can provide information on metabolic flux through glycolysis and the citric acid cycle by tracking the downstream labeling of metabolites including glutamate (Glu), glutamine (Gln), γ-aminobutyric acid (GABA) and lactate (Lac)3. Despite these advances, 13C MRS is still inherently limited by its low sensitivity and requirement for specialized hardware. Recently, there has been growing interest in the use of non-radioactive and non-toxic deuterium (2H) labeled substrates in conjunction with deuterium MRS (DMRS) to measure tissue metabolic dynamics4,5. Building on these advances, we report a new approach, exchanged label turnover quantitative measurement (ELOQUENT) MRS (eMRS), that captures the metabolic turnover of cellular metabolites by quantifying the metabolite signal reduction in proton MRS (1H MRS) due to replacement of 1H with 2H (Fig 1). Our findings highlight eMRS as a straightforward and sensitive approach for tracking neural metabolism in vivo, without the requirement for specialized hardware.Methods
eMRS experiments were conducted in seven 13-15 week old male CDF rats (220-250 g) and then repeated in a subset of animals (n=4) along with DMRS to compare kinetics of metabolite labeling. Chemical shift imaging (CSI) was also performed in a single animal to demonstrate the feasibility for metabolic imaging. All the MRI and MRS experiments were performed on a 9.4T, 30 cm horizontal bore magnet interfaced to a Bruker console using commercial radiofrequency coils. During imaging, animal body temperature was maintained at 37ºC and respiratory rate monitored throughout the experiment. Rats were injected with [6,6′-2H2]glucose (Cambridge Isotope Laboratories Inc, Tewksbury, MA) at a dose of 1.95 g/kg for a period up to 70 mins via an automated infusion pump and tail vein catheter using a bolus variable infusion protocol as described previously6. eMRS spectra were acquired from a voxel localized in the mid-brain (6.5× 6.5 × 2.5 mm3) using PRESS (TR/ TE=2500/16 ms, spectral width = 4 kHz, 90° pulse bandwidth = 5400 Hz, 180° pulse bandwidth = 2400 Hz, number of points = 4006, VAPOR water suppression, averages=128). For DMRS, spectra were acquired using a 15 mm surface coil and a non-localized pulse-acquire sequence (TR = 300 ms, flip angle = 20o, number of averages = 1000). CSI was performed with a PRESS based pulse sequence was used with the following parameters: TR/TE = 1600/16 ms, slice thickness = 3 mm, total FOV = 35 x 35 mm, excited FOV = 10 x 6.5 mm, matrix size = 12 x 12, number of points = 1024, spectral width = 10000 Hz, 90° pulse bandwidth = 14000 Hz, 180° pulse bandwidth = 9000 kHz, VAPOR water suppression, scan time = 20 min. Metabolite concentrations were estimated using LCModel7 (eMRS) and AMARES8 (DMRS) by normalizing to water reference spectra.Results
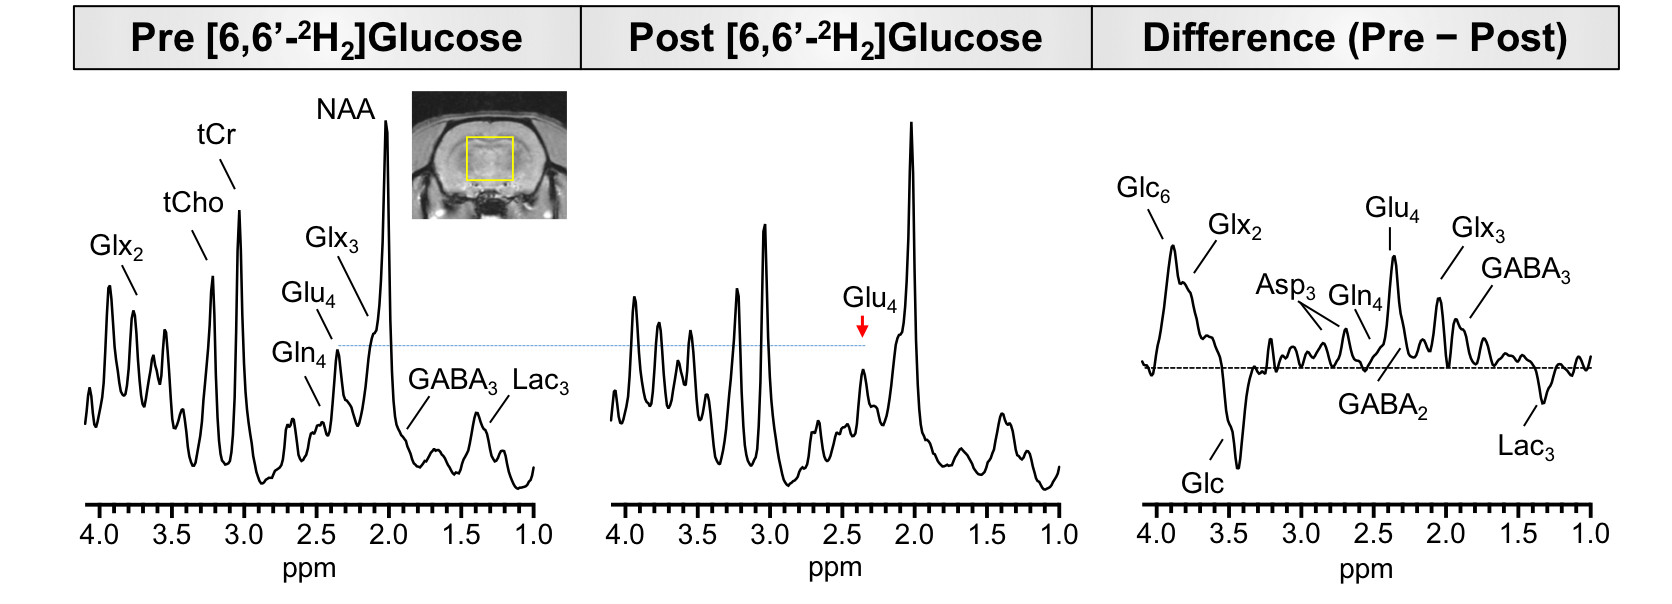
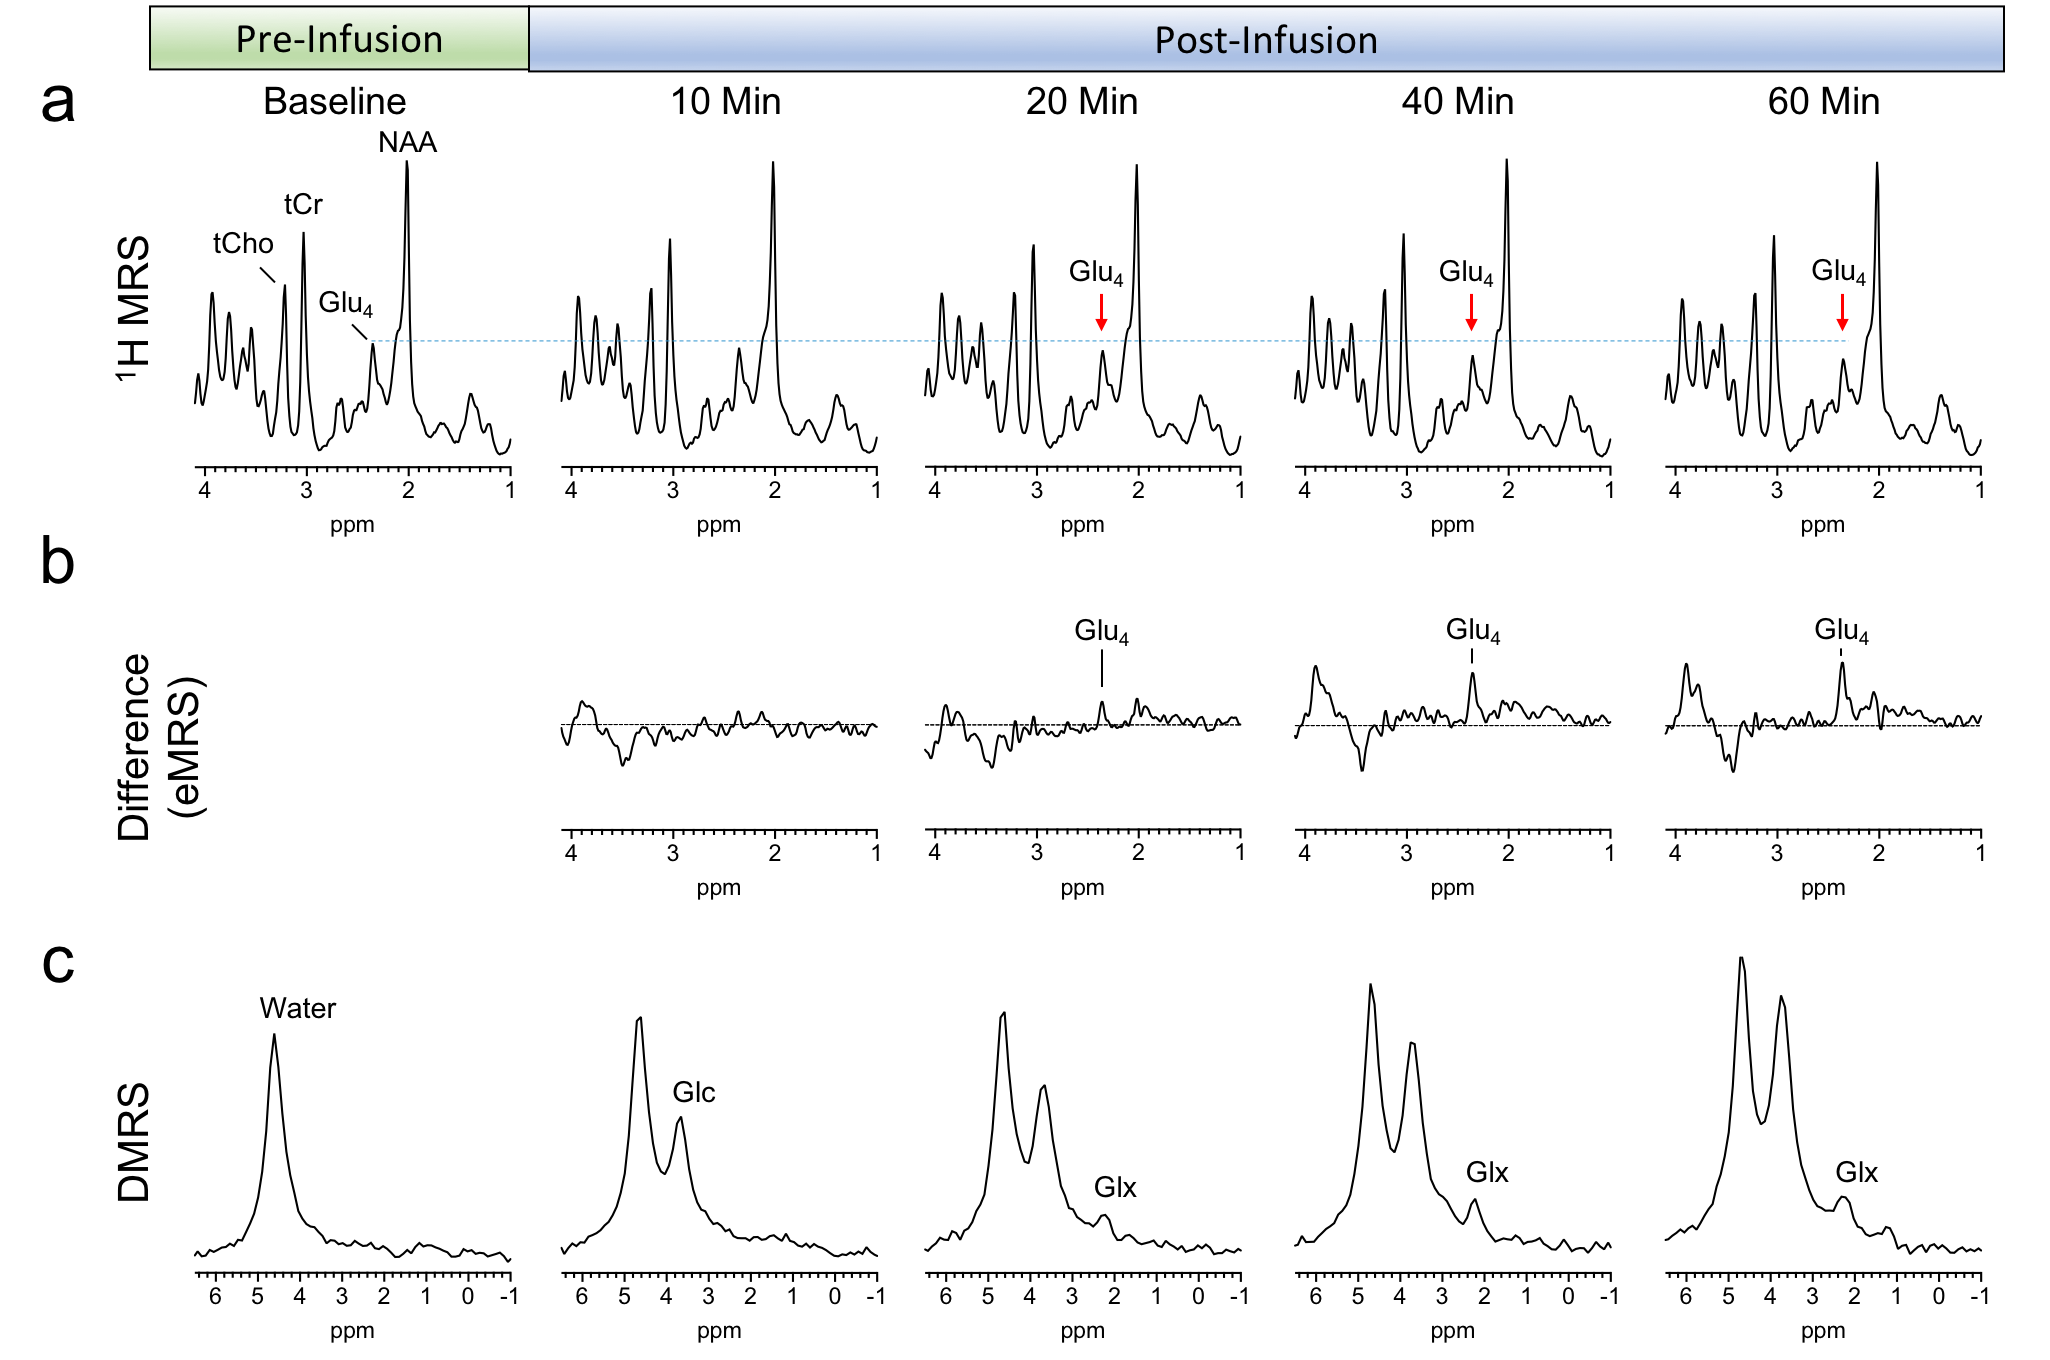
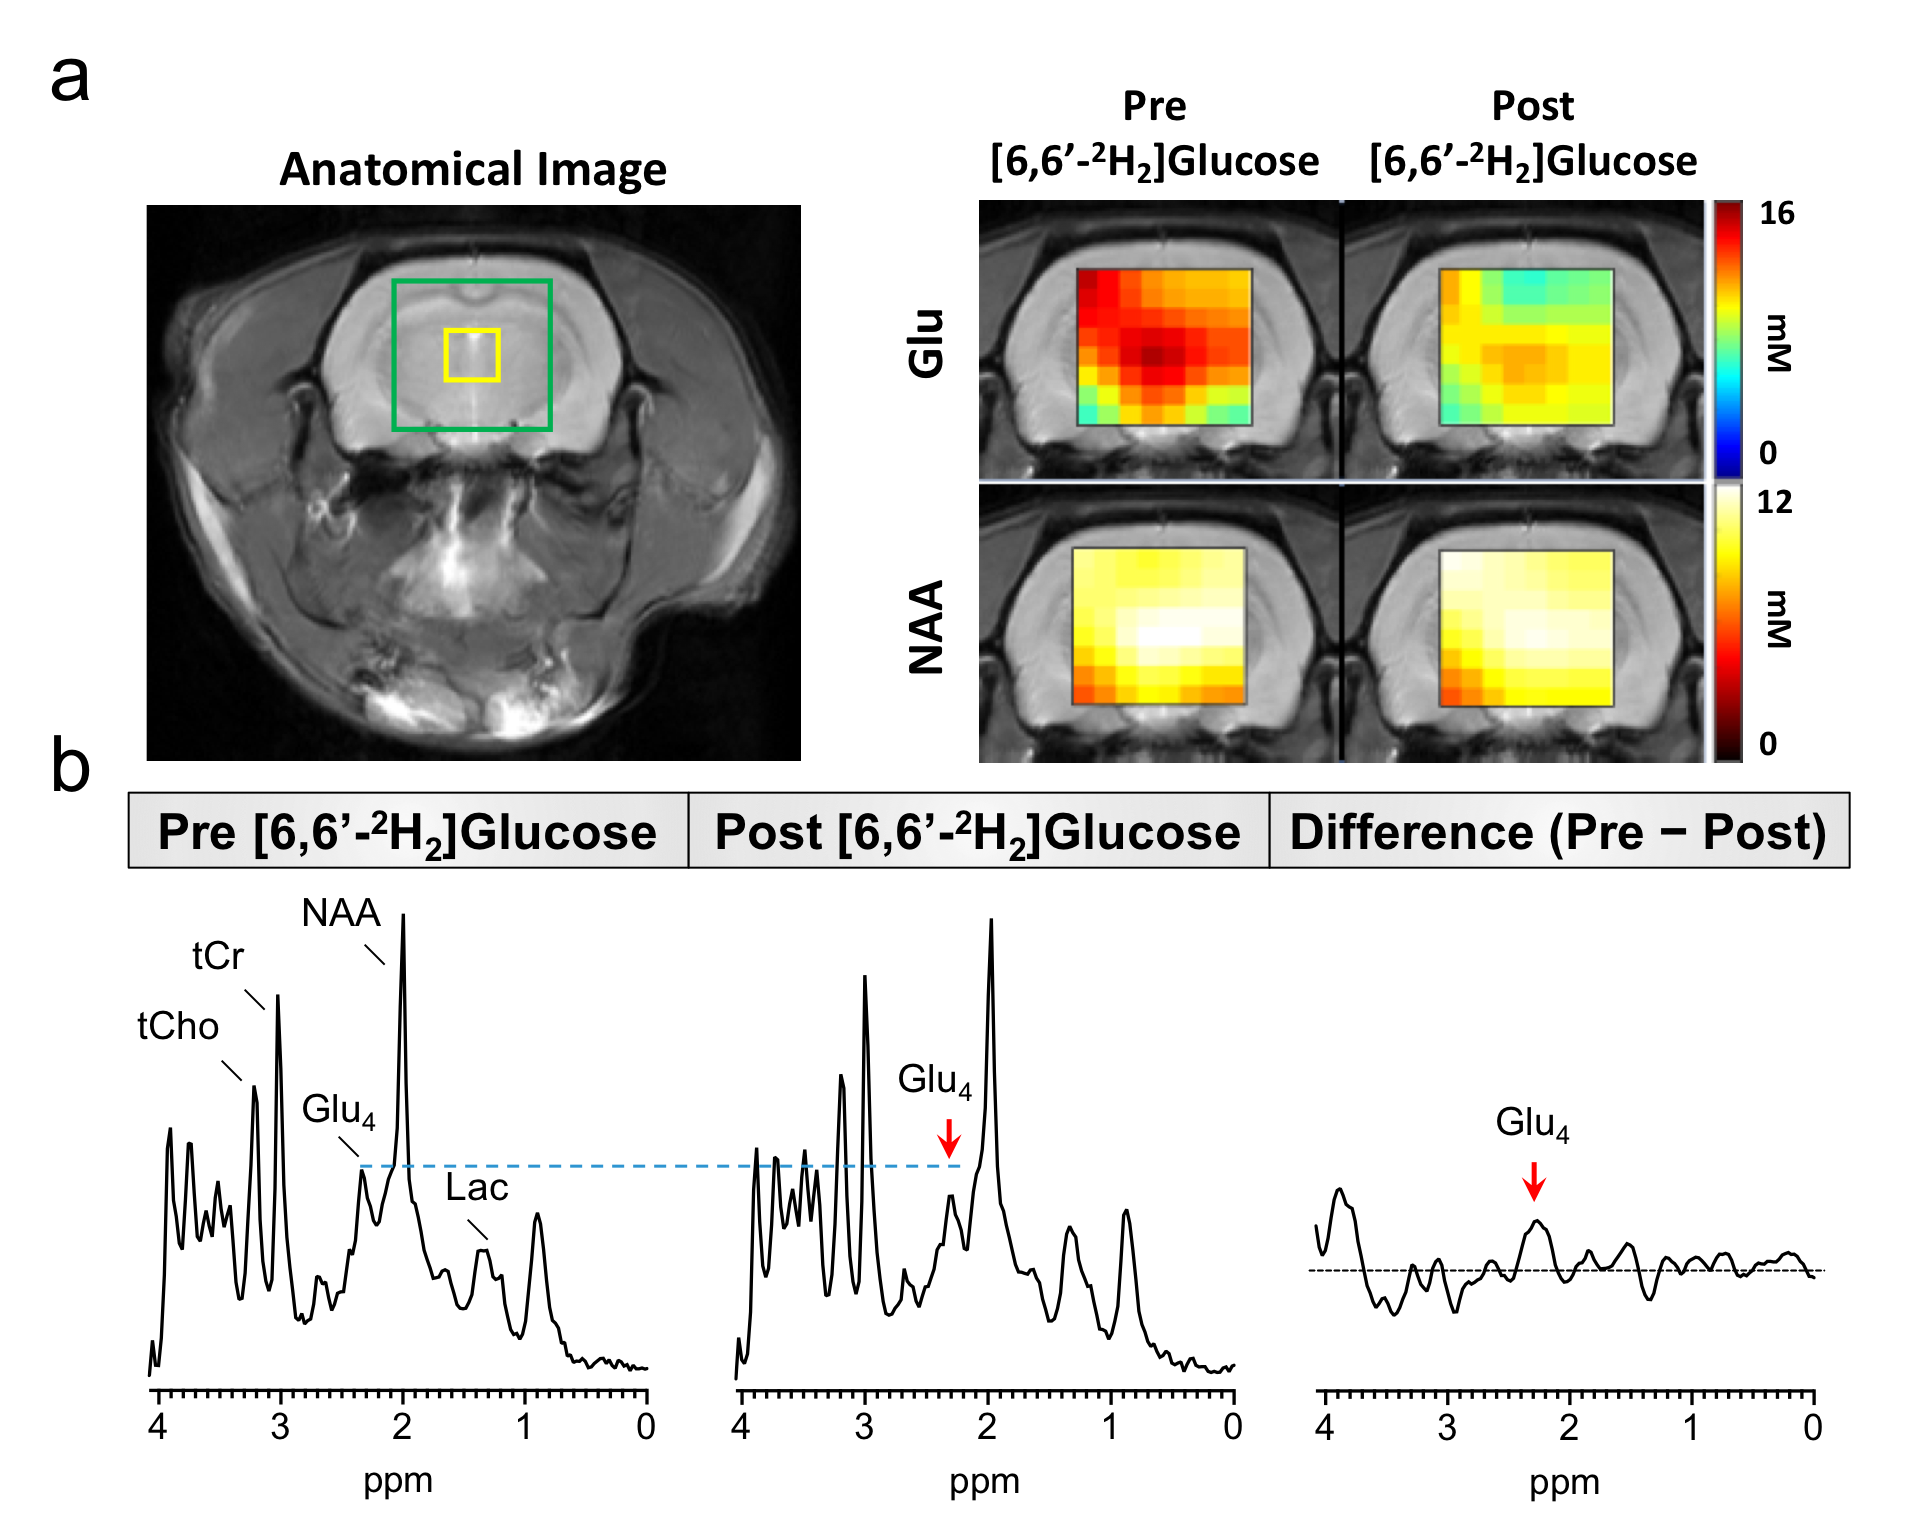
Fig 2 shows localized 1H MRS spectra from a rat brain before and after 60 minutes of [6,6′-2H2]glucose infusion. Post infusion, a reduction in the Glu-H4 amplitude at 2.35 ppm can be clearly observed. Subtraction of the post-infusion 1H MRS spectrum from the pre-infusion spectra revealed a marked increase in the 2.35 ppm Glu-H4 resonance, in addition to aspartate and several Glu, Gln, and GABA resonances. A large reduction in the difference spectrum was also observed between 3.3-3.6 ppm associated with non-deuterated proton resonances on the infused [6,6′-2H2]glucose. Fig 3 compares the time courses of eMRS and DMRS spectra pre- and post-infusion of [6,6′-2H2] labeled glucose. A clear Glx peak was observed using DMRS within 20 minutes of [6,6′-2H2]glucose infusion. Similarly, eMRS detected a reduction in the Glu-H4 peak beginning at 20 minutes post infusion. Comparison of labeling kinetics were in good agreement, with minimal bias observed between eMRS and DMRS Glx measurements (Fig 4). CSI enabled generation of Glu and NAA metabolite maps, with a clear reduction in Glu levels observed after [6,6′-2H2]glucose infusion, while little to no changes were observed in NAA (Fig 5A). Comparison of 1H MRS and difference spectrum confirmed these observations (Fig 5B).Discussion and Conclusions
Building on the recent advances of DMRS, we developed eMRS which relies on the indirect detection of transferred deuterium label from deuterated glucose to intermediate metabolites. As a proof of concept, we performed eMRS in the brain of healthy rats before and after administration of deuterium labeled glucose. As anticipated, infusion of [6,6′-2H2]glucose resulted in a clear decrease at several Glu, Gln, and GABA resonances, indicating exchange of 1H with 2H. eMRS based Glx measurements were also validated by DMRS. Furthermore, we showed that it is possible to extend this approach to spectroscopic imaging modes allowing labeling studies that can be performed across entire tissues. In summary, this proof-of-principal study highlights the potential of eMRS to track 2H based labeling of metabolites with high sensitivity, all of which can be simply performed with a traditional 1H MRS approach.Acknowledgements
Acknowledgements: The authors would thank Dr. Damodara Reddy for help with animal model preparation, Dr. Mark Elliot for his expertise on MRS acquisition and processing, and Drs. Stephen Pickup and Weixia Liu for their technical assistance in using the 9.4 T horizontal bore animal MR scanner.
Funding: This work was carried out at a US National Institutes of Health–supported resource, with funding from: the NIBIB under Grant No. P41 EB015893, National Institute of Neurological Disorders and Stroke Award Number R01NS087516 and the training grant T32EB020087-02.
References
1. DeBerardinis, R. J. & Thompson, C. B. Cellular metabolism and disease: what do metabolic outliers teach us? Cell. 148, 1132-1144 (2012).
2. Beckmann, N., Turkalj, I., Seelig, J., & Keller, U. Carbon-13 NMR for the assessment of human brain glucose metabolism in vivo. Biochemistry, 30, 6362-6366 (1991)
3. Shulman, R. G. & Rothman, D. L. 13C NMR of Intermediary Metabolism: Implications for Systemic Physiology . Annu. Rev. Physiol. 63, 15-48 (2001)
4. Lu, M., Zhu, X. H., Zhang, Y., Mateescu, G. & Chen, W. Quantitative assessment of brain glucose metabolic rates using in vivo deuterium magnetic resonance spectroscopy. J. Cereb. Blood Flow Metab. 37, 3518-3530 (2017)
5. De Feyter, H. M. et al. Deuterium metabolic imaging (DMI) for MRI-based 3D mapping of metabolism in vivo. Sci. Adv. 4, eaat7314 (2018)
6. Patlak, C. S., & Pettigrew, K. D. A method to obtain infusion schedules for prescribed blood concentration time courses. J. Appl. Physiol. 40, 458-463 (1976)
7. Provencher, S. W. Automatic quantitation of localized in vivo 1H spectra with LCModel. NMR Biomed. 14, 260-264 (2001)
8. Naressi, A., Couturier, C., Castang, I., de Beer, R. & Graveron-Demilly, D. Java-based graphical user interface for MRUI, a software package for quantitation of in vivo/medical magnetic resonance spectroscopy signals. Comput. Biol. Med. 31, 269–286 (2001)
Figures